. 2016 Jan 22;351(6271):375-8.
doi: 10.1126/science.aac4785.

Oxytocin-dependent consolation behavior in rodents

Affiliations

Oxytocin-dependent consolation behavior in rodents

J P Burkett et al. Science. .

Abstract

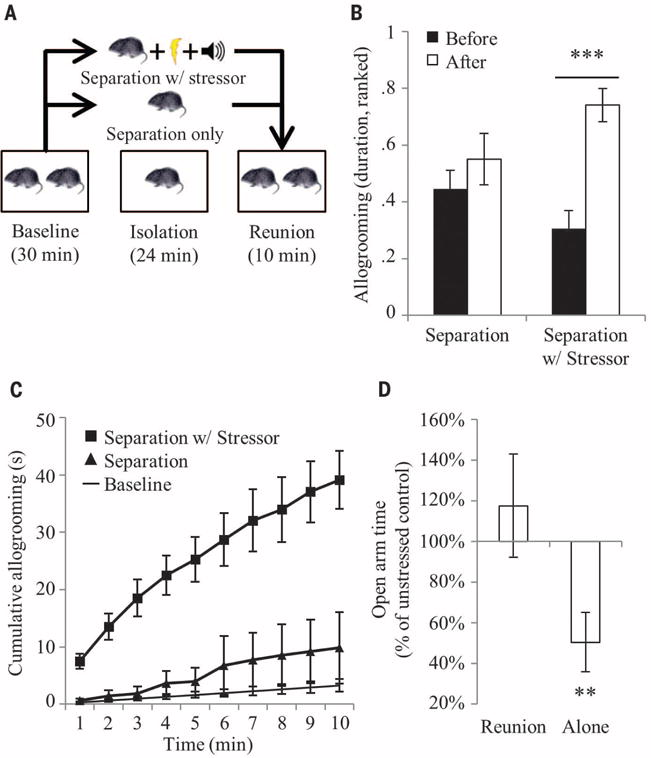
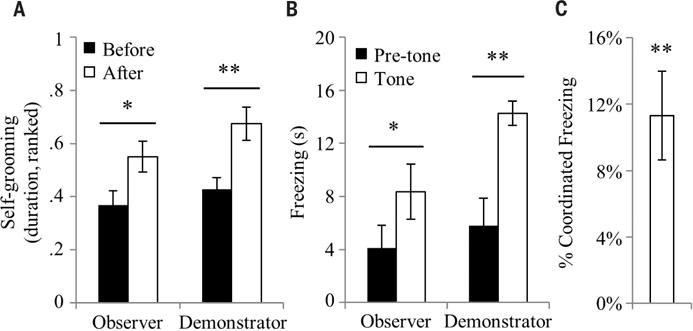
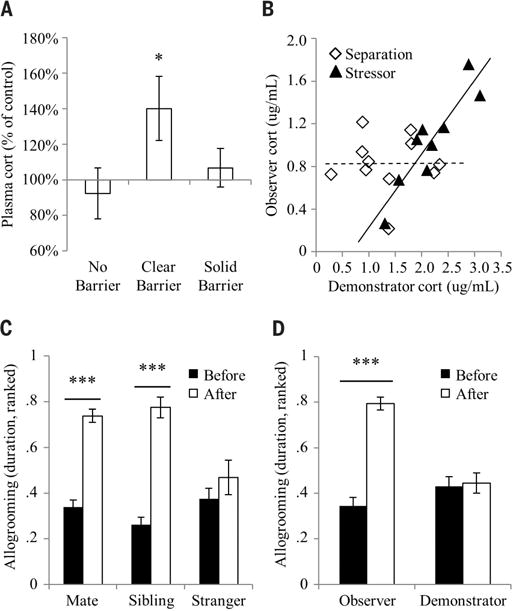
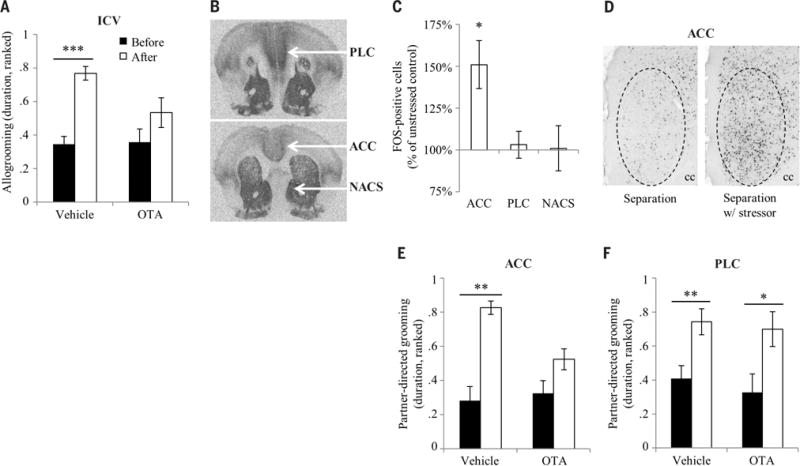
Consolation behavior toward distressed others is common in humans and great apes, yet our ability to explore the biological mechanisms underlying this behavior is limited by its apparent absence in laboratory animals. Here, we provide empirical evidence that a rodent species, the highly social and monogamous prairie vole (Microtus ochrogaster), greatly increases partner-directed grooming toward familiar conspecifics (but not strangers) that have experienced an unobserved stressor, providing social buffering. Prairie voles also match the fear response, anxiety-related behaviors, and corticosterone increase of the stressed cagemate, suggesting an empathy mechanism. Exposure to the stressed cagemate increases activity in the anterior cingulate cortex, and oxytocin receptor antagonist infused into this region abolishes the partner-directed response, showing conserved neural mechanisms between prairie vole and human.


Figures

Fig. 1
Fig. 1. The consolation test
(A) The consolation test protocol. (B) Observer-demonstrator pairs (n = 12 pairs) underwent both control separations without a stressor, and separations in which the demonstrator was stressed. Duration of allogrooming was nonparametric in these experiments and was transformed to ranks, and the ranks normalized to a 0–1 scale. Bars represent the mean ± SEM of the ranked duration of allogrooming directed by the observer toward the demonstrator. (C) A meta-analysis of results from 13 experiments shows the precise expected duration of observer-demonstrator allogrooming over the course of 10 min. Points represent cumulative seconds with 95% confidence intervals. (D) After resting alone in the home cage for 5 min, stressed demonstrators (n = 10 voles) showed a significant decrease in open-arm time on the elevated plus maze test relative to unstressed controls (n = 11 voles). Stressed (n = 11 voles) and unstressed (n = 11 voles) demonstrators reunited with the observer for 5 min showed no differences in open-arm time. Bars represent the mean ± SEM of the percent change in open-arm time between stressed and unstressed demonstrators. **P < 0.005, ***P < 0.0005.
Fig. 2
Fig. 2. Emotional contagion
Prairie vole observers exposed to a stressed demonstrator show anxiety-and fear-related responses that match the demonstrator’s responses. (A) Anxiety-related behavior was measured in observers and demonstrators (n = 24 pairs) interacting after reunion. Bars represent the mean ± SEM of the ranked duration of self-grooming performed by the observer and demonstrator. (B) Freezing was measured while fear-conditioned demonstrators and unconditioned observers (n = 12 pairs) were exposed together to a 30-s conditioned stimulus (CS). Bars represent the mean ± SEM of freezing before and after the CS. (C) Coordinated freezing during the CS between observer and demonstrator pairs (n = 12 pairs), calculated as the within-pair difference between the observed percent of simultaneous freezing and the simultaneous freezing expected by chance. *P < 0.05, **P < 0.005.
Fig. 3
Fig. 3. State matching, familiarity bias, and self-other differentiation
(A) Observer-demonstrator pairs underwent either control separations or separations with stressor and subsequently were either reunited in the home cage with no barrier (separated, n = 11 pairs; stressed, n = 12 pairs), reunited across a clear perforated barrier (separated, n = 11 pairs; stressed, n = 11 pairs), or in independent sections of the home cage separated by a solid opaque barrier (separated, n = 7 pairs; stressed, n = 9 pairs). Bars represent the mean ± SEM percent change in plasma corticosterone concentration in observers between the control separations and separations with stressor in each cage configuration. (B) Correlations between the plasma corticosterone concentrations of observers and demonstrators that interacted across a clear perforated barrier. The dashed and solid lines represent regression lines for the separation (n = 11 pairs) and stressor (n = 9 pairs) conditions, respectively. (C) Prairie vole mated pairs (n = 37 pairs), same-sex sibling pairs (n = 22 pairs), and same-sex stranger pairs (n = 20 pairs) underwent separations in which one cagemate was stressed. Bars represent the mean ± SEM of the ranked duration of allogrooming directed by the observer toward the demonstrator. (D) Observer-demonstrator pairs (n = 37 pairs) underwent separations during which the demonstrator was stressed. Bars represent the mean ± SEM of the ranked duration of allogrooming by either the observer or the demonstrator. *P < 0.05, **P < 0.005, ***P < 0.0005.
Fig. 4
Fig. 4. Neural mechanisms of consolation behavior
(A) Observers received an intracerebroventricular (ICV) injection of OTA (n = 16 voles) or vehicle (n = 12 voles) before the consolation test. Bars represent mean ± SEM. (B) Receptor autoradiographs show the presence of OTR in prairie vole PLC, ACC, and NACS. (C) Observers were administered a consolation test with control separations (n = 10 voles) or separations with stressor (n = 9 voles). Bars represent mean ± SEM. (D) Images show FOS immunoreactivity in the right ACC of observers representing the mean from each treatment group. Dashed circles show the quantified area. cc, corpus callosum. (E) Observers received a bilateral injection of OTA (n = 8 voles) or vehicle (n = 7 voles) directly into the ACC before the consolation test. Bars represent mean ± SEM. (F) Observers received a bilateral injection of OTA (n = 8 voles) or vehicle (n = 9 voles) directly into the PLC before the consolation test. Bars represent mean ± SEM. *P < 0.05, **P < 0.005, ***P < 0.0005.

Similar articles

Cited by

References

    1. Zahn-Waxler C, Radke-Yarrow M, Wagner E, Chapman M. Dev Psychol. 1992;28:126–136.
    1. de Waal FBM, van Roosmalen A. Behav Ecol Sociobiol. 1979;5:55–66.
    1. Clay Z, de Waal FBM. PLOS ONE. 2013;8:e55206. - PMC - PubMed
    1. Palagi E, Cordoni G. Anim Behav. 2009;78:979–986.
    1. Cools AKA, van Hout AJM, Nelissen MHJ. Ethology. 2008;114:53–63.

Publication types

LinkOut - more resources