. 2016 Apr;26(4):462-73.
doi: 10.1101/gr.196220.115. Epub 2016 Jan 21.

A-type lamins bind both hetero- and euchromatin, the latter being regulated by lamina-associated polypeptide 2 alpha

Affiliations

A-type lamins bind both hetero- and euchromatin, the latter being regulated by lamina-associated polypeptide 2 alpha

Kevin Gesson et al. Genome Res. 2016 Apr.

Abstract

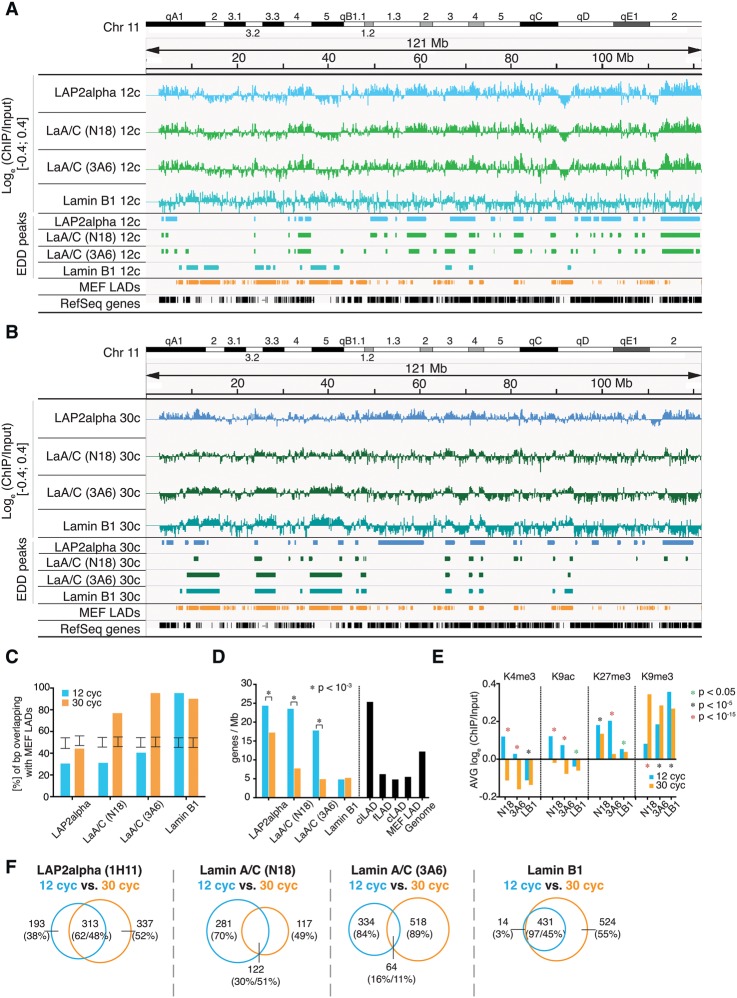
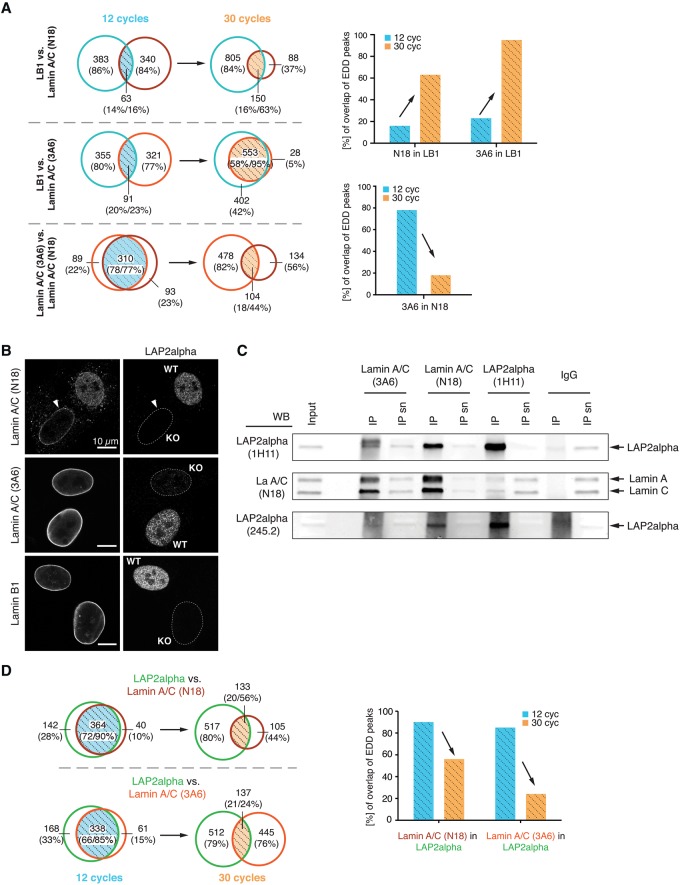
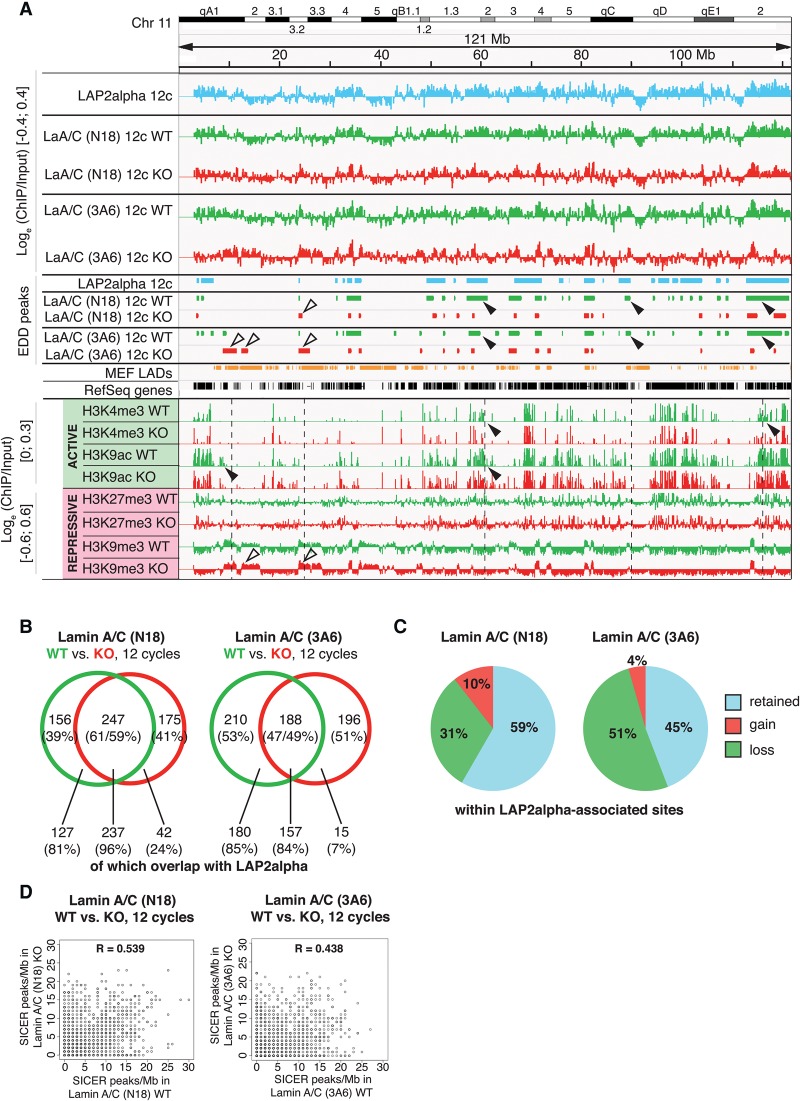
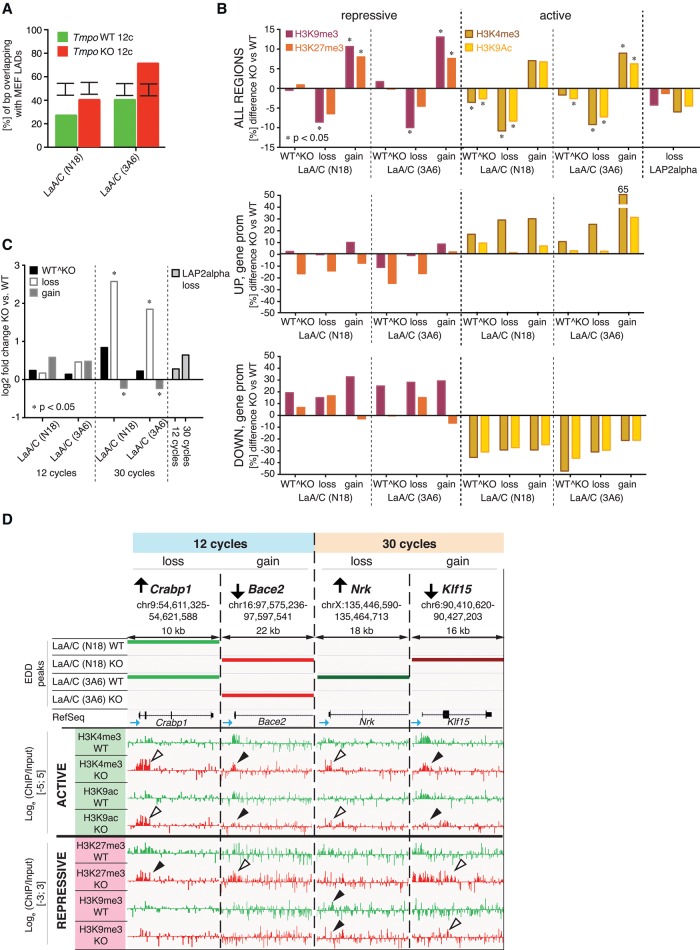
Lamins are components of the peripheral nuclear lamina and interact with heterochromatic genomic regions, termed lamina-associated domains (LADs). In contrast to lamin B1 being primarily present at the nuclear periphery, lamin A/C also localizes throughout the nucleus, where it associates with the chromatin-binding protein lamina-associated polypeptide (LAP) 2 alpha. Here, we show that lamin A/C also interacts with euchromatin, as determined by chromatin immunoprecipitation of euchromatin- and heterochromatin-enriched samples. By way of contrast, lamin B1 was only found associated with heterochromatin. Euchromatic regions occupied by lamin A/C overlap with those bound by LAP2alpha, and lack of LAP2alpha in LAP2alpha-deficient cells shifts binding of lamin A/C toward more heterochromatic regions. These alterations in lamin A/C-chromatin interactions correlate with changes in epigenetic histone marks in euchromatin but do not significantly affect gene expression. Loss of lamin A/C in heterochromatic regions in LAP2alpha-deficient cells, however, correlated with increased gene expression. Our data show a novel role of nucleoplasmic lamin A/C and LAP2alpha in regulating euchromatin.


Figures

Figure 1.
Figure 1.
LAP2alpha and Lamin A/C associate with eu- and heterochromatin. (A,B) Screenshot of Integrative Genomics Viewer (IGV) tracks of Chromosome 11 (mm9) representing loge ratios of ChIP/Input, scale is [−0.4;0.4] (upper panel); peak regions identified by EDD (mid panel); MEF LADs (GSE36132) and the RefSeq gene track (lower panel). Chromatin was sonicated for (A) 12 or (B) 30 cycles. ChIPs were performed with antibodies against LAP2alpha (8C10-1H11) and lamin A/C (3A6-4C11 and N18). (C) MEF LAD overlap. Degree of overlap (% of bp) of EDD peaks with MEF LADs. Error bars indicate the interval that contains 95% of all mean overlaps obtained through random permutation tests. All overlaps are significantly smaller or larger than expected under the null model (P < 10−4). (D) Gene density. Average gene density in EDD/DamID peak regions. Significance of gene density change from 12- to 30-cycle samples was tested using the Wilcoxon rank-sum test. (*) P < 10−3. (E) Histone marks in lamin-interacting sites. Average loge (ChIP/Input) of H3K4me3, H3K9ac, H3K27me3, and H3K9me3 in regions associated with lamin A/C and lamin B1. Differences between distributions of values from 12- to 30-cycle samples were tested by the Wilcoxon rank-sum test; green asterisk signifies P < 0.05, black asterisk P < 10−5, and red asterisk P < 10−15. (F) Extent of overlap between EDD peaks of LAP2alpha, lamin A/C, and lamin B1 after 12 and 30 cycles of sonication; numbers indicate Mb.
Figure 2.
Figure 2.
LAP2alpha and Lamin A/C overlap in euchromatic regions. (A) Venn diagrams of genome-wide overlapping EDD peaks (Mb) of lamin B1 and lamin A/C samples upon 12 and 30 cycles of sonication. Overlaps (hatched) of lamin A/C-3A6 and -N18 with lamin B1 and overlaps of lamin A/C-3A6 with -N18 are highlighted in light blue (12 cycles) and light orange (30 cycles), and the corresponding % of overlap of EDD peaks are depicted as bar graphs. (B) Confocal immunofluorescence microscopic images of a mixed culture of Tmpo WT and KO mouse dermal fibroblasts double-stained for LAP2alpha and lamins as indicated. Unstained nuclei in LAP2alpha panels are outlined by a white dashed line. Scale bar, 10 µm. (C) Co-IPs for lamin A/C-3A6, lamin A/C-N18, and LAP2alpha were performed in Tmpo WT imMDFs. Normal rabbit IgG was used as a negative control. (D) Venn diagrams of genome-wide overlapping EDD peaks (Mb) of LAP2alpha and Lamin A/C samples upon 12 and 30 cycles of sonication. Overlaps (hatched) of LAP2alpha with lamin A/C-3A6 and -N18 are highlighted in light blue (12 cycles) and light orange (30 cycles), and the corresponding % of overlap of EDD peaks are depicted as bar graphs.
Figure 3.
Figure 3.
Lamin A/C-chromatin associations are rearranged in LAP2alpha-deficient versus wild-type cells. (A) Screenshots of IGV tracks of Chromosome 11 (mm9) representing loge (ChIP/Input) [−0.4;0.4], peak regions identified by EDD, MEF LADs, the RefSeq gene track, and histone mark tracks. Shown are data for LAP2alpha and lamin A/C (precipitated with 3A6 or N18 antibodies in Tmpo WT and KO cells) after 12 cycles of sonication and data of histone marks after 12 cycles of sonication (scale for active marks H3K4me3 and H3K9ac is loge (ChIP/Input) [0;0.3] and for repressive marks H3K27me3 and H3K9me3 loge (ChIP/Input) [−0.6;0.6]). Black arrowheads point to regions of loss of lamin A/C or histone marks and white arrowheads to regions of gain of lamin A/C or histone marks in Tmpo KO cells. (B) Venn diagrams of EDD peak overlaps [Mb] between lamin A/C in Tmpo WT and KO samples after 12 cycles of sonication. Numbers below Venn diagram show overlap (in Mb and %) of lamin A/C EDD peak fractions (occurring only in WT, in WT and KO, or KO only) with LAP2alpha EDD peaks. (C) Redistribution of lamin A/C within LAP2alpha-associated sites. Pie chart depicting percentage of lamin A/C-associated regions (identified by antibodies N18 or 3A6) within the LAP2alpha-associated regions that retained, lost, or gained lamin A/C binding in Tmpo KO versus WT samples. (D) SICER peak correlations (peaks/Mb) corresponding to data in B.
Figure 4.
Figure 4.
Consequences of lamin A/C redistribution in LAP2alpha-deficient cells on chromatin organization and gene expression. (A) MEF LAD overlap. Degree of overlap (% of bp) of EDD peaks obtained after 12 cycles of sonication for lamin A/C-N18 and -3A6 in Tmpo WT and KO mouse fibroblasts with MEF LADs. Error bars indicate the interval that contains 95% of all mean overlaps obtained through random permutation tests. All overlaps are significantly smaller or larger than expected under the null model (P < 10−4). (B) Change in repressive and active histone marks. EDD peak regions of lamin A/C (N18 and 3A6) in Tmpo WT and KO cells were divided into regions occurring in both samples (“WT^KO”), losing association in Tmpo KO (“loss”), and gaining associations Tmpo KO (“gain”). Percent difference (Tmpo KO vs. WT) in the abundance of repressive (H3K27me3, H3K9me3) and active (H3K4me3, H3K9ac) histone marks present in all lamin A/C-N18 and -3A6 “WT^KO,” “loss,” and “gain” regions, all regions of LAP2alpha loss (ALL REGIONS) and promoter regions of up- (UP, gene promoter) and down-regulated (DOWN, gene promoter) in lamin A/C-N18 and -3A6 “WT^KO,” “loss,” and “gain” regions, after 12 sonication cycles. Asterisk (*) denotes significant change in histone mark abundance (P < 0.05) compared to random permutation testing. (C) Gene expression change. Average log2-fold change of differentially regulated genes in lamin A/C-N18 and -3A6 “WT^KO,” “loss,” and “gain” regions and regions of LAP2alpha loss after 12 and 30 sonication cycles. Asterisk (*) denotes significant gene expression change (P < 0.05) compared to random permutation testing. (D) Redistribution of lamin A/C upon loss of LAP2alpha alters gene expression and histone marks on promoters of affected genes. IGV track compilation of up- and down-regulated genes in regions of loss and gain of lamin A/C in euchromatin-enriched (12 cycle) and heterochromatin-enriched (30 cycle) regions. Shown are EDD peak tracks for lamin A/C-N18 and -3A6 in Tmpo WT and KO cells obtained after 12 and 30 cycles of sonication, followed by RefSeq tracks of the respective genes (blue arrow denotes direction of transcription) and histone mark data tracks obtained after 12 cycles of sonication; scale for active marks H3K4me3 and H3K9ac is loge (ChIP/Input) [−5;5] and for repressive marks H3K27me3 and H3K9me3 loge (ChIP/Input) [−3;3]. Black and white arrowheads point to regions of loss and gain of histone marks in Tmpo KO, respectively.

References

    1. Amendola M, van Steensel B. 2014. Mechanisms and dynamics of nuclear lamina–genome interactions. Curr Opin Cell Biol 28: 61–68. - PubMed
    1. Amendola M, van Steensel B. 2015. Nuclear lamins are not required for lamina-associated domain organization in mouse embryonic stem cells. EMBO Rep 16: 610–617. - PMC - PubMed
    1. Anders S, McCarthy DJ, Chen Y, Okoniewski M, Smyth GK, Huber W, Robinson MD. 2013. Count-based differential expression analysis of RNA sequencing data using R and Bioconductor. Nat Protoc 8: 1765–1786. - PubMed
    1. Barrowman J, Hamblet C, George CM, Michaelis S. 2008. Analysis of prelamin A biogenesis reveals the nucleus to be a CaaX processing compartment. Mol Biol Cell 19: 5398–5408. - PMC - PubMed
    1. Bickmore WA, van Steensel B. 2013. Genome architecture: domain organization of interphase chromosomes. Cell 152: 1270–1284. - PubMed

Publication types

MeSH terms