

Measurement of transient atomic displacements in thin films with picosecond and femtometer resolution
- PMID: 26798776
- PMCID: PMC4711600
- DOI: 10.1063/1.4875347
Measurement of transient atomic displacements in thin films with picosecond and femtometer resolution
Abstract
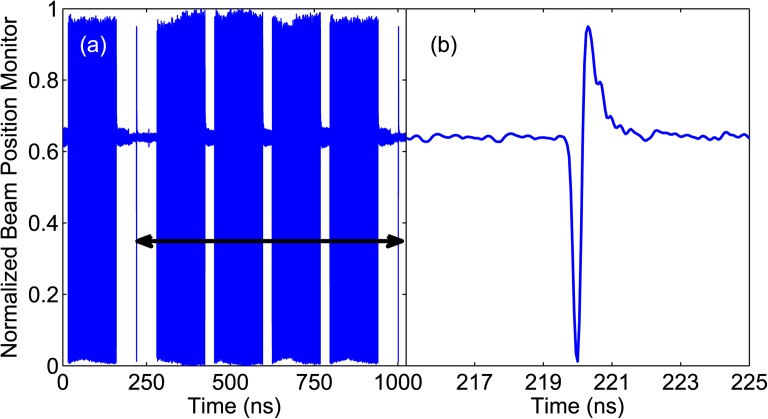
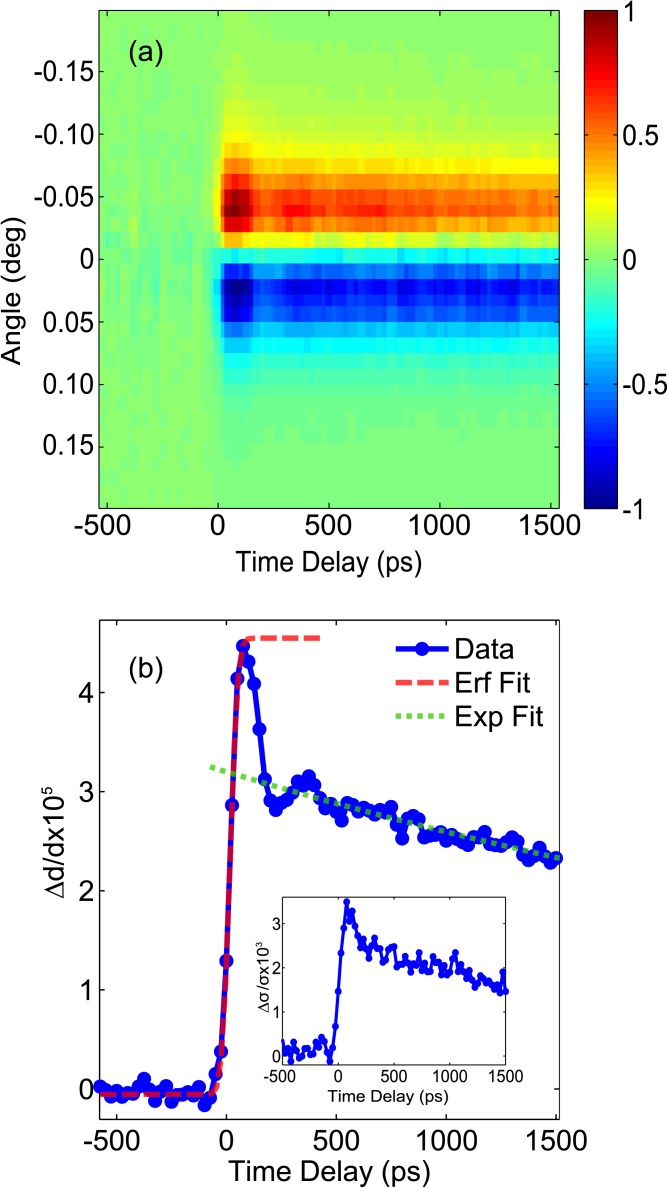
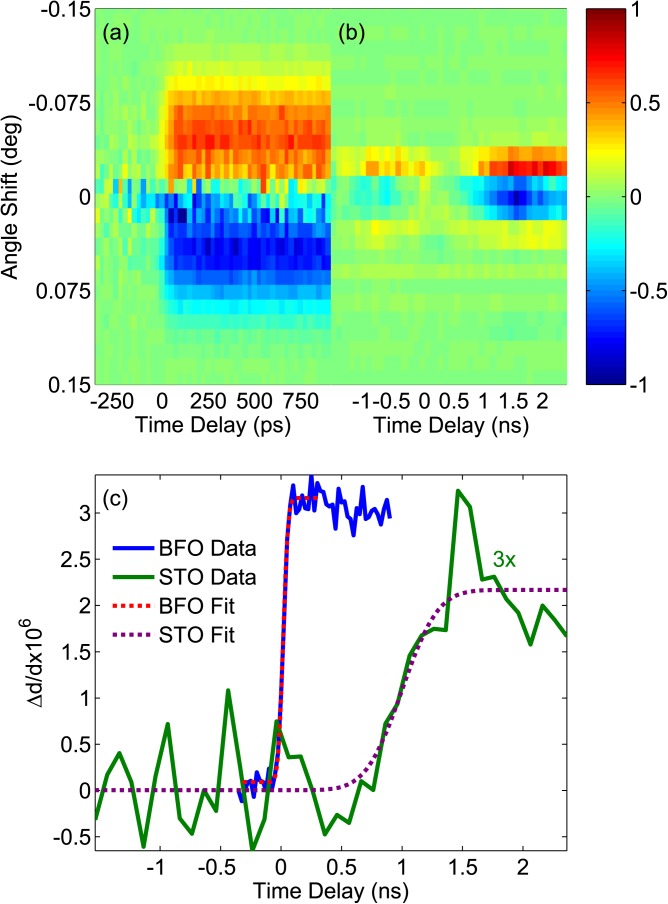
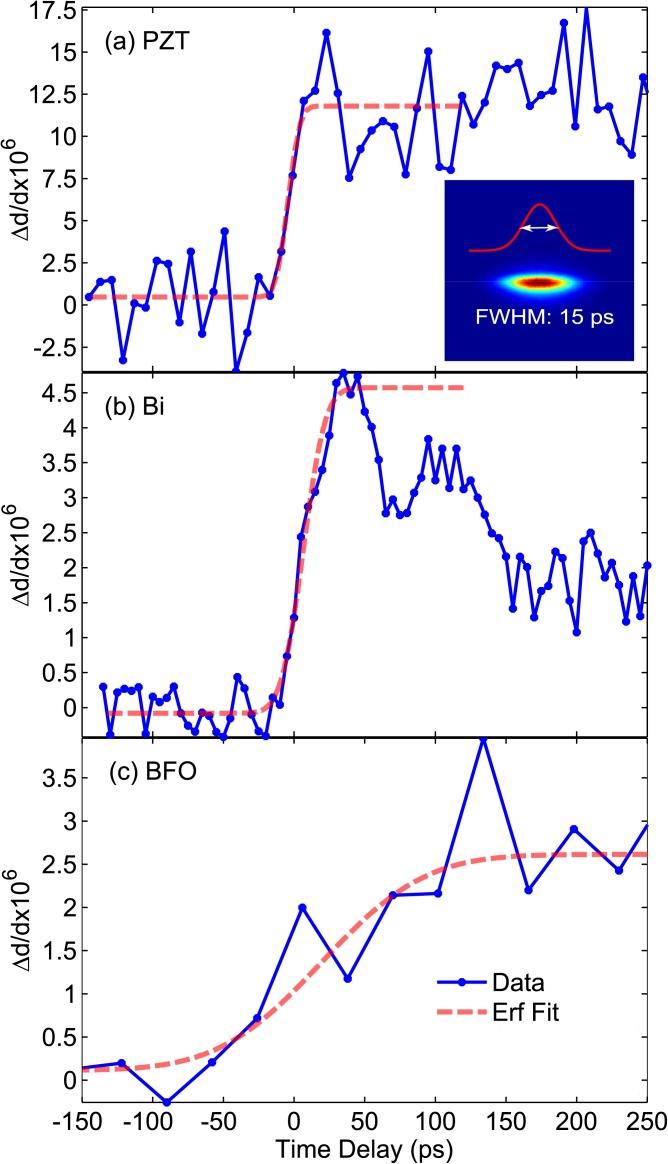
We report measurements of the transient structural response of weakly photo-excited thin films of BiFeO3, Pb(Zr,Ti)O3, and Bi and time-scales for interfacial thermal transport. Utilizing picosecond x-ray diffraction at a 1.28 MHz repetition rate with time resolution extending down to 15 ps, transient changes in the diffraction angle are recorded. These changes are associated with photo-induced lattice strains within nanolayer thin films, resolved at the part-per-million level, corresponding to a shift in the scattering angle three orders of magnitude smaller than the rocking curve width and changes in the interlayer lattice spacing of fractions of a femtometer. The combination of high brightness, repetition rate, and stability of the synchrotron, in conjunction with high time resolution, represents a novel means to probe atomic-scale, near-equilibrium dynamics.
Figures
References
-
- Sokolowski-Tinten K., Blome C., Dietrich C., Tarasevitch A., von Hoegen M. H., von der Linde D., Cavalleri A., Squier J., and Kammler M., “ Femtosecond x-ray measurement of ultrafast melting and large acoustic transients,” Phys. Rev. Lett. 87, 225701 (2001).10.1103/PhysRevLett.87.225701 - DOI - PubMed
-
- Lindenberg A. M., Kang I., Johnson S. L., Missalla T., Heimann P. A., Chang Z., Larsson J., Bucksbaum P. H., Kapteyn H. C., Padmore H. A., Lee R. W., Wark J. S., and Falcone R. W., “ Time-resolved x-ray diffraction from coherent phonons during a laser-induced phase transition,” Phys. Rev. Lett. 84, 111–114 (2000).10.1103/PhysRevLett.84.111 - DOI - PubMed
-
- Fritz D. M., Reis D. A., Adams B., Akre R. A., Arthur J., Blome C., Bucksbaum P. H., Cavalieri A. L., Engemann S., Fahy S., Falcone R. W., Fuoss P. H., Gaffney K. J., George M. J., Hajdu J., Hertlein M. P., Hillyard P. B., von Hoegen M. H., Kammler M., Kaspar J., Kienberger R., Krejcik P., Lee S. H., Lindenberg A. M., McFarland B., Meyer D., Montagne T., Murray E. D., Nelson A., Nicoul M., Pahl R., Rudati J., Schlarb H., Siddons D. P., Sokolowski-Tinten K., Tschentscher T., von der Linde D., and Hastings J. B., “ Ultrafast bond softening in bismuth: Mapping a solid's interatomic potential with x-rays,” Science 315, 633–636 (2007).10.1126/science.1135009 - DOI - PubMed
-
- Trigo M., Fuchs M., Chen J., Jiang M. P., Cammarata M., Fahy S., Fritz D. M., Gaffney K., Ghimire S., Higginbotham A., Johnson S. L., Kozina M. E., Larsson J., Lemke H., Lindenberg A. M., Ndabashimiye G., Quirin F., Sokolowski-Tinten K., Uher C., Wang G., Wark J. S., Zhu D., and Reis D. A., “ Fourier-transform inelastic x-ray scattering from time- and momentum-dependent phonon-phonon correlations,” Nat. Phys. 9, 790–794 (2013).10.1038/nphys2788 - DOI
-
- Highland M., Grundrum B. C., Koh Y. K., Averback R. S., Cahill D. G., Elarde V. C., Coleman J. J., Walko D. A., and Landahl E. C., “ Ballistic-phonon heat conduction at the nanoscale as revealed by time-resolved x-ray diffraction and time-domain thermoreflectance,” Phys. Rev. B 76, 075337 (2007).10.1103/PhysRevB.76.075337 - DOI
LinkOut - more resources
Full Text Sources
Other Literature Sources