. 2015 Apr 27;2(4):041702.
doi: 10.1063/1.4919301. eCollection 2015 Jul.

Perspectives for imaging single protein molecules with the present design of the European XFEL

Affiliations

Perspectives for imaging single protein molecules with the present design of the European XFEL

Kartik Ayyer et al. Struct Dyn. .

Abstract

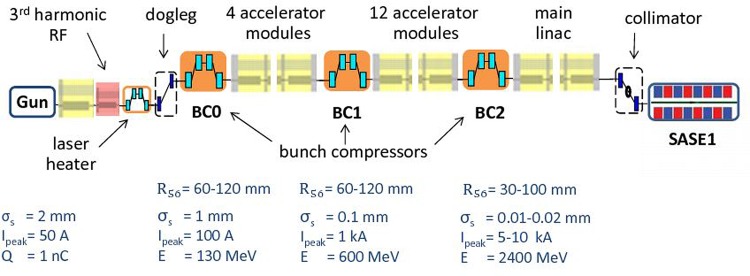
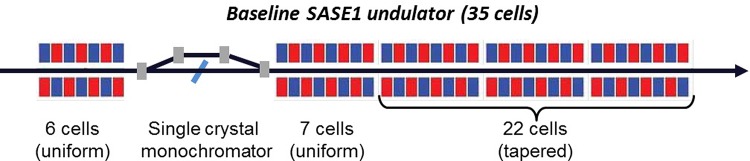
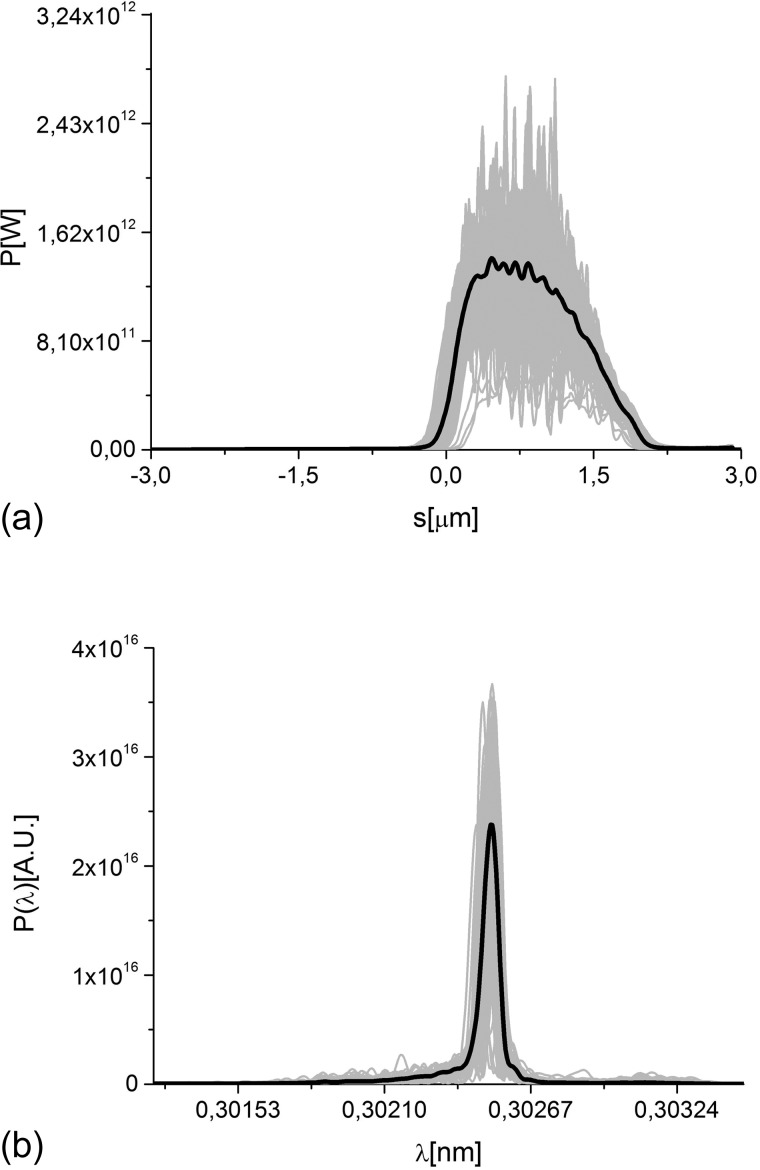
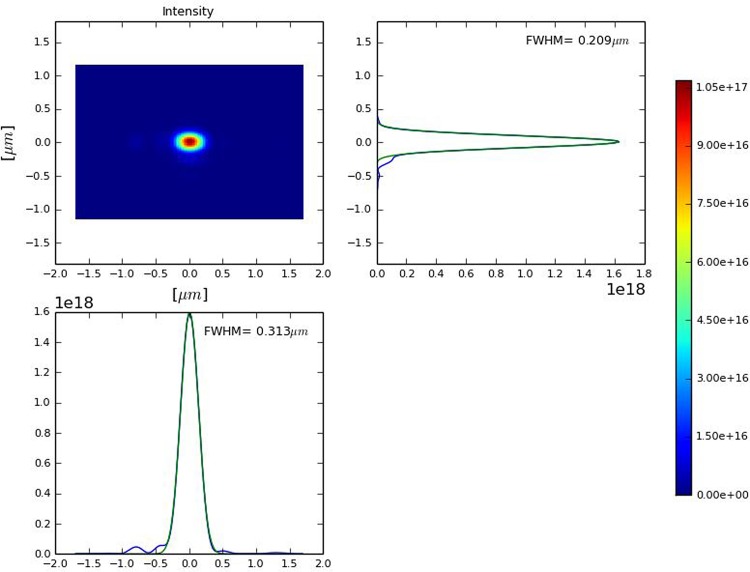
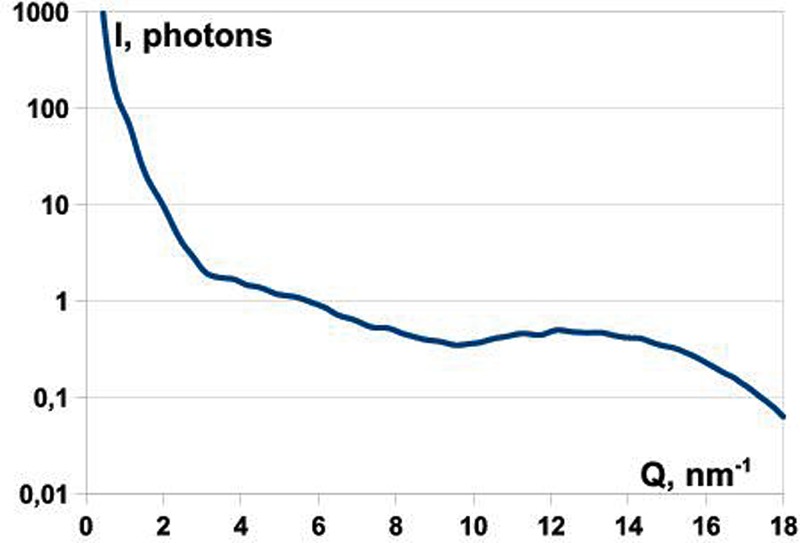
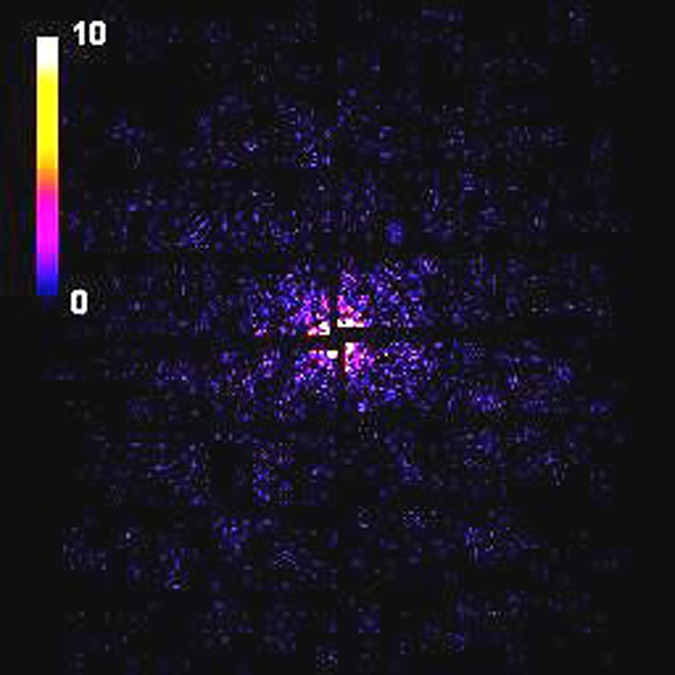
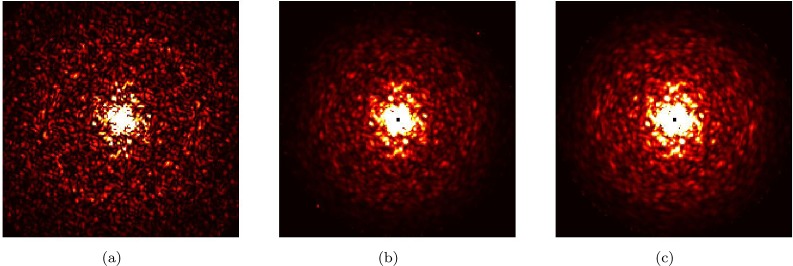
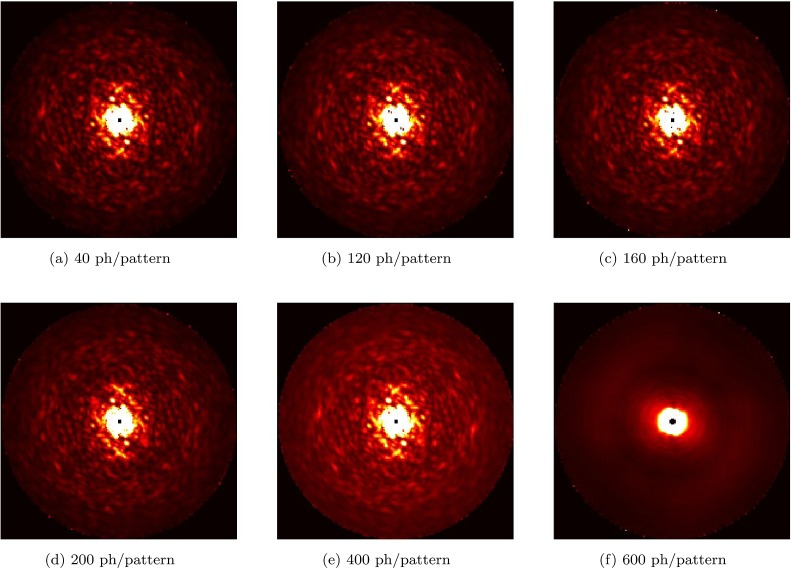
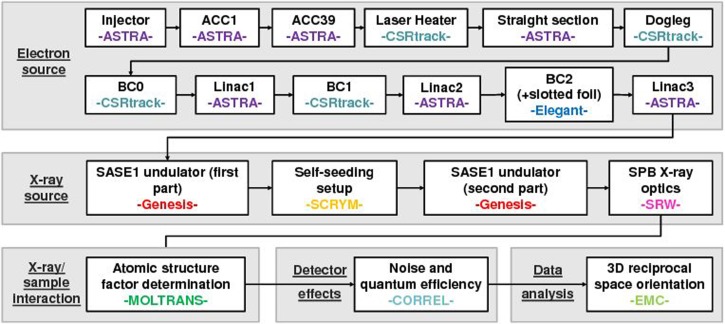
The Single Particles, Clusters and Biomolecules & Serial Femtosecond Crystallography (SPB/SFX) instrument at the European XFEL is located behind the SASE1 undulator and aims to support imaging and structure determination of biological specimen between about 0.1 μm and 1 μm size. The instrument is designed to work at photon energies from 3 keV up to 16 keV. Here, we propose a cost-effective proof-of-principle experiment, aiming to demonstrate the actual feasibility of a single molecule diffraction experiment at the European XFEL. To this end, we assume self-seeding capabilities at SASE1 and we suggest to make use of the baseline European XFEL accelerator complex-with the addition of a slotted-foil setup-and of the SPB/SFX instrument. As a first step towards the realization of an actual experiment, we developed a complete package of computational tools for start-to-end simulations predicting its performance. Single biomolecule imaging capabilities at the European XFEL can be reached by exploiting special modes of operation of the accelerator complex and of the SASE1 undulator. The output peak power can be increased up to more than 1.5 TW, which allows to relax the requirements on the focusing efficiency of the optics and to reach the required fluence without changing the present design of the SPB/SFX instrument. Explicit simulations are presented using the 15-nm size RNA Polymerase II molecule as a case study. Noisy diffraction patterns were generated and they were processed to generate the 3D intensity distribution. We discuss requirements to the signal-to-background ratio needed to obtain a correct pattern orientation. When these are fulfilled, our results indicate that one can achieve diffraction without destruction with about 0.1 photons per Shannon pixel per shot at 4 Å resolution with 10(13) photons in a 4 fs pulse at 4 keV photon energy and in a 0.3 μm focus, corresponding to a fluence of 10(14) photons/μm(2). We assume negligible structured background. At this signal level, one needs only about 30 000 diffraction patterns to recover full 3D information. At the highest repetition rate manageable by detectors at European XFEL, one will be able to accumulate these data within a fraction of an hour, even assuming a relatively low hit probability of about a percent.


Figures

FIG. 1.
FIG. 1.
Sketch of the European XFEL, SASE1.
FIG. 2.
FIG. 2.
Scheme for a 1 TW-level source for the SPB/SFX instrument. It combines emittance spoiler, self-seeding, and post-saturation tapering techniques.
FIG. 3.
FIG. 3.
Modulus and phase of the transmittance for the C(111) asymmetric Laue reflection at 4.1 keV.
FIG. 4.
FIG. 4.
Sketch of optical components for the SPB/SFX instrument.
FIG. 5.
FIG. 5.
Power distribution and spectrum of the output radiation pulse for the case of short (4 fs) pulse mode of operation.
FIG. 6.
FIG. 6.
Distribution of the radiation pulse energy per unit surface in the plane placed in the focus, integrated over the radiation pulse.
FIG. 7.
FIG. 7.
Radial average of the photon counts per Shannon angle vs. position along the detector in nm–1, starting from the center of the detector. The plot refers to a flux of 1022 photons/cm2.
FIG. 8.
FIG. 8.
Simulated diffraction pattern from the RNA Pol II test object as seen by AGIPD at a fluence of 1022 photons/cm2.
FIG. 9.
FIG. 9.
Comparison between ideal intensity distribution and reconstructed intensity distribution, using different number of patterns and fluences. (a) Central slice through the ideal intensity distribution of the RNA Pol II distribution. (b) Reconstructed intensity using 30 000 patterns with 4000 photons/pattern. (c) Same, using 300 000 patterns with 400 photons/pattern.
FIG. 10.
FIG. 10.
Study of the influence of uniform background on the 3D reconstruction. The plots show slices through reconstructed 3D intensities for uniform different background levels. In all cases, we started with 150 000 patterns assuming a 800 scattered photons/pattern. The uniform background level is increased from (a) 40 photons/pattern to (f) 600 photons/pattern. At 600 photons/pattern, the reconstruction fails in the manner shown.
FIG. 11.
FIG. 11.
Organization of start-to-end simulation program. The interested reader can look into Ref. for a more detailed description and a more complete set of references.

References

    1. Hajdu J., “ Single-molecule x-ray diffraction,” Curr. Opin. Struct. Biol. 10, 569–573 (2000). 10.1016/S0959-440X(00)00133-0 - DOI - PubMed
    1. Neutze R. et al. , “ Potential for biomolecular imaging with femtosecond x-ray pulses,” Nature 406, 752–757 (2000). 10.1038/35021099 - DOI - PubMed
    1. Gaffney K. and Chapman H., “ Imaging atomic structure and dynamics with ultrafast x-ray scattering,” Science 316, 1444–1448 (2007). 10.1126/science.1135923 - DOI - PubMed
    1. Seibert M. M. et al. , “ Single Mimivirus particles intercepted and imaged with an x-ray laser,” Nature 470, 78–81 (2011). 10.1038/nature09748 - DOI - PMC - PubMed
    1. Huldt G., Szoke A., and Hajdu J., Struct. Biol. 144, 219 (2003). 10.1016/j.jsb.2003.09.025 - DOI - PubMed