

Microfluidic sorting of protein nanocrystals by size for X-ray free-electron laser diffraction
- PMID: 26798818
- PMCID: PMC4711642
- DOI: 10.1063/1.4928688
Microfluidic sorting of protein nanocrystals by size for X-ray free-electron laser diffraction
Abstract
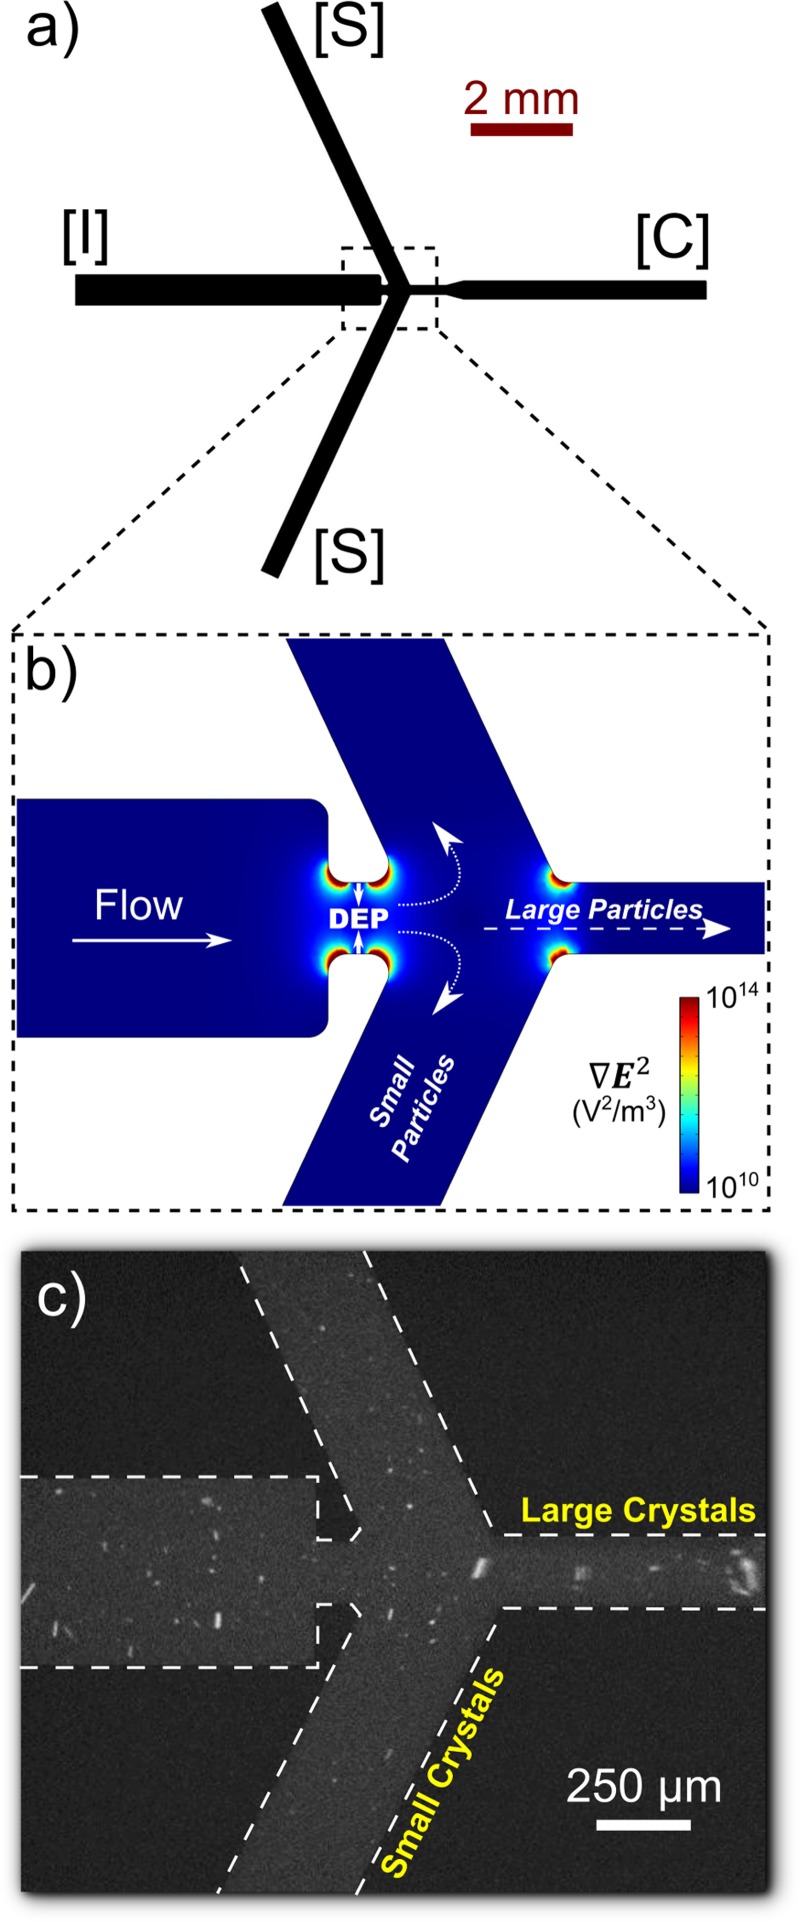
The advent and application of the X-ray free-electron laser (XFEL) has uncovered the structures of proteins that could not previously be solved using traditional crystallography. While this new technology is powerful, optimization of the process is still needed to improve data quality and analysis efficiency. One area is sample heterogeneity, where variations in crystal size (among other factors) lead to the requirement of large data sets (and thus 10-100 mg of protein) for determining accurate structure factors. To decrease sample dispersity, we developed a high-throughput microfluidic sorter operating on the principle of dielectrophoresis, whereby polydisperse particles can be transported into various fluid streams for size fractionation. Using this microsorter, we isolated several milliliters of photosystem I nanocrystal fractions ranging from 200 to 600 nm in size as characterized by dynamic light scattering, nanoparticle tracking, and electron microscopy. Sorted nanocrystals were delivered in a liquid jet via the gas dynamic virtual nozzle into the path of the XFEL at the Linac Coherent Light Source. We obtained diffraction to ∼4 Å resolution, indicating that the small crystals were not damaged by the sorting process. We also observed the shape transforms of photosystem I nanocrystals, demonstrating that our device can optimize data collection for the shape transform-based phasing method. Using simulations, we show that narrow crystal size distributions can significantly improve merged data quality in serial crystallography. From this proof-of-concept work, we expect that the automated size-sorting of protein crystals will become an important step for sample production by reducing the amount of protein needed for a high quality final structure and the development of novel phasing methods that exploit inter-Bragg reflection intensities or use variations in beam intensity for radiation damage-induced phasing. This method will also permit an analysis of the dependence of crystal quality on crystal size.
Figures


Similar articles
-
High throughput protein nanocrystal fractionation in a microfluidic sorter.Anal Chem. 2015 Apr 21;87(8):4159-67. doi: 10.1021/acs.analchem.5b00589. Epub 2015 Apr 7. Anal Chem. 2015. PMID: 25794348 Free PMC article.
-
Toward structure determination using membrane-protein nanocrystals and microcrystals.Methods. 2011 Dec;55(4):387-404. doi: 10.1016/j.ymeth.2011.12.006. Epub 2011 Dec 22. Methods. 2011. PMID: 22197730 Free PMC article. Review.
-
Structure-factor analysis of femtosecond microdiffraction patterns from protein nanocrystals.Acta Crystallogr A. 2011 Mar;67(Pt 2):131-40. doi: 10.1107/S0108767310050981. Epub 2011 Feb 16. Acta Crystallogr A. 2011. PMID: 21325716 Free PMC article.
-
Femtosecond X-ray diffraction from two-dimensional protein crystals.IUCrJ. 2014 Feb 28;1(Pt 2):95-100. doi: 10.1107/S2052252514001444. eCollection 2014 Mar 1. IUCrJ. 2014. PMID: 25075325 Free PMC article.
-
Assessment of microcrystal quality by transmission electron microscopy for efficient serial femtosecond crystallography.Arch Biochem Biophys. 2016 Jul 15;602:61-68. doi: 10.1016/j.abb.2016.02.011. Epub 2016 Mar 2. Arch Biochem Biophys. 2016. PMID: 26944553 Free PMC article. Review.
Cited by
-
Dynamic Structural Biology Experiments at XFEL or Synchrotron Sources.Methods Mol Biol. 2021;2305:203-228. doi: 10.1007/978-1-0716-1406-8_11. Methods Mol Biol. 2021. PMID: 33950392 Review.
-
Sample delivery for serial crystallography at free-electron lasers and synchrotrons.Acta Crystallogr D Struct Biol. 2019 Feb 1;75(Pt 2):178-191. doi: 10.1107/S205979831801567X. Epub 2019 Jan 9. Acta Crystallogr D Struct Biol. 2019. PMID: 30821706 Free PMC article. Review.
-
A capillary-based microfluidic device enables primary high-throughput room-temperature crystallographic screening.J Appl Crystallogr. 2021 Jun 14;54(Pt 4):1034-1046. doi: 10.1107/S1600576721004155. eCollection 2021 Aug 1. J Appl Crystallogr. 2021. PMID: 34429718 Free PMC article.
-
All polymer microfluidic chips-A fixed target sample delivery workhorse for serial crystallography.Biomicrofluidics. 2023 Oct 13;17(5):051302. doi: 10.1063/5.0167164. eCollection 2023 Sep. Biomicrofluidics. 2023. PMID: 37840537 Free PMC article.
-
Successful sample preparation for serial crystallography experiments.J Appl Crystallogr. 2019 Nov 14;52(Pt 6):1385-1396. doi: 10.1107/S1600576719013517. eCollection 2019 Dec 1. J Appl Crystallogr. 2019. PMID: 31798361 Free PMC article.
References
-
- Fromme P. and Witt H. T., “ Improved isolation and crystallization of photosystem I for structural analysis,” Biochim. Biophys. Acta, Bioenerg. 1365(1–2), 175 (1998).10.1016/S0005-2728(98)00059-0 - DOI
-
- Fromme P. and Grotjohann I., “ Crystallization of photosynthetic membrane proteins,” Curr. Top. Membr. 63, 191 (2009).10.1016/S1063-5823(09)63009-X - DOI
Grants and funding
LinkOut - more resources
Full Text Sources
Other Literature Sources