. 2015 Aug 18;2(5):054301.
doi: 10.1063/1.4928715. eCollection 2015 Sep.

A liquid flatjet system for solution phase soft-x-ray spectroscopy

Affiliations

A liquid flatjet system for solution phase soft-x-ray spectroscopy

Maria Ekimova et al. Struct Dyn. .

Abstract

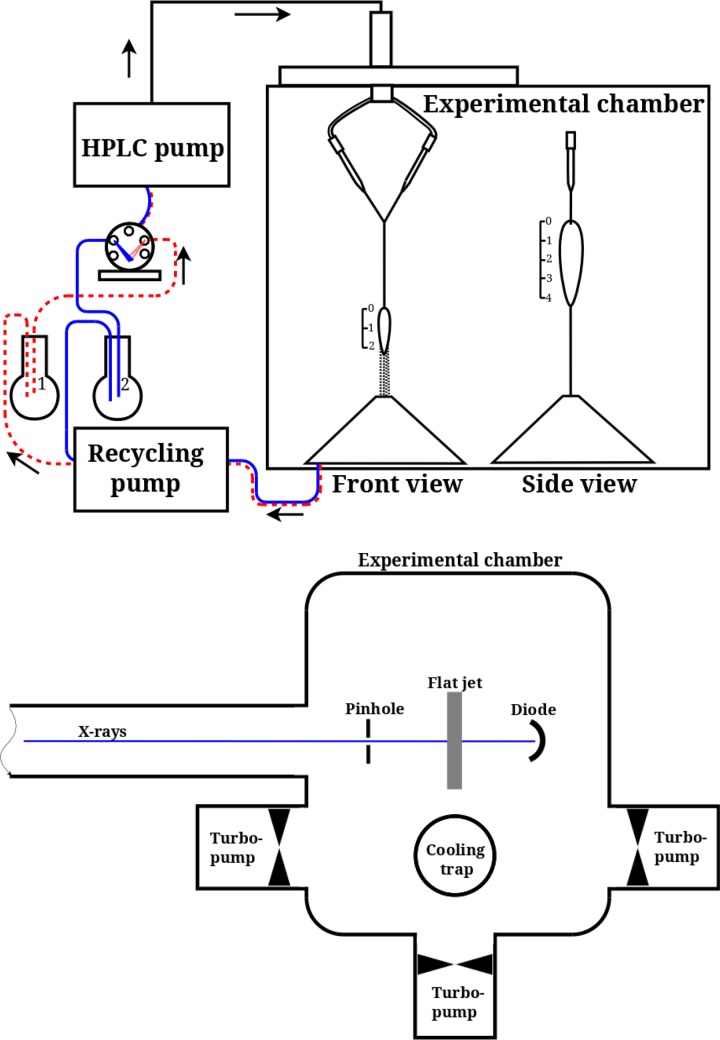
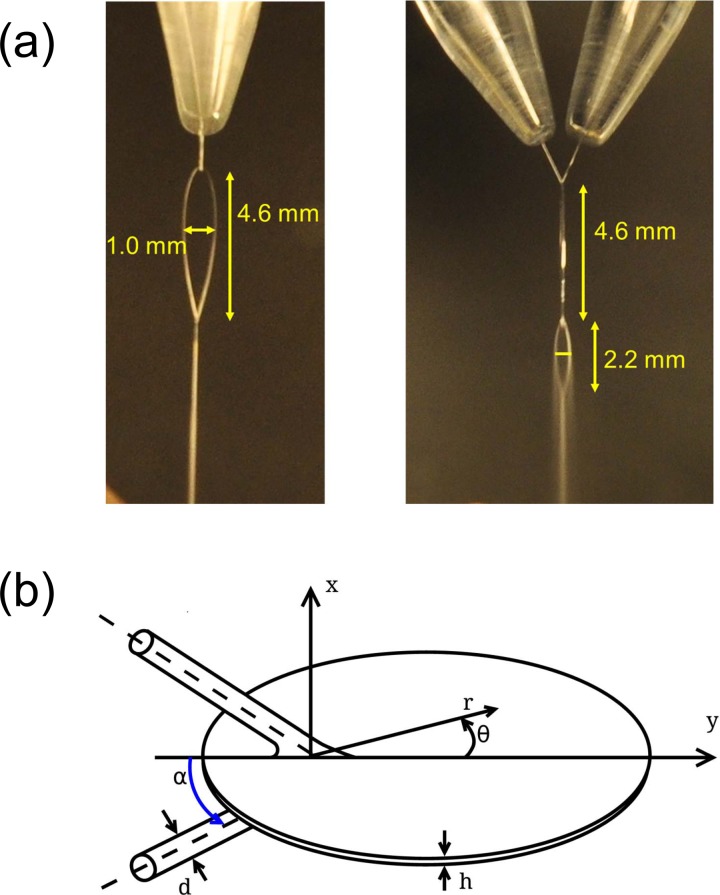
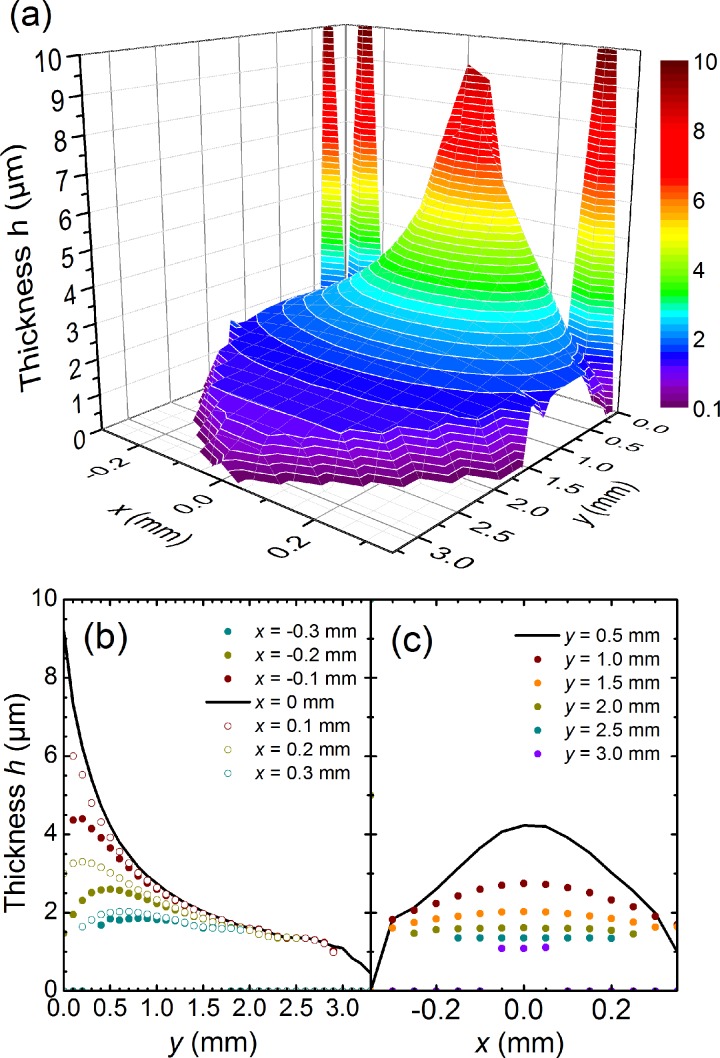
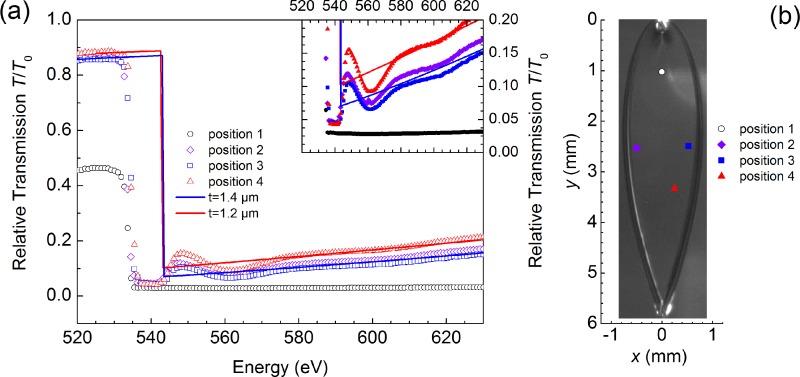
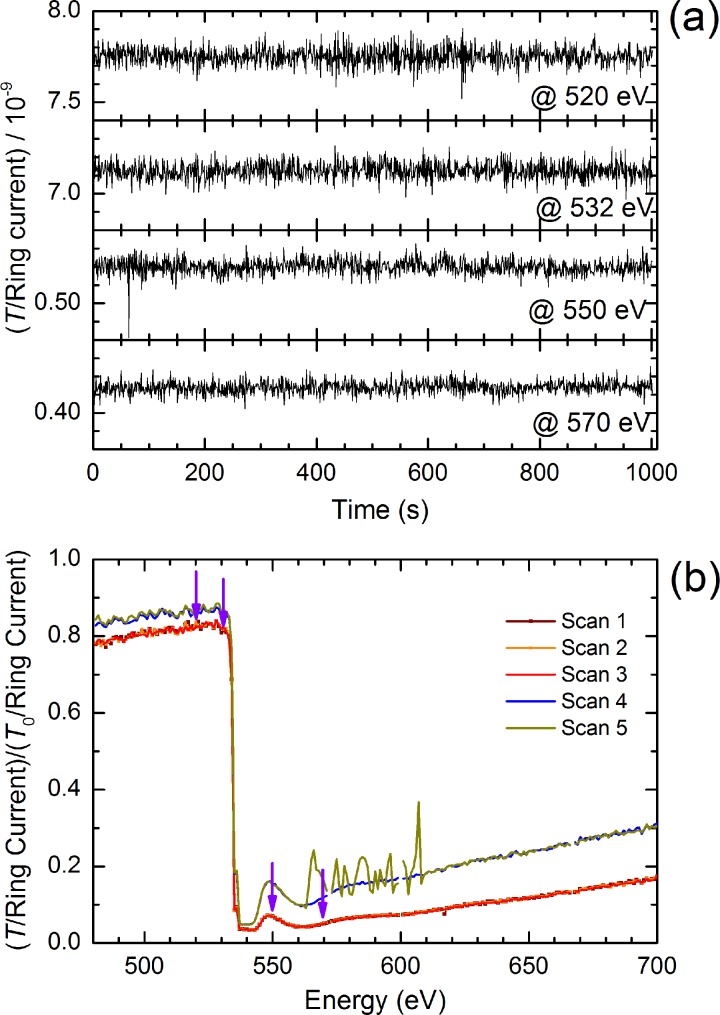
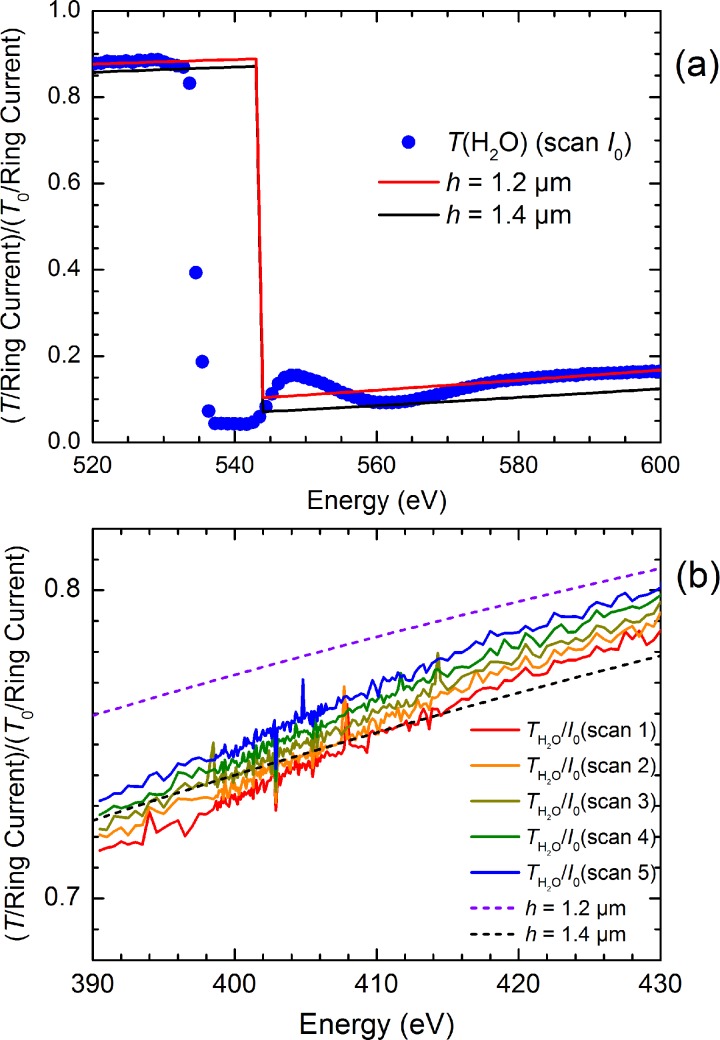
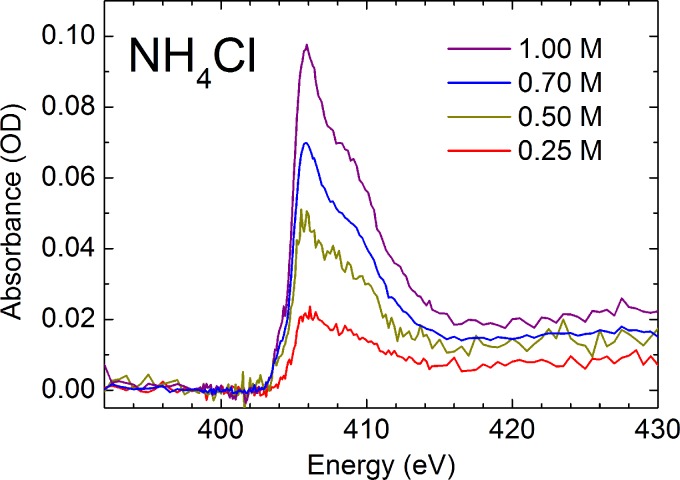
We present a liquid flatjet system for solution phase soft-x-ray spectroscopy. The flatjet set-up utilises the phenomenon of formation of stable liquid sheets upon collision of two identical laminar jets. Colliding the two single water jets, coming out of the nozzles with 50 μm orifices, under an impact angle of 48° leads to double sheet formation, of which the first sheet is 4.6 mm long and 1.0 mm wide. The liquid flatjet operates fully functional under vacuum conditions (<10(-3) mbar), allowing soft-x-ray spectroscopy of aqueous solutions in transmission mode. We analyse the liquid water flatjet thickness under atmospheric pressure using interferomeric or mid-infrared transmission measurements and under vacuum conditions by measuring the absorbance of the O K-edge of water in transmission, and comparing our results with previously published data obtained with standing cells with Si3N4 membrane windows. The thickness of the first liquid sheet is found to vary between 1.4-3 μm, depending on the transverse and longitudinal position in the liquid sheet. We observe that the derived thickness is of similar magnitude under 1 bar and under vacuum conditions. A catcher unit facilitates the recycling of the solutions, allowing measurements on small sample volumes (∼10 ml). We demonstrate the applicability of this approach by presenting measurements on the N K-edge of aqueous NH4 (+). Our results suggest the high potential of using liquid flatjets in steady-state and time-resolved studies in the soft-x-ray regime.


Figures

FIG. 1.
FIG. 1.
Liquid flatjet system used for solution phase soft-x-ray absorption spectroscopy, consisting of an HPLC pump, directing the liquid solution from a reservoir to two nozzles placed in a vacuum chamber, resulting in two single laminar jets with 50 μm thickness obliquely colliding under an angle of 2α = 48°. The colliding jet geometry is shown from two orthogonal directions, showing the formation of two flatjet sheets with planes orthogonal to each other. The scaling is in mm units. The liquid jet is then directed to a catcher unit and recycled back to a solution reservoir. The vacuum chamber used in the UE52-SGM beamline, equipped with differential pumping, is depicted underneath. For further details, see the text.
FIG. 2.
FIG. 2.
(a) Photo of the liquid flatjet taken from two orthogonal directions, showing the formation of a stable first sheet, as well as the second sheet exhibiting the onset of formation of small droplets. (b) Sketch of the flatjet with parameters as defined in Eq. (1). The x-direction indicates the transverse spatial extension of the first liquid sheet, the y-direction points to the flow direction of the flatjet, whereas the z-direction indicates, together with the flow direction, the plane of the two colliding single jets.
FIG. 3.
FIG. 3.
Thickness determination using interferometric measurements for a flatjet formed by colliding two 45 μm single jets with a flow rate of 3.9 ml/min under an angle of 2α = 45° under atmospheric conditions (Note: the orifice diameter and incident angle are slightly different from the soft-x-ray experiments). (a) 3D representation of the measured data. (b) Cut along the y-direction for different values of x, showing the gradual decrease of thickness along flow direction. (c) Transverse cuts along the x-direction for different values of y, showing the gradual flattening along the flow direction. The large values going off scale have resulted from the interferometric set-up probing the thicker rim boundary of the flatjet.
FIG. 4.
FIG. 4.
Soft-x-ray transmission spectra of the liquid water flatjet near the O K-edge. Measurements were recorded at different positions in the flatjet. Experimental results (dots) are compared with values calculated using the Henke tables (solid lines) using a water flatjet thickness h ranging from 1.4–2.1 μm. The inset shows a blow-up of the recorded transmission spectra around the edge jump absorption at the O K-edge. These spectra were each recorded on a 15 min time scale. The positions of the different scans are indicated in the sketch of the flatjet. The photo of the flatjet was not taken during these measurements and should only be considered as a guide.
FIG. 5.
FIG. 5.
(a) Time scan measurements of the transmission signal at different energy positions near the O K-edge of water. (b) Energy scan measurements performed at different spatial positions. Note, the dark yellow curve shows a measurement during which a disruption event of the flatjet occurred, with a successful restoration of the initial thickness and stability parameters, after the disruption event passed by. These spectra were each recorded on a 15 min time scale. Scans 1, 2, and 3 were recorded for one position; scans 4 and 5 were recorded for a different position.
FIG. 6.
FIG. 6.
(a) Soft-x-ray transmission spectra of water at the O K-edge as well as in the spectral region of the N K-edge, suggesting a jet thickness of 1.2–1.4 μm. (b) Subsequent scans of transmission spectra of water in the N K-edge spectral region. Note the different y-axis scaling in panels (a) and (b). The O K-edge spectrum was recorded on a 15 min time scale. The N K-edge spectra were each recorded on a 10 min time scale.
FIG. 7.
FIG. 7.
N K-edge absorption of aqueous solutions of NH4+, showing a linear concentration dependence in the absorption magnitude of the main edge feature. The spectra are the result of 3 scans (0.25 M and 0.70 M), or 1 scan (0.50 M and 1.00 M), where 1 scan typically lasted 10 min.

References

    1. Winter B. and Faubel M., Chem. Rev. 106, 1176 (2006).10.1021/cr040381p - DOI - PubMed
    1. Faubel M., Siefermann K. R., Liu Y., and Abel B., Acc. Chem. Res. 45, 120 (2012).10.1021/ar200154w - DOI - PubMed
    1. Nishizawa K., Kurahashi N., Sekiguchi K., Mizuno T., Ogi Y., Horio T., Oura M., Kosugi N., and Suzuki T., Phys. Chem. Chem. Phys. 13, 413 (2011).10.1039/C0CP01636E - DOI - PubMed
    1. Lange K. M., Kothe A., and Aziz E. F., Phys. Chem. Chem. Phys. 14, 5331 (2012).10.1039/c2cp24028a - DOI - PubMed
    1. Brown M. A., Arrigoni M., Heroguel F., Redondo A. B., Giordano L., van Bokhoven J. A., and Pacchioni G., J. Phys. Chem. C 118, 29007 (2014).10.1021/jp502262f - DOI