. 2016 Mar:83:332-46.
doi: 10.1016/j.biomaterials.2016.01.020. Epub 2016 Jan 7.

Evaluation of cell-laden polyelectrolyte hydrogels incorporating poly(L-Lysine) for applications in cartilage tissue engineering

Affiliations

Evaluation of cell-laden polyelectrolyte hydrogels incorporating poly(L-Lysine) for applications in cartilage tissue engineering

Johnny Lam et al. Biomaterials. 2016 Mar.

Abstract

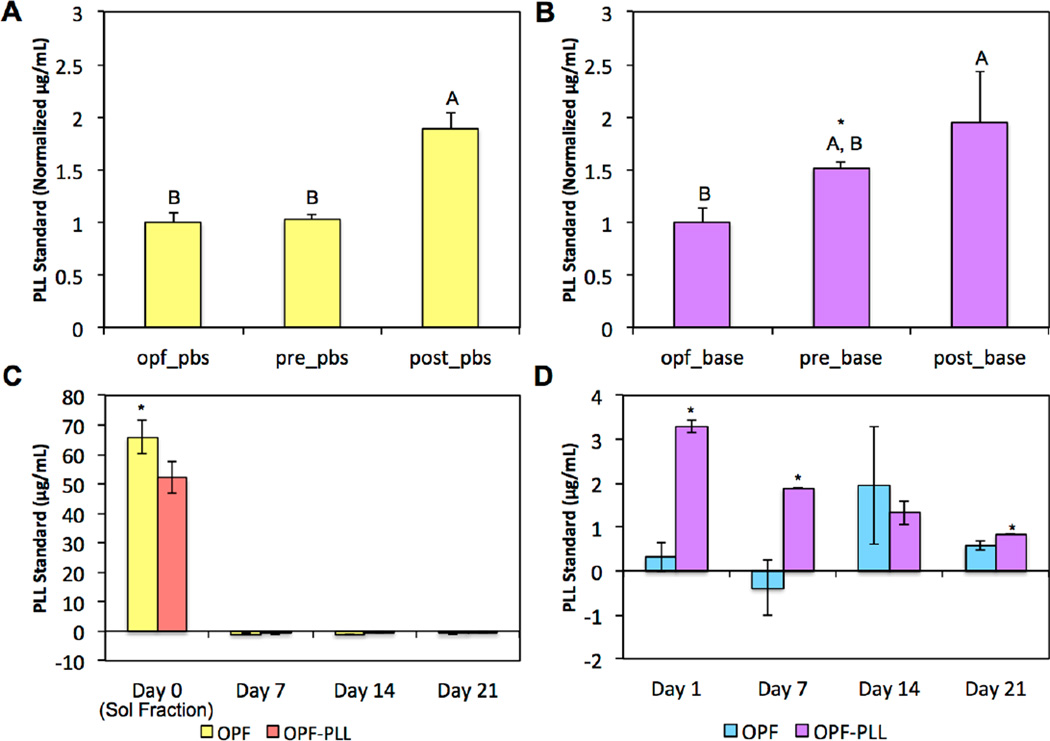
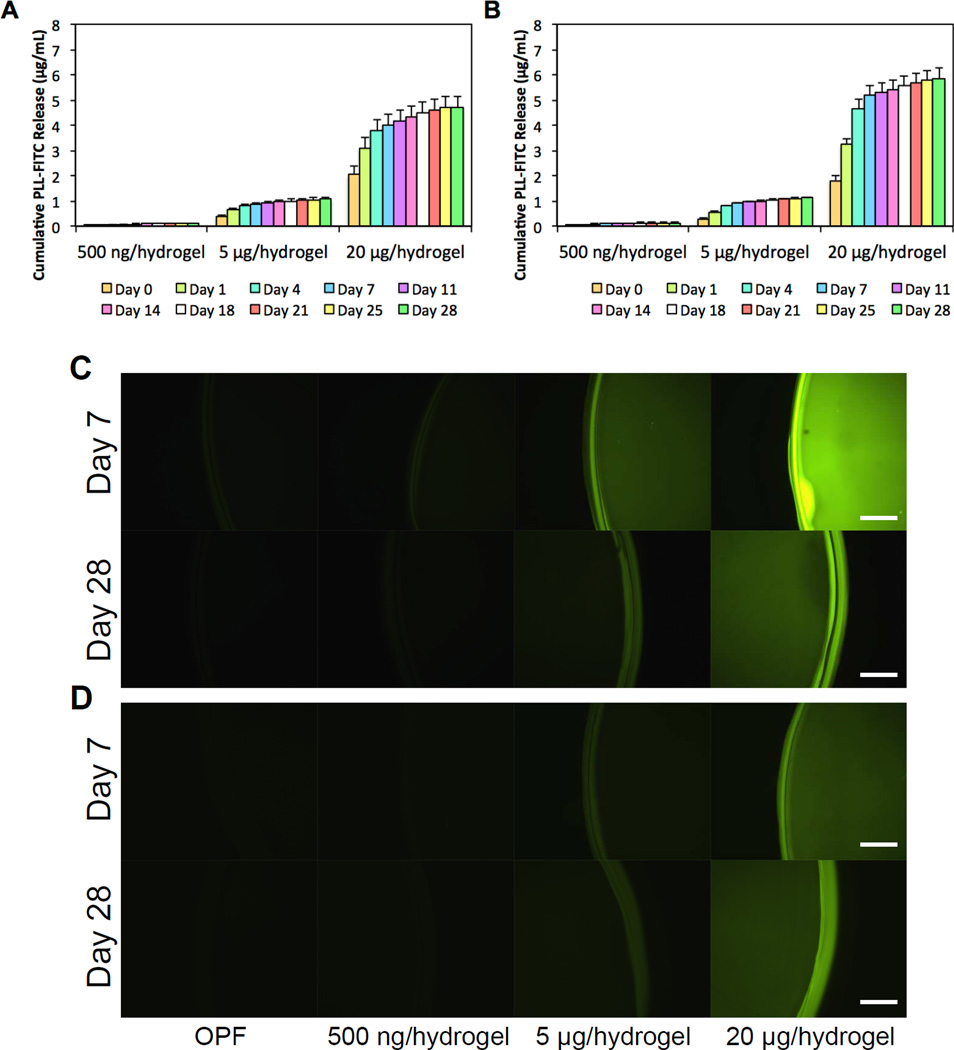
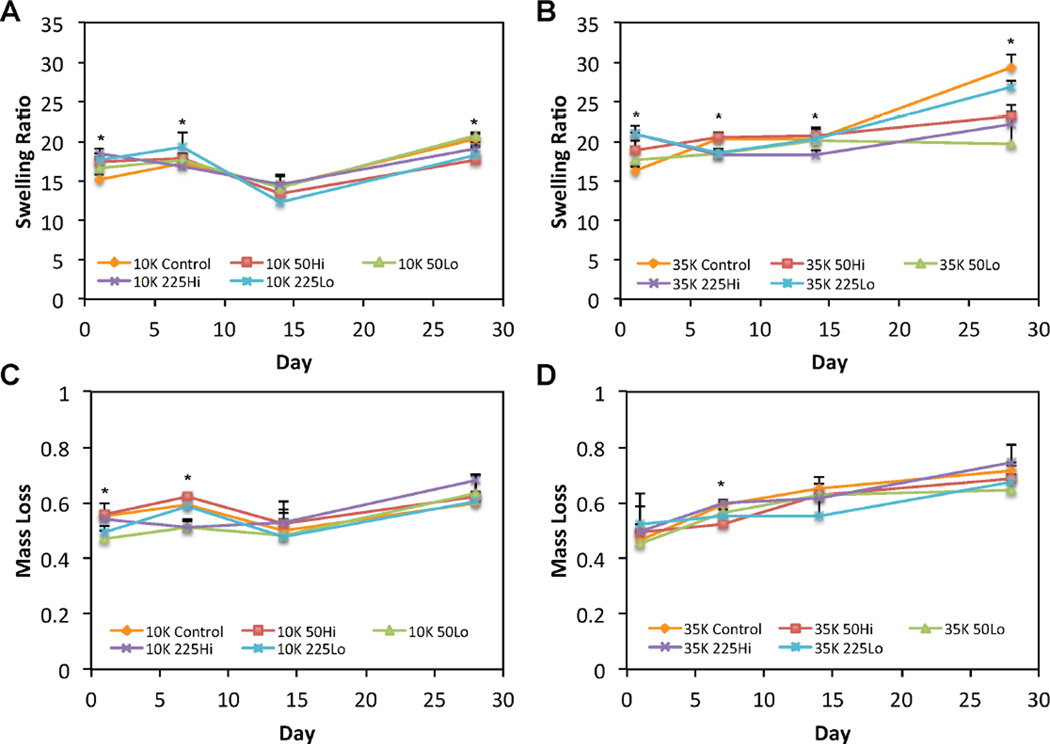
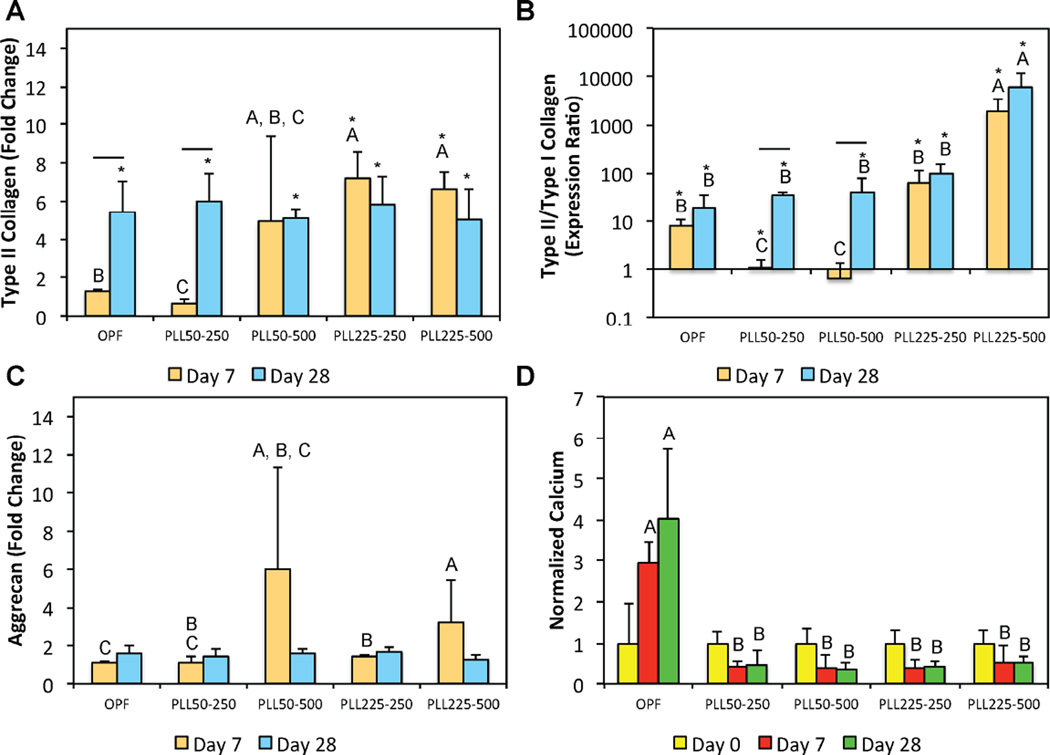
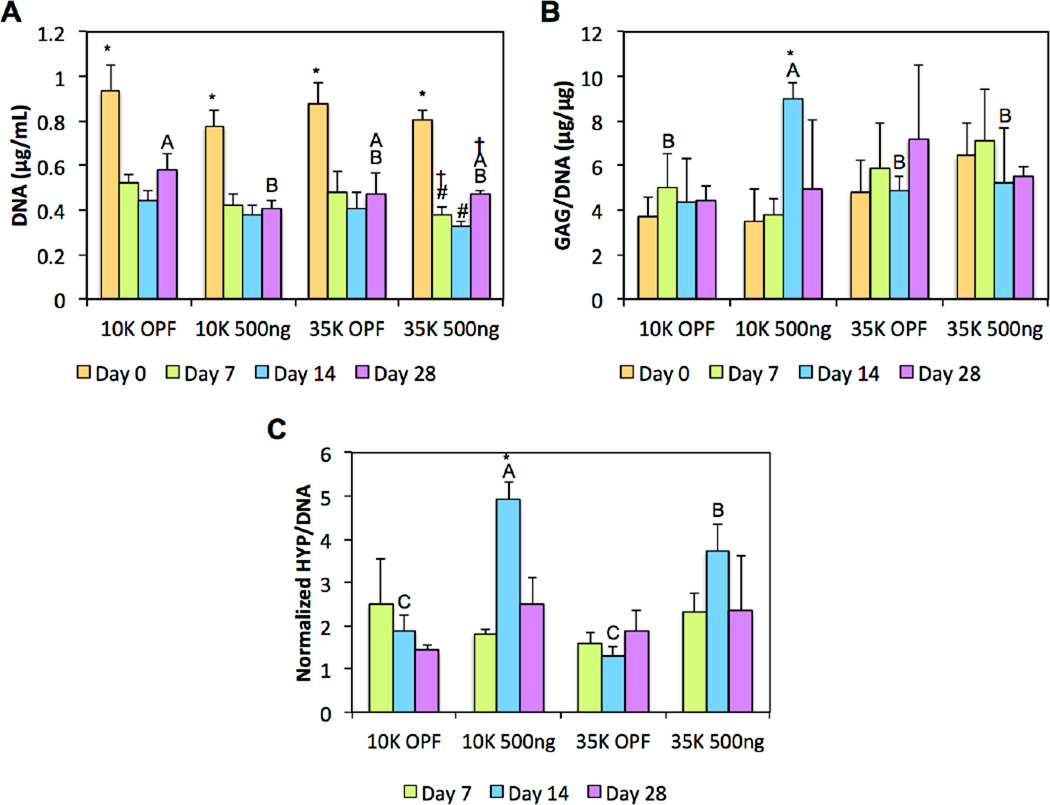
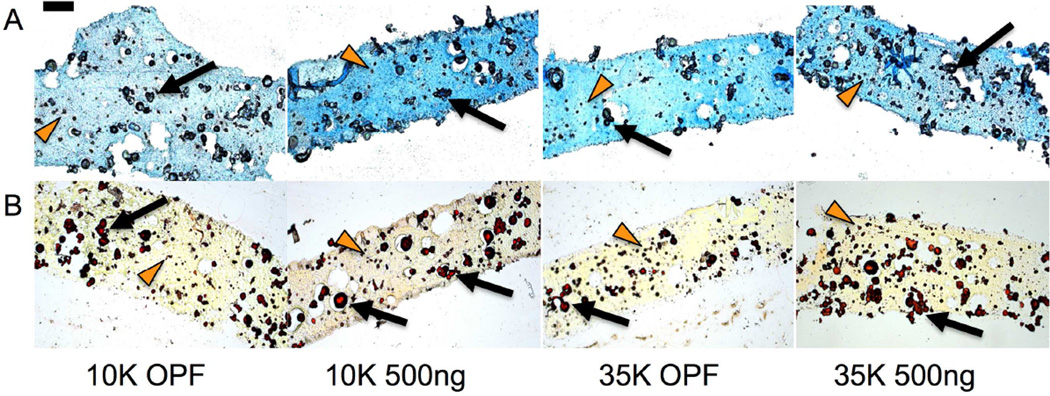
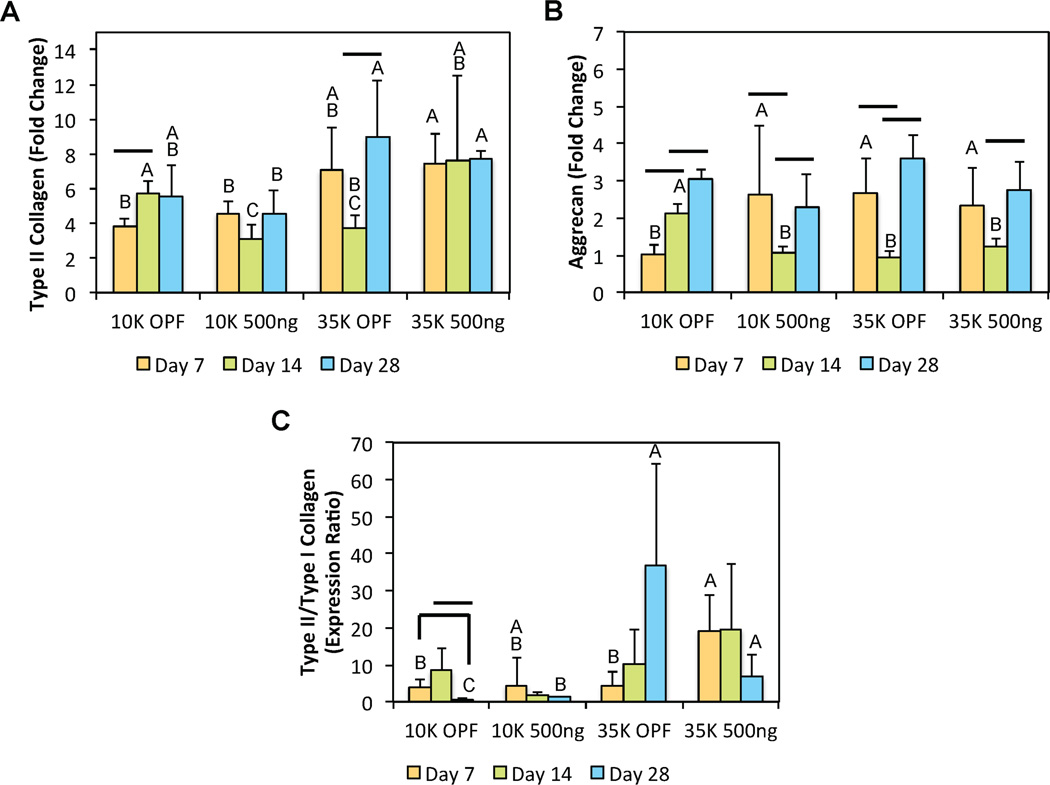
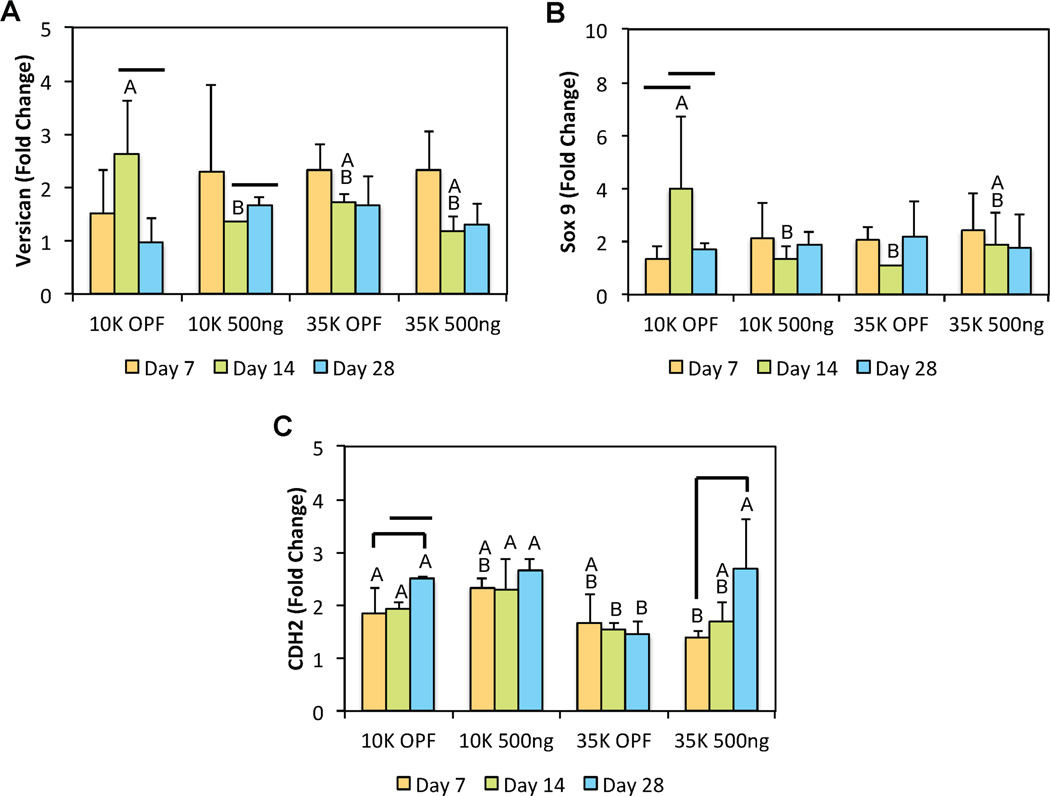
To address the lack of reliable long-term solutions for cartilage injuries, strategies in tissue engineering are beginning to leverage developmental processes to spur tissue regeneration. This study focuses on the use of poly(L-lysine) (PLL), previously shown to up-regulate mesenchymal condensation during developmental skeletogenesis in vitro, as an early chondrogenic stimulant of mesenchymal stem cells (MSCs). We characterized the effect of PLL incorporation on the swelling and degradation of oligo(poly(ethylene) glycol) fumarate) (OPF)-based hydrogels as functions of PLL molecular weight and dosage. Furthermore, we investigated the effect of PLL incorporation on the chondrogenic gene expression of hydrogel-encapsulated MSCs. The incorporation of PLL resulted in early enhancements of type II collagen and aggrecan gene expression and type II/type I collagen expression ratios when compared to blank controls. The presentation of PLL to MSCs encapsulated in OPF hydrogels also enhanced N-cadherin gene expression under certain culture conditions, suggesting that PLL may induce the expression of condensation markers in synthetic hydrogel systems. In summary, PLL can function as an inductive factor that primes the cellular microenvironment for early chondrogenic gene expression but may require additional biochemical factors for the generation of fully functional chondrocytes.

Keywords: Cartilage tissue engineering; Chondrogenic differentiation; Condensation; Hydrogel; Mesenchymal stem cells; Poly(l-lysine).


Figures

Figure 1
Figure 1
An indirect measure of PLL retention through the detection of released PLL is shown in (A) PBS (pH 7.4) or in (B) basic buffer (pH 13) after 24 h between OPF controls, OPF hydrogels loaded with PLL during fabrication (pre), and OPF hydrogels loaded with PLL after fabrication (post). Within each incubation condition, groups not connected by the same letters are significantly different (p < 0.05). Within each group, * indicates a difference between incubation conditions. Released PLL is shown in (C) PBS and in (D) basic buffer over 21 days between OPF-PLL and blank controls. At each time point for (C) and (D), the * indicates a significant difference between groups (p<0.05). Error bars represent the standard deviation (n=3).
Figure 2
Figure 2
Cumulative PLL-FITC release from (A) 10K OPF hydrogels and (B) 35K OPF hydrogels loaded with PLL at 500 ng/hydrogel, 5 µg/hydrogel, or 20 µg/hydrogel over 28 days is shown. Visualization of uniformly distributed PLL-FITC loaded into hydrogel constructs at each concentration, which is shown at days 7 and 28 after incorporation for (C) 10K hydrogels and (D) 35K hydrogels. Scale bar = 200 µm.
Figure 3
Figure 3
Swelling ratio profiles are shown for (A) 10K OPF or (B) 35K OPF hydrogel formulations over 28 days. The mass loss profiles are shown for (C) 10K OPF or (D) 35K OPF hydrogel formulations over 28 days. The * indicates a difference between the 10K OPF or 35K OPF blank control group and at least one of the corresponding PLL-laden groups at that time point. Error bars represent the standard deviation (n=4).
Figure 4
Figure 4
Quantitative gene expression is shown for (A) type II collagen expression, (B) type II/type I collagen expression ratio, and the (C) aggrecan expression at days 7 and 28 for the first cell encapsulation study. The type II/type I collagen expression ratio is shown using a logarithmic scale for the y-axis. (D) The normalized calcium content at various time points. At each individual time point, groups not connected by the same letter are significantly different (p<0.05). Comparing time points within each individual group, time points connected by a bar are significantly different (p<0.05). The * indicates a significant difference when compared to the day 0 value of that corresponding group (p<0.05). Error bars represent the standard deviation (n=4).
Figure 5
Figure 5
(A) DNA content, (B) GAG synthetic activity, and (C) HYP synthetic activity of cell-laden composite hydrogels are shown at various time points. At each individual time point, groups not connected by the same letter are significantly different (p<0.05). Within each group at each individual time point, time points not connected by the same symbol are significantly different (p<0.05). Error bars represent the standard deviation (n=4).
Figure 6
Figure 6
Histological evaluation of GAG production using (A) Alcian Blue, where increasing shades of blue indicate greater sulfated GAG deposition, and collagen production using (B) Picrosirius Red, where increasing shades of red/orange indicate greater collagen deposition, are shown at day 14. GMPs and encapsulated MSCs are indicated with black arrows and orange arrowheads, respectively. Scale bar represents 200 µm for all images.
Figure 7
Figure 7
Quantitative gene expression is shown for (A) type II collagen, (B) aggrecan, and the (C) type II/type I collagen expression ratio at various time points for the second cell encapsulation study. At each individual time point, groups not connected by the same letter are significantly different (p<0.05). Comparing time points within each individual group, time points connected by a bar are significantly different (p<0.05). Error bars represent the standard deviation (n=4).
Figure 8
Figure 8
Quantitative gene expression is shown for (A) Versican, (B) Sox9, and (C) CDH2 at various time points for the second cell encapsulation study. At each individual time point, groups not connected by the same letter are significantly different (p<0.05). Comparing time points within each individual group, time points connected by a bar are significantly different (p<0.05). Error bars represent the standard deviation (n=4).

References

    1. Sophia Fox AJ, Bedi A, Rodeo SA. The basic science of articular cartilage: structure, composition, and function. Sports health. 2009;1:461–468. - PMC - PubMed
    1. Behery O, Siston RA, Harris JD, Flanigan DC. Treatment of cartilage defects of the knee: expanding on the existing algorithm. Clinical journal of sport medicine : official journal of the Canadian Academy of Sport Medicine. 2014;24:21–30. - PubMed
    1. Cross M, Smith E, Hoy D, Carmona L, Wolfe F, Vos T, et al. The global burden of rheumatoid arthritis: estimates from the global burden of disease 2010 study. Annals of the rheumatic diseases. 2014;73:1316–1322. - PubMed
    1. Cross M, Smith E, Hoy D, Nolte S, Ackerman I, Fransen M, et al. The global burden of hip and knee osteoarthritis: estimates from the global burden of disease 2010 study. Annals of the rheumatic diseases. 2014;73:1323–1330. - PubMed
    1. Slaughter BV, Khurshid SS, Fisher OZ, Khademhosseini A, Peppas NA. Hydrogels in Regenerative Medicine. Adv Mater. 2009;21:3307–3329. - PMC - PubMed

Publication types

MeSH terms