. 2016 Jan 22;11(1):e0147067.
doi: 10.1371/journal.pone.0147067. eCollection 2016.

MicroRNA-134 Contributes to Glucose-Induced Endothelial Cell Dysfunction and This Effect Can Be Reversed by Far-Infrared Irradiation

Affiliations

MicroRNA-134 Contributes to Glucose-Induced Endothelial Cell Dysfunction and This Effect Can Be Reversed by Far-Infrared Irradiation

Hsei-Wei Wang et al. PLoS One. .

Abstract

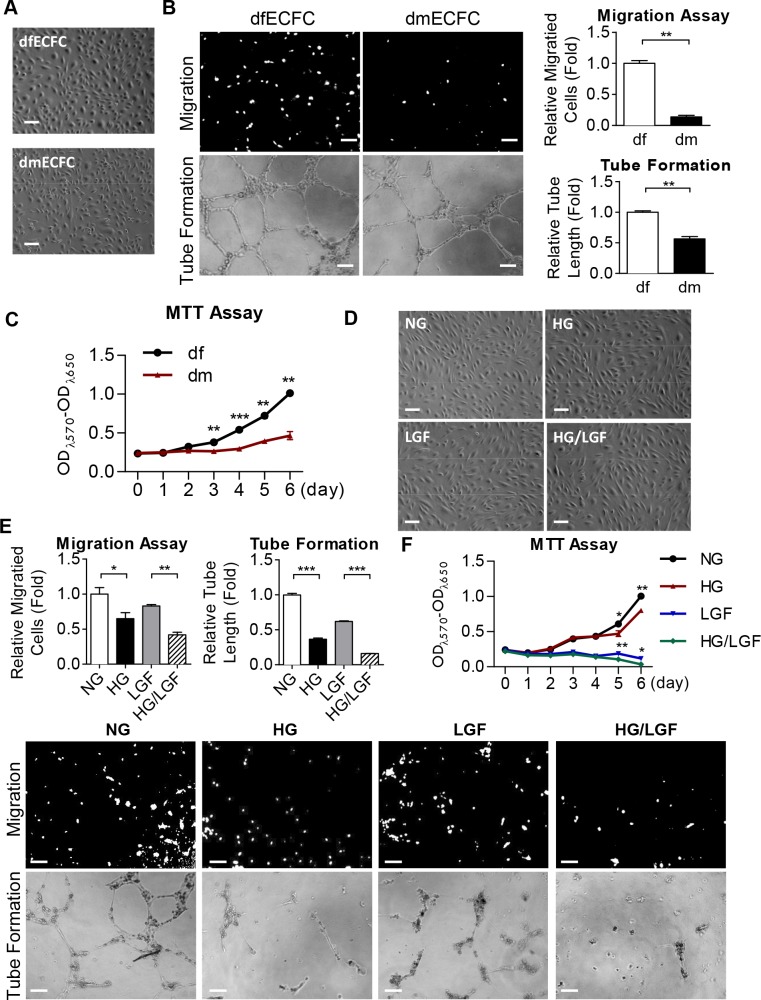
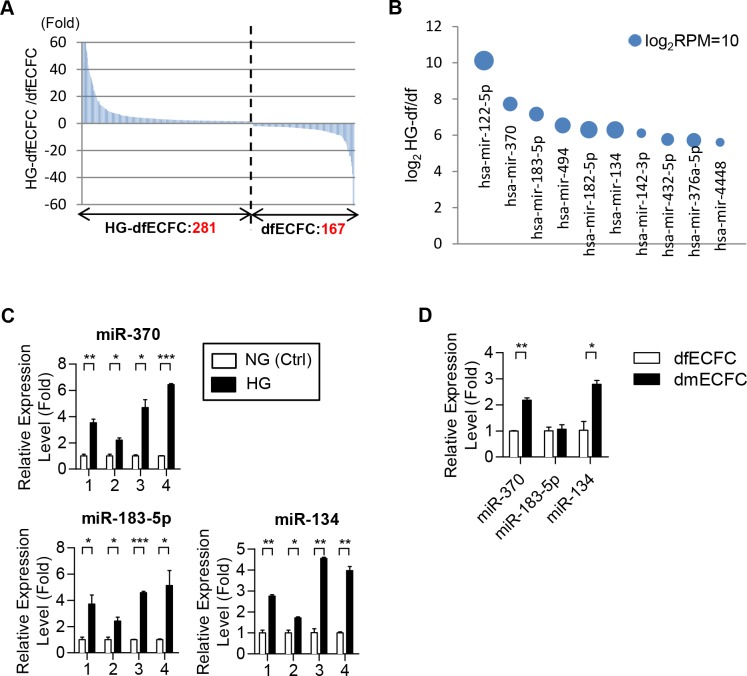
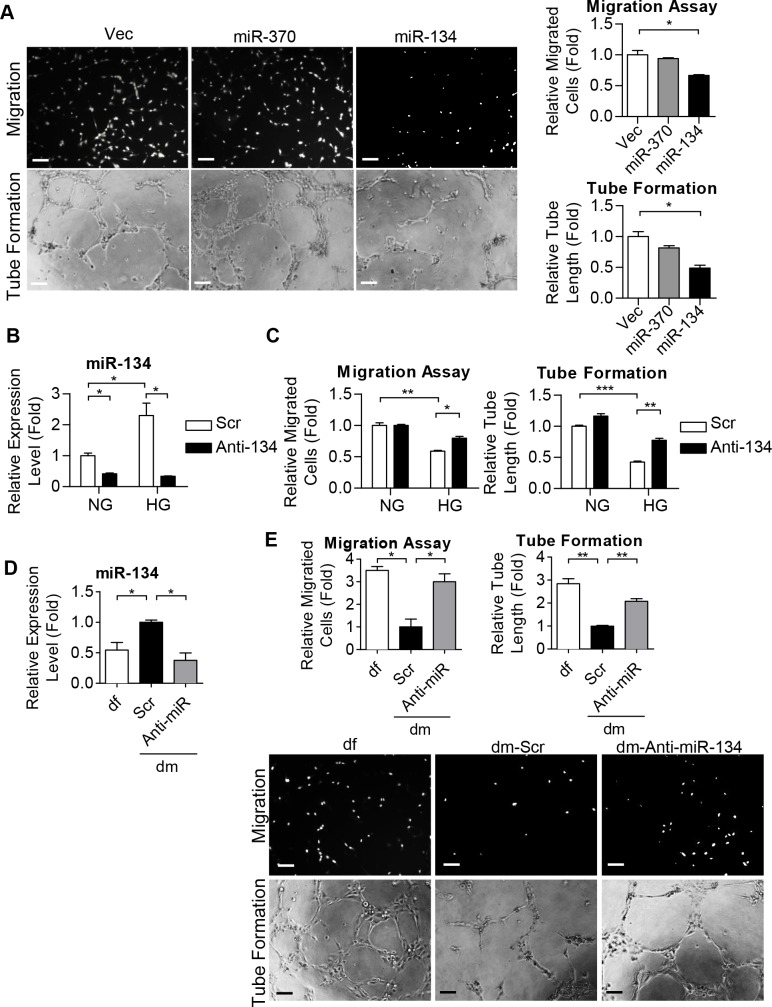
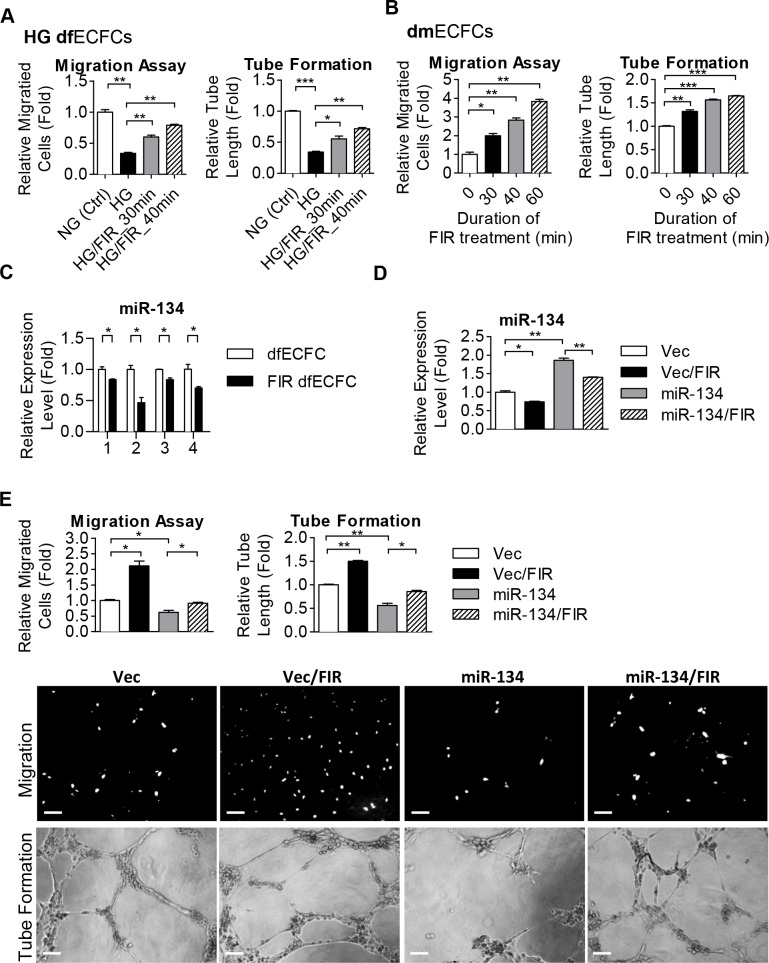
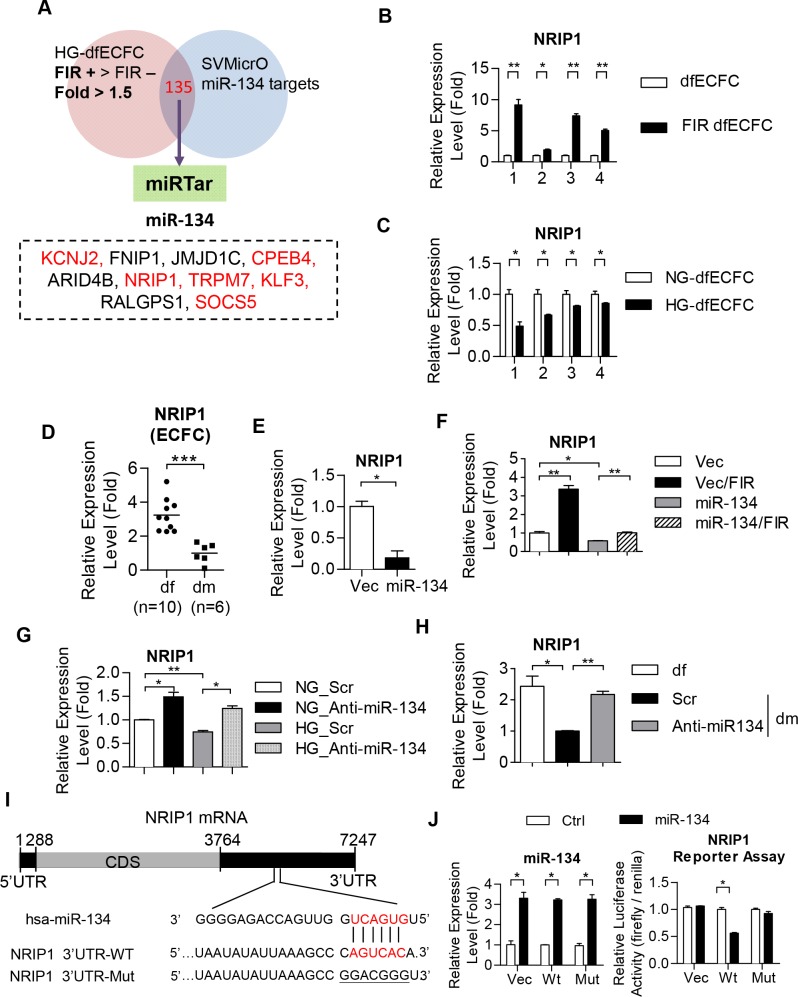
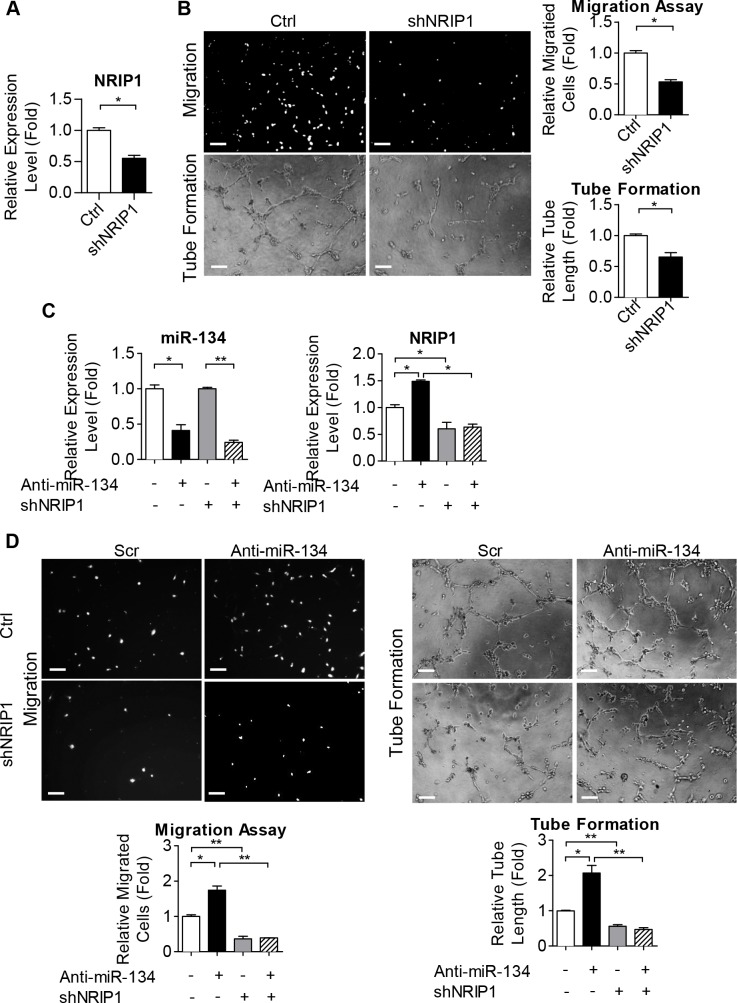
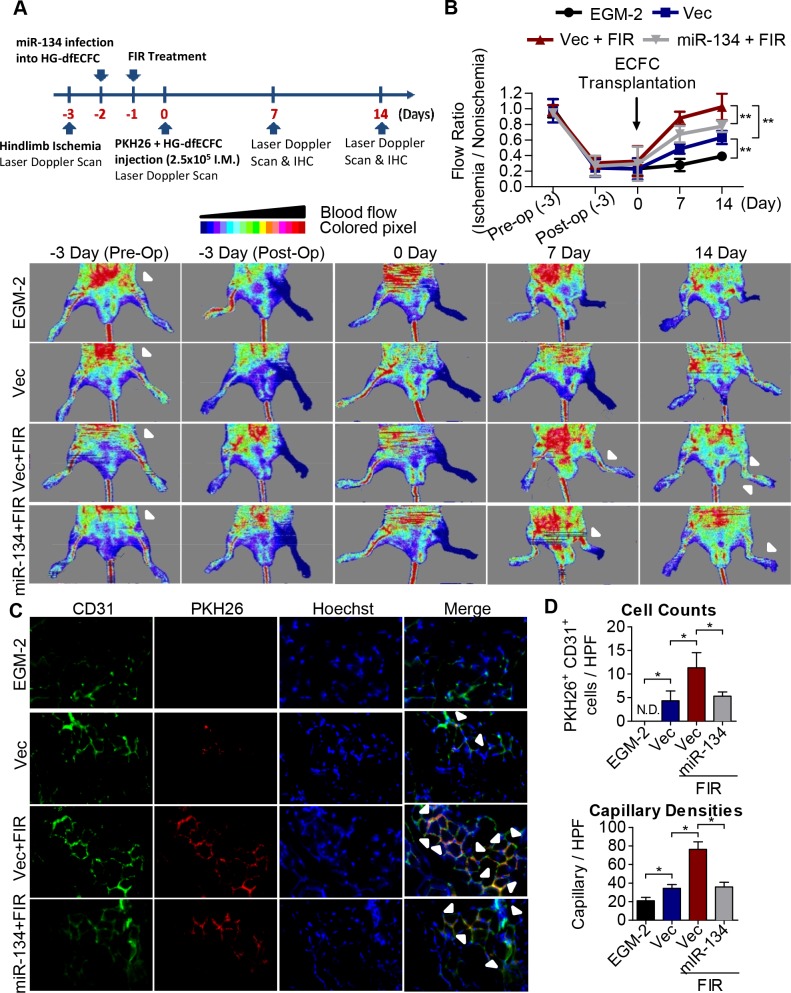
Diabetes mellitus (DM) is a metabolic disease that is increasing worldwide. Furthermore, it is associated with the deregulation of vascular-related functions, which can develop into major complications among DM patients. Endothelial colony forming cells (ECFCs) have the potential to bring about medical repairs because of their post-natal angiogenic activities; however, such activities are impaired by high glucose- (HG) and the DM-associated conditions. Far-infrared radiation (FIR) transfers energy as heat that is perceived by the thermoreceptors in human skin. Several studies have revealed that FIR improves vascular endothelial functioning and boost angiogenesis. FIR has been used as anti-inflammatory therapy and as a clinical treatment for peripheral circulation improvement. In addition to vascular repair, there is increasing evidence to show that FIR can be applied to a variety of diseases, including cardiovascular disorders, hypertension and arthritis. Yet mechanism of action of FIR and the biomarkers that indicate FIR effects remain unclear. MicroRNA-134 (miR-134-5p) was identified by small RNA sequencing as being increased in high glucose (HG) treated dfECFCs (HG-dfECFCs). Highly expressed miR-134 was also validated in dmECFCs by RT-qPCR and it is associated with impaired angiogenic activities of ECFCs. The functioning of ECFCs is improved by FIR treatment and this occurs via a reduction in the level of miR-134 and an increase in the NRIP1 transcript, a direct target of miR-134. Using a mouse ischemic hindlimb model, the recovery of impaired blood flow in the presence of HG-dfECFCs was improved by FIR pretreatment and this enhanced functionality was decreased when there was miR-134 overexpression in the FIR pretreated HG-dfECFCs. In conclusion, our results reveal that the deregulation of miR-134 is involved in angiogenic defects found in DM patients. FIR treatment improves the angiogenic activity of HG-dfECFCs and dmECFCs and FIR has potential as a treatment for DM. Detection of miR-134 expression in FIR-treated ECFCs should help us to explore further the effectiveness of FIR therapy.


Conflict of interest statement

Competing Interests: The authors have declared that no competing interests exist.

Figures

Fig 1
Fig 1. Reduced angiogenic activities in dmECFCs and high glucose treated dfECFCs.
(A) The cell morphology of ECFCs from disease-free (df) and diabetes mellitus (dm) individuals Scale bar: 50 μm. (B) Representative images (left) and quantitative data (right) for the Transwell cellular migration assay (upper) and microvascular formation assay (lower) using dfECFCs and dmECFCs. n = 3 independent experiments. ** p < 0.01 by Mann-Whitney U test. Scale bar: 50 μm (C) Cell proliferation rates of dfECFCs and dmECFCs measured using the MTT assay. ** p < 0.01, *** p < 0.001 by Mann-Whitney U test. n = 3 independent experiments. (D) Cell morphology of dfECFCs treated with normal culture (NG), high glucose (HG), low growth factor (LGF) and HG/LGF. Scale bar: 50 μm (E) Representative images (lower) and quantitative data (upper) of Transwell migration assay and microvascular formation assay using dfECFCs under NG, HG, LGF, and HG/LGF conditions. n = 3 independent experiments. * p < 0.05, ** p < 0.01, *** p < 0.001 by one-way ANOVA followed Tukey’s post-hoc test. (F) Cell proliferation rate of dfECFCs under NG, HG, LGF, HG/LGF treatment measured using the MTT assay. n = 3 independent experiments. * p < 0.05, ** p < 0.01, by by one-way ANOVA followed by Tukey’s post-hoc test.
Fig 2
Fig 2. Small RNA sequencing and RT-qPCR reveal high level of expression of miR-134 in HG-dfECFCs and dmECFCs.
(A) Differentially expressed miRNAs between HG-dfECFCs and dfECFCs. Numbers of dominant miRNAs in each ECFC type (fold change > 2) are shown. Y-axis was shown the fold ratio of RPM of HG-dfECFCs against dfECFCs. (B) The top ten HG-enriched miRNAs are shown. Y-axis was indicated the log2 ratio of HG-dfECFC against dfECFCs. The diameters of the circles indicate the log2RPM of the HG-dfECFCs. (C) The putative HG-induced miRNAs were validated using dfECFCs treated with NG and HG by RT-qPCR. * p < 0.05, ** p < 0.01, *** p < 0.001 by one-way ANOVA followed by Tukey’s post-hoc test. (D) The HG-induced miRNAs were also analyzed in dmECFCs and dfECFCs by RT-qPCR. * p < 0.05, ** p < 0.01 by one-way ANOVA followed by Tukey’s post-hoc test.
Fig 3
Fig 3. miR-134 regulates ECFC motility and microvasculature formation ability.
(A) Representative images (left) and quantitative data (right) from the Transwell migration assays (upper) and tube formation assays (lower) of dfECFCs with miR-370 and miR-134 overexpression. n = 3 independent experiments. * p < 0.05 by one-way ANOVA followed by Tukey’s post-hoc test. Scale bar: 50 μm (B) The expression levels of miR-134 under osmotic culture condition (NG) or under high glucose condition (HG) treated with scramble control and miR-134 antagomir (Anti-134) in dfECFCs as quantified by RT-qPCR. * p < 0.05 by one-way ANOVA followed by Tukey’s post-hoc test n = 3 independent experiments. (C) Cellular migration assays (left) and tube formation assays (right) of NG-dfECFCs and HG-dfECFCs after scramble control and miR-134 antagomir (Anti-134) treatment. n = 3 independent experiments. * p < 0.05, ** p < 0.01, *** p < 0.001 by one-way ANOVA followed by Tukey’s post-hoc test. (D) Expression levels of miR-134 in dfECFCs or antagomir treated dmECFCs using RT-qPCR. n = 3 independent experiments. * p < 0.05 by one-way ANOVA followed by Tukey’s post-hoc test. (E) Representative images (lower) and quantitative data (upper) from the Transwell migration assays and tube formation assays of dfECFCs and antagomir treated dmECFCs. n = 3 independent experiments. * p < 0.05, ** p < 0.01 by one-way ANOVA followed by Tukey’s post-hoc test. Scale bar: 50 μm. Vec, plasmid control; Scr, scramble; Anti-134, miR-134 antagomir.
Fig 4
Fig 4. FIR treatment improves angiogenic activities of ECFCs.
(A) Quantitative data from the Transwell cell migration assays (left) and tube formation assays (right) using HG-dfECFCs with or without FIR treatment. n = 3 independent experiments. * p < 0.05, ** p < 0.01, *** p < 0.001 by one-way ANOVA followed by Tukey’s post-hoc test. (B) Quantitative data from the Transwell cell migration assays (left) and tube assays (right) using dmECFCs treated with FIR. n = 3 independent experiments. * p < 0.05, ** p < 0.01, *** p < 0.001 by one-way ANOVA followed by Tukey’s post-hoc test. (C) The expression levels of miR-134 in dfECFCs from four individuals with or without FIR treatment. * p < 0.05 by one-way ANOVA followed by Tukey’s post-hoc test. (D) miR-134 expression in vector control and miR-134 overexpressed dfECFC with or without FIR treatment. * p < 0.05, ** p < 0.01, by one-way ANOVA followed by Tukey’s post-hoc test. (E) Representative images (lower) and quantitative data (upper) from the Transwell cell migration assays and microvascular formation assays using vector control or miR-134 overexpressed dfECFCs with or without FIR treatment. n = 3 independent experiments. * p < 0.05, ** p < 0.01 by one-way ANOVA followed Tukey’s post-hoc test. Scale bar: 50 μm.
Fig 5
Fig 5. NRIP1 is a direct target of miR-134.
(A) A Venn diagram shows the principle used to filter the target genes of miR-134. (B, C) Validation of putative miR-134 downstream targets in dfECFCs under FIR (B) and high glucose (C) treatment using RT-qPCR. * p < 0.05, ** p < 0.01 by one-way ANOVA followed by Tukey’s post-hoc test. (D) Relative expression level of NRIP1 in dfECFCs and dmECFCs. *** p < 0.001 by Mann-Whitney U test (E, F) Validation of NRIP1 expression in miR-134 overexpressed dfECFCs (E) and in combination with FIR treatment (F). n = 3 independent experiments. * p < 0.05 (E) by Mann-Whitney U test, * p < 0.05, ** p < 0.01 (F) by one-way ANOVA followed by Tukey’s post-hoc test. (G, H) The expression levels of NRIP1 in HG-dfECFCs or dmECFCs treated with scramble control or miR-134 antagomir. n = 3 independent experiments. * p < 0.05, ** p < 0.01 one-way ANOVA followed by Tukey’s post-hoc test. (I) Structure of the NRIP1 transcript and the predicted miR-134 binding site on the NRIP1-3’UTR. (J) The relative luciferase activities of the vector control or miR-134 overexpressed 293T cells co-transfected with the wild type or mutant NRIP1 3’UTR reporter plasmids (right panels). Luciferase activity was normalized against the vector control group and are presented as the mean + SD. The expression levels of each miRNAs as detected by RT-qPCR (left panels). n = 3 independent experiments. * p < 0.05 by one-way ANOVA followed by Tukey’s post-hoc test. Scr, scramble control; Vec, plasmid control; Wt, wild type 3’UTR of NRIP1; Mut, mutated 3’UTR of NRIP1.
Fig 6
Fig 6. NRIP1 is involved in ECFC activity and is crucial for miR-134 functionality.
(A) Validation of NRIP1 in dfECFCs infected with NRIP1 shRNA. * p < 0.05 by Mann-Whitney U test. (B) Representative images (left) and quantitative data (right) from the Transwell migration assays (upper) and microvascular formation assays (lower) using ECFCs infected with control or NRIP1 shRNA plasmids. n = 3 independent experiments. * p < 0.05 by Mann-Whitney U test. Scale bar: 50 μm. (C) The expression levels of miR-134 and NRIP1 in dfECFCs treated with miR-134 antagomir and NRIP1 shRNA as a double manipulation. n = 3 independent experiments. * p < 0.05, ** p < 0.01 by one-way ANOVA followed by Tukey’s post-hoc test. (D) Representative images (upper) and quantitative data (lower) of the Transwell cell migration assays (left) and tube formation assays (right) using dfECFCs with miR-134 antagomir and NRIP1 shRNA as a double manipulation. n = 3 independent experiments. * p < 0.05, ** p < 0.01 by one-way ANOVA followed by Tukey’s post-hoc test. Scale bar: 50 μm. Ctrl: plasmid control, shNRIP1: NRIP1 shRNA, Anti-miR-134: miR-134 antagomir.
Fig 7
Fig 7. FIR induces ECFC activation and improves blood perfusion using an ischemic hindlimb model.
(A) Schematic representation of experimental design. (B) Upper: quantitative analysis of blood flow expressed as perfusion ratio of the ischemic to the non-operated contralateral hindlimb. n = 6, ** p < 0.01 by one-way ANOVA followed by Tukey’s post-hoc test. Lower: representative images of mouse ventral side during the measurement of hindlimb blood flow by laser Doppler before operation (Pre-Op), immediately after hindlimb ischemia surgery (Post-Op), and 2 weeks after intramuscular injection of culture medium (EGM2), HG-dfECFCs (Vec), HG-dfECFCs with FIR treatment (Vec + FIR), and miR-134 overexpressed HG-dfECFCs with FIR treatment (miR-134 + FIR). (C) Immunofluorescence staining of the tissue from nude mice 7 days after injection with PKH-26-labeled HG-dfECFCs. The capillaries in the limb muscles were visualized by anti-CD31 immunostaining (green), and injected human ECFCs were monitored by PKH-26 fluorescence (red). In addition there was Hoechst nuclear staining of the live cells (blue). (D) Quantitative analysis of CD31+/PKH-26+ double-positive cells and capillary densities in limb muscle of mice hindlimb ischemia region. HPF: high power field; N.D.: not detectable; * p < 0.05 by one-way ANOVA followed by Tukey’s post-hoc test.

References

    1. Wild S, Roglic G, Green A, Sicree R, King H. Global prevalence of diabetes: estimates for the year 2000 and projections for 2030. Diabetes care. 2004;27(5):1047–53. - PubMed
    1. Martin A, Komada MR, Sane DC. Abnormal angiogenesis in diabetes mellitus. Medicinal research reviews. 2003;23(2):117–45. - PubMed
    1. Hur J, Yoon CH, Kim HS, Choi JH, Kang HJ, Hwang KK, et al. Characterization of two types of endothelial progenitor cells and their different contributions to neovasculogenesis. Arteriosclerosis, thrombosis, and vascular biology. 2004;24(2):288–93. - PubMed
    1. Ingram DA, Mead LE, Tanaka H, Meade V, Fenoglio A, Mortell K, et al. Identification of a novel hierarchy of endothelial progenitor cells using human peripheral and umbilical cord blood. Blood. 2004;104(9):2752–60. - PubMed
    1. Mukai N, Akahori T, Komaki M, Li Q, Kanayasu-Toyoda T, Ishii-Watabe A, et al. A comparison of the tube forming potentials of early and late endothelial progenitor cells. Experimental cell research. 2008;314(3):430–40. - PubMed

Publication types

LinkOut - more resources