. 2016 Apr;84(4):435-47.
doi: 10.1002/prot.24989. Epub 2016 Feb 13.

The role of negative selection in protein evolution revealed through the energetics of the native state ensemble

Affiliations

The role of negative selection in protein evolution revealed through the energetics of the native state ensemble

Jordan Hoffmann et al. Proteins. 2016 Apr.

Erratum in

Abstract

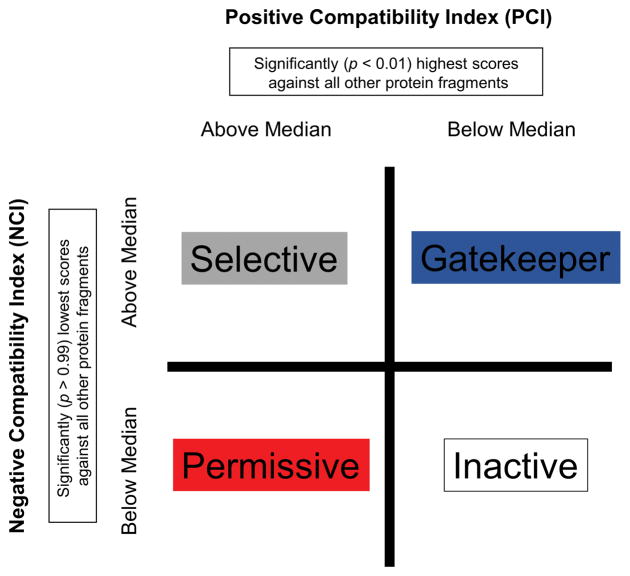
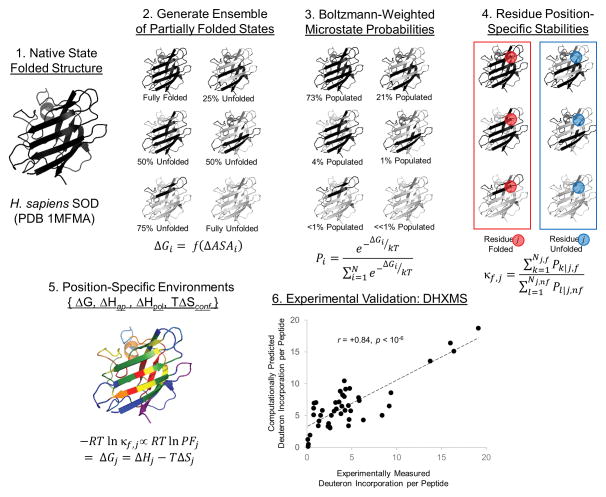
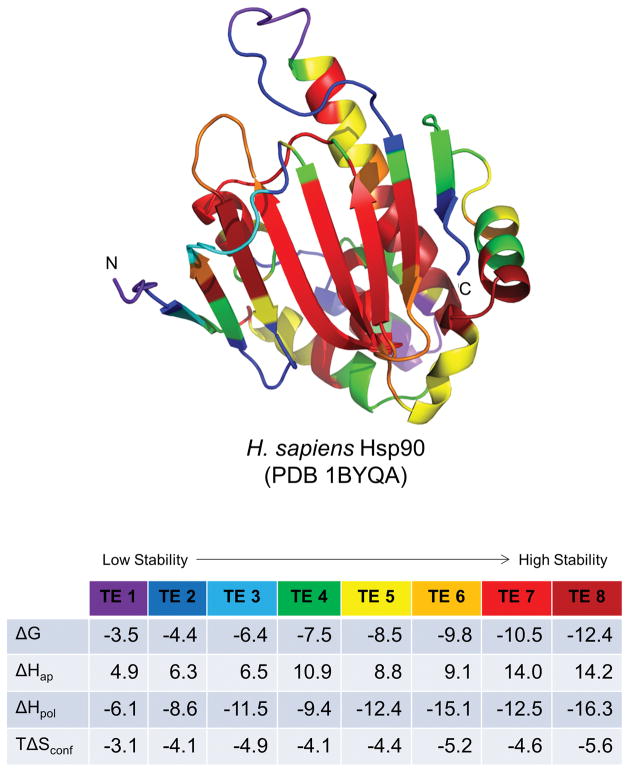
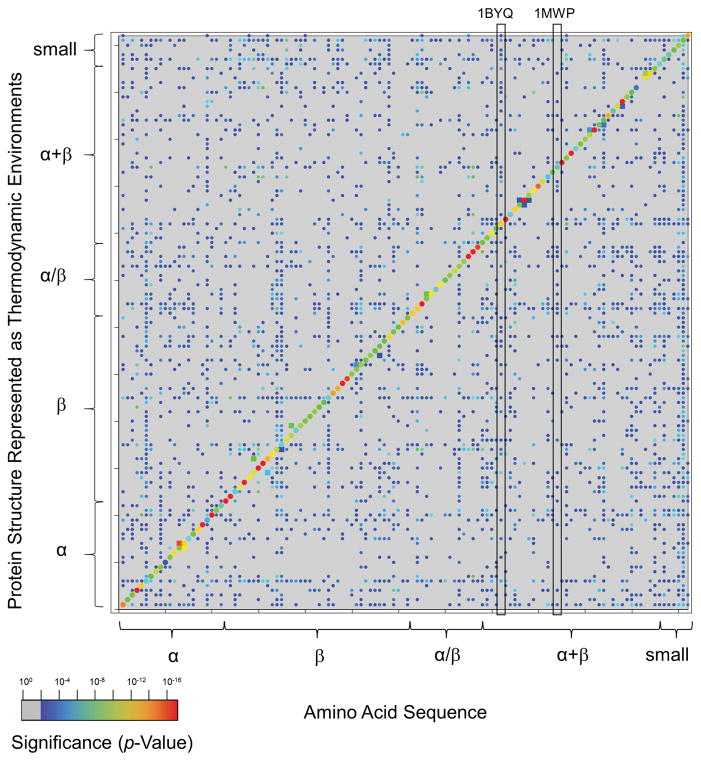
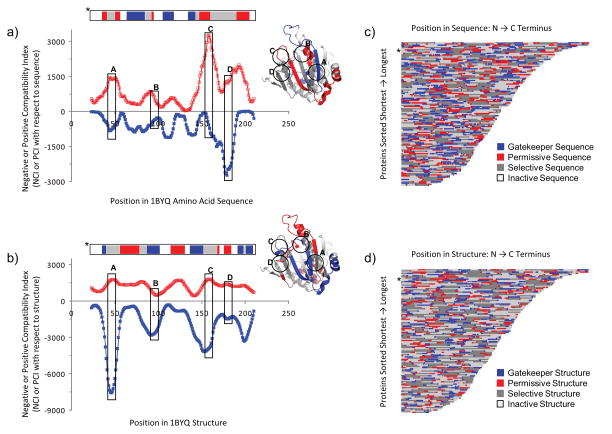
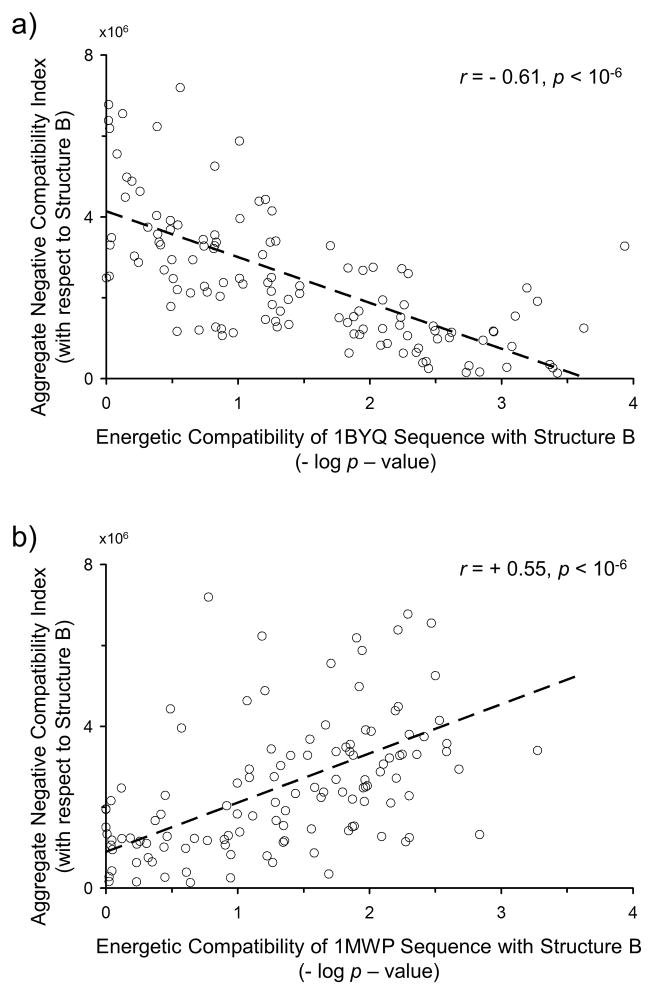
Knowing the determinants of conformational specificity is essential for understanding protein structure, stability, and fold evolution. To address this issue, a novel statistical measure of energetic compatibility between sequence and structure was developed using an experimentally validated model of the energetics of the native state ensemble. This approach successfully matched sequences from a diverse subset of the human proteome to their respective folds. Unexpectedly, significant energetic compatibility between ostensibly unrelated sequences and structures was also observed. Interrogation of these matches revealed a general framework for understanding the origins of conformational specificity within a proteome: specificity is a complex function of both the ability of a sequence to adopt folds other than the native, and ability of a fold to accommodate sequences other than the native. The regional variation in energetic compatibility indicates that the compatibility is dominated by incompatibility of sequence for alternative fold segments, suggesting that evolution of protein sequences has involved substantial negative selection, with certain segments serving as "gatekeepers" that presumably prevent alternative structures. Beyond these global trends, a size dependence exists in the degree to which the energetic compatibility is determined from negative selection, with smaller proteins displaying more negative selection. This partially explains how short sequences can adopt unique folds, despite the higher probability in shorter proteins for small numbers of mutations to increase compatibility with other folds. In providing evolutionary ground rules for the thermodynamic relationship between sequence and fold, this framework imparts valuable insight for rational design of unique folds or fold switches.

Keywords: fold recognition; gapless threading; metamorphic proteins; rational design; thermodynamic environments.


Figures

Figure 1
Figure 1. Log-odds compatibility scores relating amino acids to native state ensemble-based thermodynamic environments
These scores were computed as previously described [–31] using the amino acids and thermodynamic environments data given in Table S2. A positive value indicates that the amino acid is found more often than expected in a particular thermodynamic environment within globular proteins, while a negative value indicates occurrence less often than expected. Colors are identical to those used in Figures 4 and 5, i.e. violet, blue, green are lower predicted stability and yellow, orange red are higher stability.
Figure 2
Figure 2. Principal components analysis of positive and negative energetic compatibilities demonstrates the dominance of incompatibility in a representative sample of globular proteins
Values in the last four columns of Table S2 were subjected to standard eigenvalue decomposition. [37] The vast majority of the information content of the four-dimensional data can be described by the first two principal components, dominated by energetically incompatible sequence and structure indices, respectively, interpreted as effects of negative selection in the organization of protein fold space. Red circles indicate the indices contributing the most to the information content.
Figure 3
Figure 3. Provisional classification scheme for energetic compatibility indices within proteins
The scheme is a simple contingency table wherein categories are defined based on the median Positive Compatibility Index (PCI) and median Negative Compatibility Index (NCI) for an individual protein. Attributes for the category labels are described in Methods, and the colors correspond to those in Figure 6.
Figure 4
Figure 4. Conceptual basis for native state ensemble-based thermodynamic environments
The human superoxide dismutase (SOD) protein (Step 1) is used as an example for the COREX/BEST algorithm, briefly explained in the main text. An experimentally validated positional thermodynamic stability ΔGj measured at a residue position j in the protein (Steps 4 and 6), is obtained from the Boltzmann-weighted ensemble of partially folded microstates (Steps 2 and 3). Clustering of a large number of positional stabilities from diverse proteins, with respect to the relative contributions of enthalpy and entropy to those stabilities, results in eight colored “thermodynamic environments”. These colors correspond to the average Gibbs free energy of the position: purple/blue colors are less stable and orange/red colors are more stable (as displayed in Figure 5). Black regions of the molecular cartoon represent folded, native-like conformations in a greatly simplified COREX ensemble, and gray represents regions of unfolded conformations. Experimental data was obtained from Liu, et al. [28]. Abbreviations: ASA = solvent accessible surface area, ap = apolar surface area, pol = polar surface area, conf = conformational, PF = hydrogen exchange protection factor, DHXMS = deuterium – hydrogen exchange mass spectrometry. The thermodynamic environments for this protein are listed in Table S2.
Figure 5
Figure 5. Representation of protein structure in terms of native state ensemble-based thermodynamic environments
Example protein Hsp90 1BYQ from the thermodynamic environments database (top). Residue cartoon color coding corresponds to the average thermodynamic quantities in the environments table (bottom). Values in the table are in units of kcal/mol under simulated folding conditions: 25 °C, pH = 7.0. Rainbow coloring follows the order of average thermodynamic stability: purple, blue, green exhibit lowest stability (least negative ΔG), yellow, orange, red exhibit highest stability (most negative ΔG). The beta-strand core of this protein contains most (but not all) of the highest stability regions, while some (but not all) of the loops and turns are lower in stability.
Figure 6
Figure 6. Parameterized random model recapitulates expected sequence-structure conformational specificity as statistically significant
122 H. sapiens proteins are listed on each axis in the order given in Table S1. SCOP secondary structure classes [32] of each protein are indicated by braces. Dots represent significance levels of either sequence-environment or environment-sequence energetic compatibilities of full length proteins of p < 0.01. Rainbow coloring indicates the statistical significance of the energetic scores, with dark blue corresponding to p ~ 0.01 and red corresponding to p ~ 10−15. The most significant scores are located along the diagonal, corresponding to sequences that are conformationally specific for known structures. Homologous proteins, displayed as squares, also display significant sequence-environment scores. Gray areas, largely off-diagonal, indicate insignificant scores of p > 0.01. Unexpectedly, approximately one-half of the off-diagonal points are significant to at least p = 0.01. The column locations of two proteins discussed in the text, 1BYQ and 1MWP, are indicated by vertical boxes: the values within these column vectors are plotted as the x-axes in Figs. 8a and 8b.
Figure 7
Figure 7. Energetic scoring varies with sequence and structure position, as energetically “compatible” and “incompatible” regions ubiquitous within the proteome
The y-axes in panels a) and b) indicate the number of times any 13-residue fragment from any other protein was significantly compatible with the 1BYQ protein at the residue positions located on the x-axes. Panel a) displays compatible structure fragments with 1BYQ sequence, and panel b) displays compatible sequence fragments with 1BYQ structure. “Significantly” was defined as exhibiting an energetic compatibility of at least p < 0.01 (red open squares) or p > 0.99 (blue filled squares). For most proteins analyzed, the density of incompatible matches dominated the most compatible matches, suggesting the importance of energetic incompatibility in conformational specificity. Horizontal colored bar above the chart indicates regions of compatibility defined in the text and in Figure 3: “gatekeeper” (blue), “permissive” (red), “selective” (gray), and “inactive” (white); these regions are colored on the molecular cartoon. Labeled vertical boxes A – D denote regions of interest discussed in the text. Panels c) and d) summarize the energetic compatibilities of a representative subset of 122 human proteome amino acid sequences and structures, respectively. Colors are identical to those in panels a) and b) and the locations of the data for the protein displayed in panels a) and b) are indicated by asterisks in panels c) and d), respectively. Panels c) and d) indicate that, for both sequence and structure, total amounts of gatekeeper and permissive regions are less than amounts of inactive and selective regions. Within the sequence and structure of any particular protein, gatekeeper and permissive regions, thought to be important for conformational specificity, are located at different positions.
Figure 8
Figure 8. Aggregate negative energetic compatibility of a structure correlates with energetic compatibility of a sequence for that structure
Two protein sequences, 1BYQ (Fig. 8a) and 1MWP (Fig. 8b), are compared with each of 122 structures, the latter represented as native state ensemble-based thermodynamic environments. The p-value of the optimal gapless match, computed by the random model described in Fig. S1, is displayed as a log value on the x-axis, negated so that increased energetic compatibility between sequence and structure is represented by a more positive value. The y-axis represents the aggregate negative compatibility of a second protein, examples of which are displayed by the blue curves in Fig. 7. For many proteins studied, modest but significant correlations are observed (Pearson correlation coefficient r shown [37]). Across the entire database of studied proteins, these correlations trend with length: length inversely varies with correlation coefficient: longer proteins such as 1BYQ exhibit negative correlations (Fig. 8a) while shorter proteins such as 1MWP exhibit positive correlations (Fig. 8b). This trend, displayed in Fig. 9, is interpreted as increased importance of negative selection in the conformational specificity of smaller, single-domain proteins.
Figure 9
Figure 9. Relationship between energetic compatibility and negative compatibility depends on protein size
Small, single domain proteins exhibit a positive Pearson correlation [37] between negative energetic compatibility and energetic compatibility of sequence with structure. This relationship is interpreted as evidence of the effect of negative selection on conformational specificity. Examples of such correlations are shown in Fig. 8. Open circles indicate aggregate negative compatibility index with respect to structure (as displayed in Fig. 7b), and filled circles indicate aggregate negative compatibility index with respect to amino acid sequence (as displayed in Fig. 7a). The solid dark curve is to guide the eye, a window size 11 moving average over all the data. Energetic compatibilities are expressed as negative log p-value, as shown on the x-axes of Fig. 8. The correlation coefficients for proteins 1BYQ and 1MWP shown in Fig. 8 are labeled for reference.

References

    1. Kabsch W, Sander C. On the use of sequence homologies to predict protein structure: identical pentapeptides can have completely different conformations. Proceedings of the National Academy of Sciences of the United States of America. 1984;81:1075–1078. - PMC - PubMed
    1. Sudarsanam S. Structural diversity of sequentially identical subsequences of proteins: identical octapeptides can have different conformations. Proteins: Structure, Function, and Genetics. 1998;30:228–231. - PubMed
    1. Guo JT, Jaromczyk JW, Xu Y. Analysis of chameleon sequences and their implications in biological processes. Proteins: Structure, Function, and Bioinformatics. 2007;67:548–558. - PubMed
    1. Li W, et al. ChSeq: A database of chameleon sequences. Protein Science. 2015;24(7):1075–1086. - PMC - PubMed
    1. Murzin AG. Metamorphic proteins. Science. 2008;320:1725–1726. - PubMed

Publication types

LinkOut - more resources