. 2016 Aug;10(8):1998-2009.
doi: 10.1038/ismej.2015.253. Epub 2016 Jan 22.

Assembly of the Caenorhabditis elegans gut microbiota from diverse soil microbial environments

Affiliations

Assembly of the Caenorhabditis elegans gut microbiota from diverse soil microbial environments

Maureen Berg et al. ISME J. 2016 Aug.

Abstract

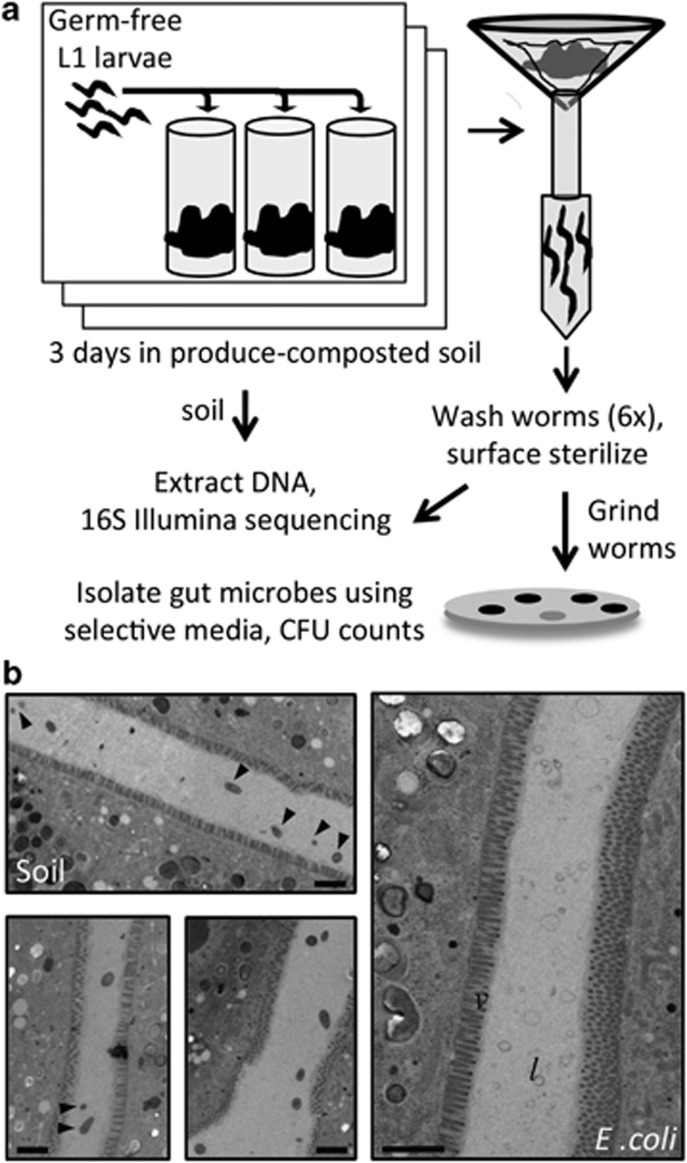
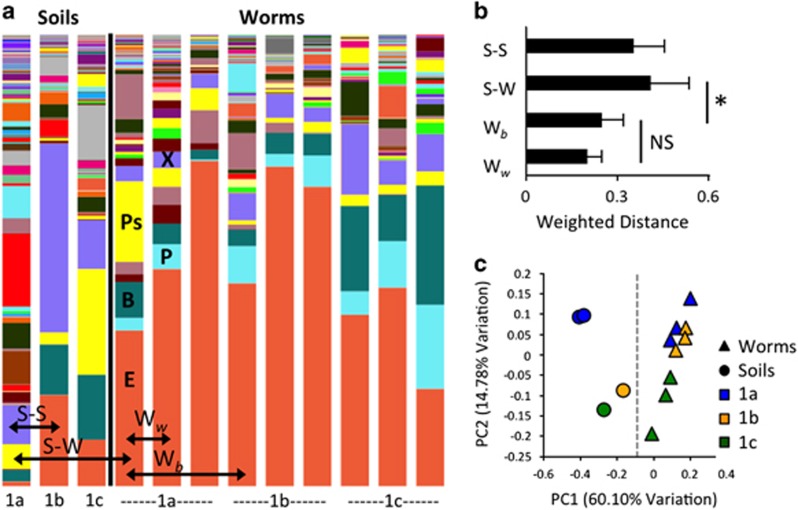
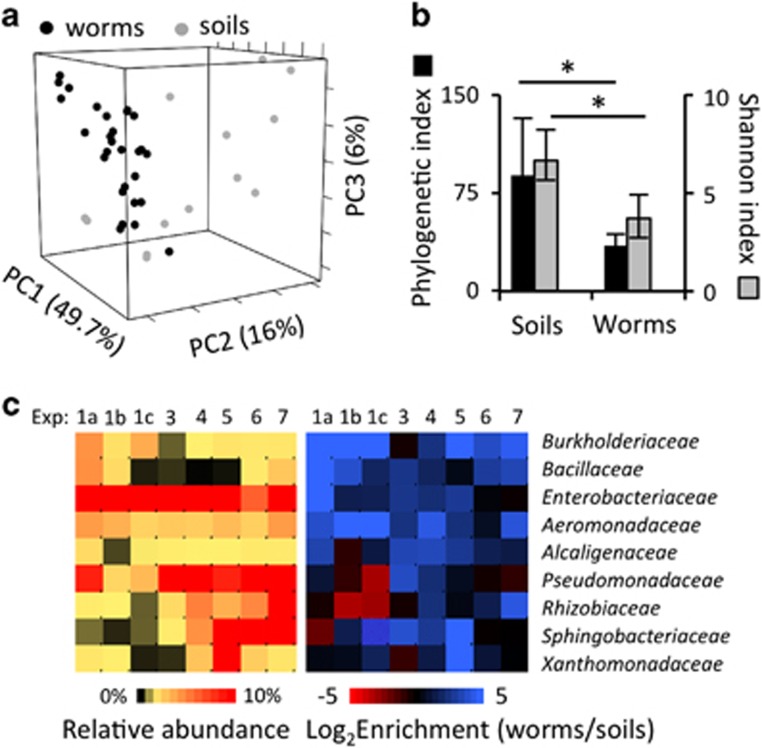
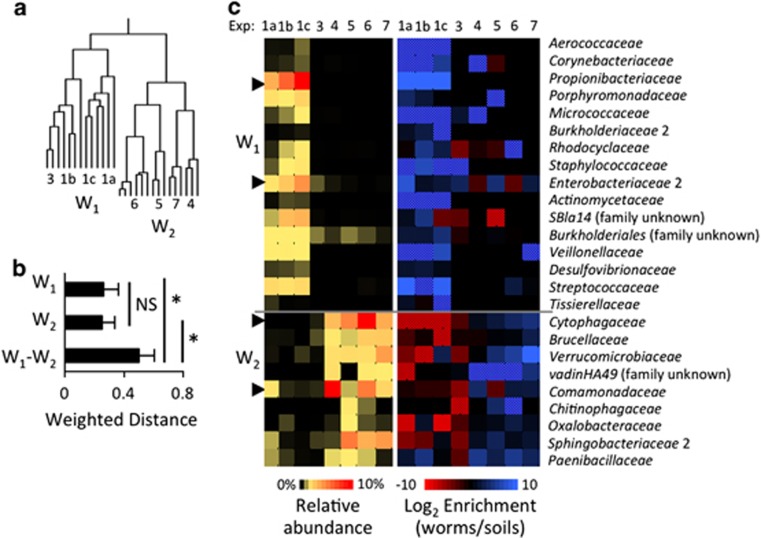
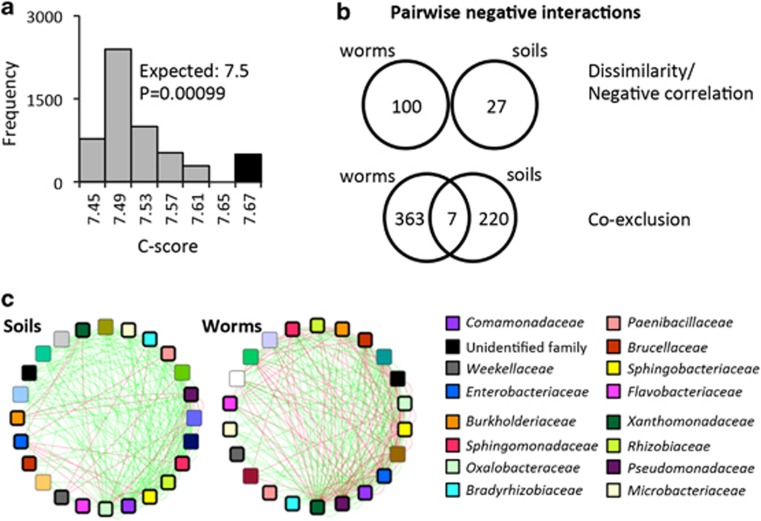
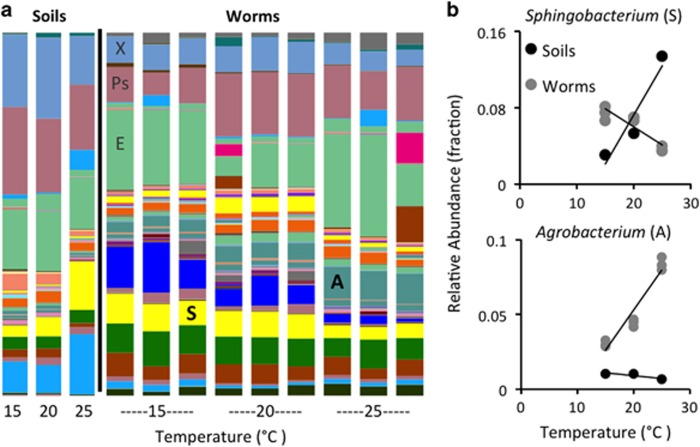
It is now well accepted that the gut microbiota contributes to our health. However, what determines the microbiota composition is still unclear. Whereas it might be expected that the intestinal niche would be dominant in shaping the microbiota, studies in vertebrates have repeatedly demonstrated dominant effects of external factors such as host diet and environmental microbial diversity. Hypothesizing that genetic variation may interfere with discerning contributions of host factors, we turned to Caenorhabditis elegans as a new model, offering the ability to work with genetically homogenous populations. Deep sequencing of 16S rDNA was used to characterize the (previously unknown) worm gut microbiota as assembled from diverse produce-enriched soil environments under laboratory conditions. Comparisons of worm microbiotas with those in their soil environment revealed that worm microbiotas resembled each other even when assembled from different microbial environments, and enabled defining a shared core gut microbiota. Community analyses indicated that species assortment in the worm gut was non-random and that assembly rules differed from those in their soil habitat, pointing at the importance of competitive interactions between gut-residing taxa. The data presented fills a gap in C. elegans biology. Furthermore, our results demonstrate a dominant contribution of the host niche in shaping the gut microbiota.


Figures

Figure 1
Figure 1
Characterization of the worm gut microbiota. (a) Analysis pipeline. (b) Representative electron micrographs showing longitudinal sections through the intestine of washed worms harvested from enriched soil (left, of 40 images in total from seven worms) or from E. coli plates (right, of 17 images in total from four worms). Note intact intestinal bacteria (arrowheads) in worms from soil, and lysed cells in worm from E. coli. l, lumen; v, villi. Scale bars=2 μm.
Figure 2
Figure 2
Worms assemble similar microbiotas from diverse soils. (a) Soil and worm microbiota composition. Bars, each representing a microbiota from a worm population (>100 worms) or from their respective soil environments (1 g), as labeled, showing relative abundance of taxa (family-level, color-labeled). Major groups are highlighted: Enterobacteriaceae (E), Burkholderiaceae (B), Propionibacteriaceae (P), Xanthomonadaceae (X) and Pseudomonadaceae (Ps). (b) Similarity between microbiotas. Weighted UniFrac distances between soil microbiotas (S–S, as demonstrated in panel a), between microbiotas of worms grown in the same soil (Ww), between microbiotas of worms grown in different soils (Wb), or between respective soil and worm microbiotas (S–W); shown are averages±s.d.s for all possible pairwise comparisons; *P=0.007 (Student's t-test with 1000 Monte Carlo simulations). (c) Principal coordinates analysis (PCoA) of worm and soil microbiotas (designated) using weighted UniFrac distances. Data for Soil 1a includes one technical replicate. Dashed line highlights the statistically significant separation between soil and worm microbiotas (P=0.002, PERMANOVA with 1000 permutations). Axes represent the principal coordinates accounting for most of the observed variation.
Figure 3
Figure 3
The worm gut core microbiota. (a) Principal coordinates analysis (PCoA) of soil and worm microbiotas, based on weighted UniFrac distances, expanding the diversity described in Figure 2c; soil and worm microbiotas are significantly distinct (P=0.002, PERMANOVA with 1000 permutations). (b) Worm microbiotas demonstrate a decrease in microbial diversity compared with soil. Two indices of α-diversity are shown, with averages±s.d.s for 10 soil microbiotas and 27 worm microbiotas. *P<0.01 (Student's t-test). (c) The worm gut core microbiota. Heat maps present either relative abundance (left) or enrichment in worms compared with soil (right) of indicator genera that were pooled into the family level; enrichment of taxa not detected in the respective soil but present in worms is shown as patterned. Only the most abundant taxa (>0.1% in any microbiota) are shown; each value is an average of triplicate measurements (or six repeats in the case of Experiment 6) (see Supplementary Table S4 for full list of taxa, and Table S5 for core families abundance).
Figure 4
Figure 4
Worm microbiotas can be divided to two distinct types. (a) UPGMA clustering distinguishes between two worm microbiotas (P=0.001, PERMANOVA with 1000 permutations); Jackknife analysis (see Materials and methods) confirmed the stability of identified clusters. (b) Weighted distances within and between members of the two worm microbiota clusters (W1, W2); averages±s.d.s for pairwise comparisons; *P=0.001 (Student's t-test with 1000 Monte Carlo simulations). (c) Heat map of abundance (left) and enrichment (right) of taxa distinguishing between microbiotas of the two worm clusters, with indicator genera pooled into the family level, and presented as described under Figure 2 (see Supplementary Table S5 for a full list of indicator genera). Enrichment of taxa not detected in soil but present in respective worm microbiotas is shown as patterned blue, and taxa not detected in worms but present in soil, as patterned red. Arrowheads mark prominent indicator families.
Figure 5
Figure 5
Worm microbiotas are assembled in a non-random fashion. (a) C-score for cooccurrence patterns observed among worm microbiota OTUs (black column), compared with a score distribution generated from 5000 random permutations of the same data set (gray). (b) Negative interactions between OTUs in soils or in worms do not overlap. Only OTUs found both in soils and in worms were included. Negative interactions were determined by dissimilarity measures and negative correlation based on abundance (top), or based on absence/presence and coexclusion (bottom) (see Materials and methods). (c) Interaction networks between OTUs in soils or in worms, as designated, using abundance data for OTUs present in both worm and soil microbiotas. Interactions were calculated at the OTU level and pooled at the family level (legend shown on the right). Green lines represent cooccurrences (positive interactions); red lines represent coexclusion (negative interactions).
Figure 6
Figure 6
Temperature modulates worm microbiotas through a host-dependent process. (a) Bar plots showing relative prevalence of different taxa (genus level (to increase resolution), color-labeled) in worm and soil microbiotas incubated at designated temperatures. Three biological replicates for each temperature were analyzed. Soils were incubated at the same temperatures and for the same duration as worms. Prominent genera from core taxa are designated in gray: Enterobacteriaceae, genus unknown (E), Pseudomonas (Ps) and Xanthomondaceae, genus unknown (X); see Supplementary Table S4 for a full list of taxa. (b) Temperature affects certain genera differently in soil or in worms (highlighted in bold in panel a).

References

    1. Arumugam M, Raes J, Pelletier E, Le Paslier D, Yamada T, Mende DR et al. (2011). Enterotypes of the human gut microbiome. Nature 473: 174–180. - PMC - PubMed
    1. Atarashi K, Tanoue T, Shima T, Imaoka A, Kuwahara T, Momose Y et al. (2011). Induction of colonic regulatory T cells by indigenous Clostridium species. Science 331: 337–341. - PMC - PubMed
    1. Avery L, Shtonda BB. (2003). Food transport in the C. elegans pharynx. J Exp Biol 206: 2441–2457. - PMC - PubMed
    1. Barriere A, Felix MA. (2014). Isolation of C. elegans and related nematodes. WormBook 2: 1–19. - PubMed
    1. Bartlett JG. (2002). Clinical practice. Antibiotic-associated diarrhea. N Engl J Med 346: 334–339. - PubMed