

Single-Molecule Imaging of Individual Amyloid Protein Aggregates in Human Biofluids
- PMID: 26800462
- PMCID: PMC4800427
- DOI: 10.1021/acschemneuro.5b00324
Single-Molecule Imaging of Individual Amyloid Protein Aggregates in Human Biofluids
Abstract
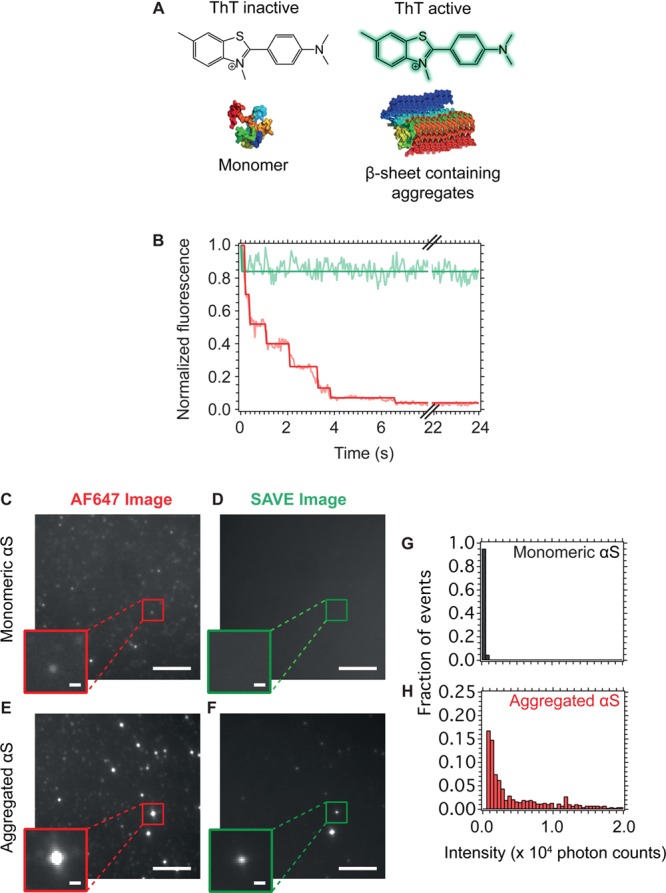
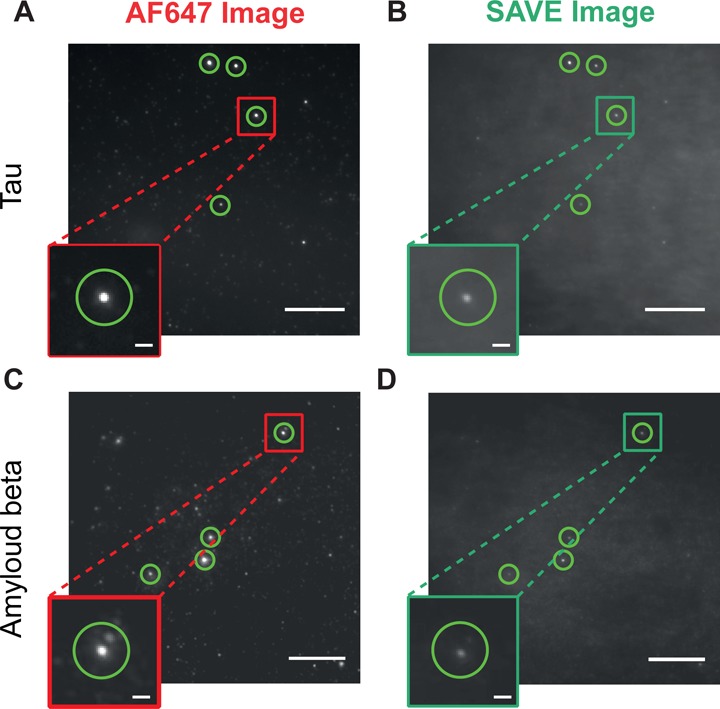
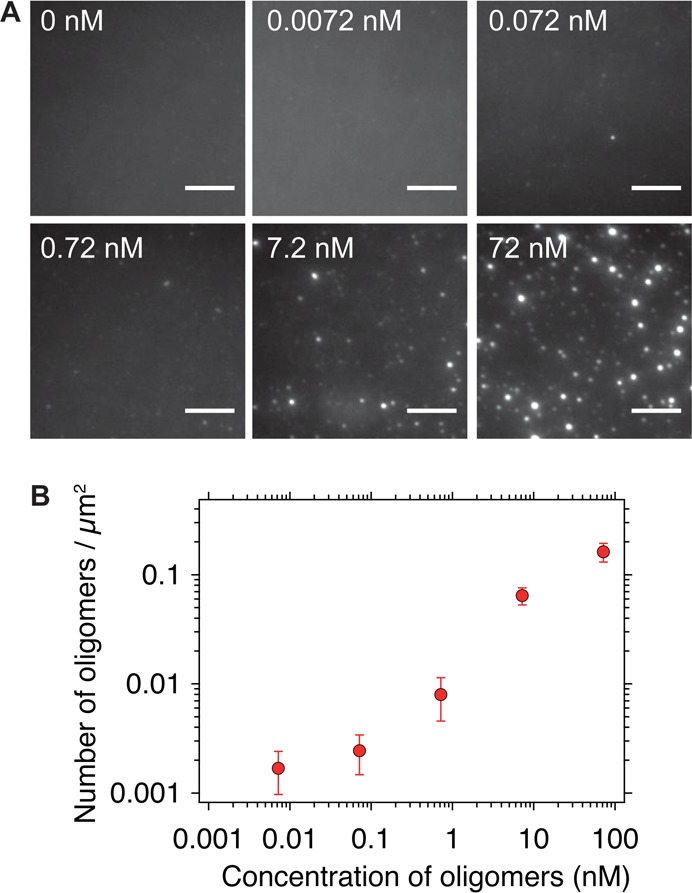
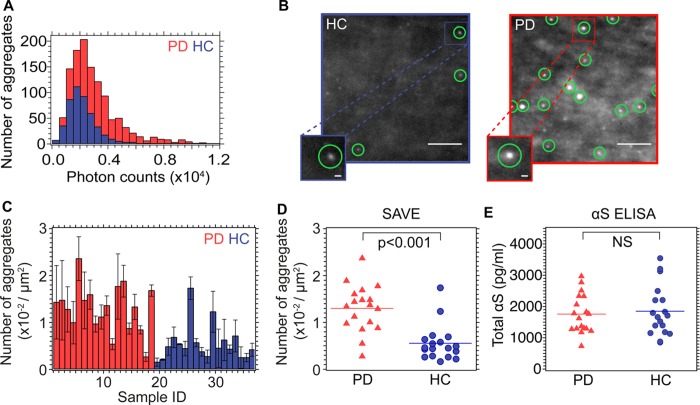
The misfolding and aggregation of proteins into amyloid fibrils characterizes many neurodegenerative disorders such as Parkinson's and Alzheimer's diseases. We report here a method, termed SAVE (single aggregate visualization by enhancement) imaging, for the ultrasensitive detection of individual amyloid fibrils and oligomers using single-molecule fluorescence microscopy. We demonstrate that this method is able to detect the presence of amyloid aggregates of α-synuclein, tau, and amyloid-β. In addition, we show that aggregates can also be identified in human cerebrospinal fluid (CSF). Significantly, we see a twofold increase in the average aggregate concentration in CSF from Parkinson's disease patients compared to age-matched controls. Taken together, we conclude that this method provides an opportunity to characterize the structural nature of amyloid aggregates in a key biofluid, and therefore has the potential to study disease progression in both animal models and humans to enhance our understanding of neurodegenerative disorders.
Keywords: CSF; Parkinson’s; biomarkers; single-molecule.
Conflict of interest statement
The authors declare no competing financial interest.
Figures
Similar articles
-
Imaging protein aggregates in the serum and cerebrospinal fluid in Parkinson's disease.Brain. 2022 Apr 18;145(2):632-643. doi: 10.1093/brain/awab306. Brain. 2022. PMID: 34410317 Free PMC article.
-
High Selectivity and Sensitivity of Oligomeric p-Phenylene Ethynylenes for Detecting Fibrillar and Prefibrillar Amyloid Protein Aggregates.ACS Chem Neurosci. 2019 Mar 20;10(3):1813-1825. doi: 10.1021/acschemneuro.8b00719. Epub 2019 Feb 6. ACS Chem Neurosci. 2019. PMID: 30657326
-
Relationship between cerebrospinal fluid biomarkers and structural brain network properties in Parkinson's disease.Mov Disord. 2018 Mar;33(3):431-439. doi: 10.1002/mds.27284. Epub 2018 Feb 13. Mov Disord. 2018. PMID: 29436735
-
Biological confounders for the values of cerebrospinal fluid proteins in Parkinson's disease and related disorders.J Neurochem. 2016 Oct;139 Suppl 1:290-317. doi: 10.1111/jnc.13390. Epub 2016 Feb 10. J Neurochem. 2016. PMID: 26452984 Review.
-
Crucial role of protein oligomerization in the pathogenesis of Alzheimer's and Parkinson's diseases.FEBS J. 2018 Oct;285(19):3631-3644. doi: 10.1111/febs.14587. Epub 2018 Aug 21. FEBS J. 2018. PMID: 29924502 Review.
Cited by
-
Amyloid-β oligomerization monitored by single-molecule stepwise photobleaching.Methods. 2021 Sep;193:80-95. doi: 10.1016/j.ymeth.2020.06.007. Epub 2020 Jun 13. Methods. 2021. PMID: 32544592 Free PMC article.
-
Single-Molecule Two-Color Coincidence Detection of Unlabeled alpha-Synuclein Aggregates.Angew Chem Int Ed Engl. 2023 Apr 3;62(15):e202216771. doi: 10.1002/anie.202216771. Epub 2023 Feb 28. Angew Chem Int Ed Engl. 2023. PMID: 36762870 Free PMC article.
-
Hsp70 Inhibits the Nucleation and Elongation of Tau and Sequesters Tau Aggregates with High Affinity.ACS Chem Biol. 2018 Mar 16;13(3):636-646. doi: 10.1021/acschembio.7b01039. Epub 2018 Jan 17. ACS Chem Biol. 2018. PMID: 29300447 Free PMC article.
-
The small heat shock protein Hsp27 binds α-synuclein fibrils, preventing elongation and cytotoxicity.J Biol Chem. 2018 Mar 23;293(12):4486-4497. doi: 10.1074/jbc.M117.813865. Epub 2018 Jan 30. J Biol Chem. 2018. PMID: 29382725 Free PMC article.
-
Quantifying misfolded protein oligomers as drug targets and biomarkers in Alzheimer and Parkinson diseases.Nat Rev Chem. 2021 Apr;5(4):277-294. doi: 10.1038/s41570-021-00254-9. Epub 2021 Feb 15. Nat Rev Chem. 2021. PMID: 37117282 Review.
References
Publication types
MeSH terms
Substances
Grants and funding
LinkOut - more resources
Full Text Sources
Other Literature Sources
Medical
