

Flavonoids of Polygonum hydropiper L. attenuates lipopolysaccharide-induced inflammatory injury via suppressing phosphorylation in MAPKs pathways
- PMID: 26801102
- PMCID: PMC4724128
- DOI: 10.1186/s12906-016-1001-8
Flavonoids of Polygonum hydropiper L. attenuates lipopolysaccharide-induced inflammatory injury via suppressing phosphorylation in MAPKs pathways
Abstract
Background: Polygonum hydropiper L. is widely used as a traditional remedy for the treatment of dysentery, gastroenteritis. It has been used to relieve swelling and pain, dispel wind and remove dampness, eliminate abundant phlegm and inflammatory for a long time. Previous study showed that antioxidants especially flavonoids pretreatment alleviated sepsis-induced injury in vitro and in vivo. In the present study, the possible anti-inflammatory effect of flavonoids from normal butanol fraction of Polygonum hydropiper L. extract (FNP) against inflammation induced by lipopolysaccharide (LPS) was evaluated in vivo and in vitro.
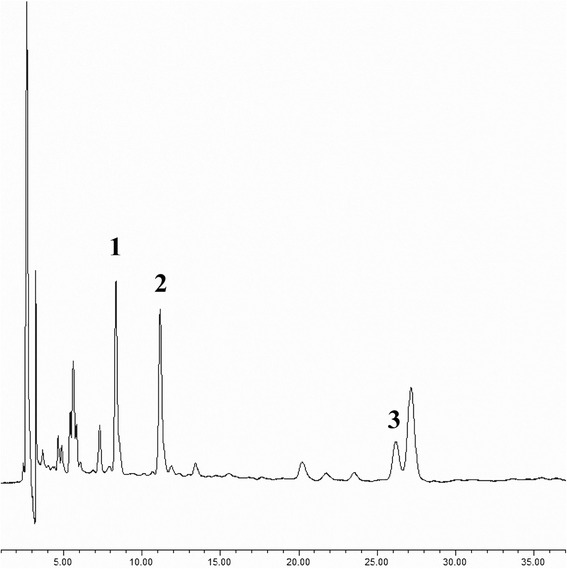
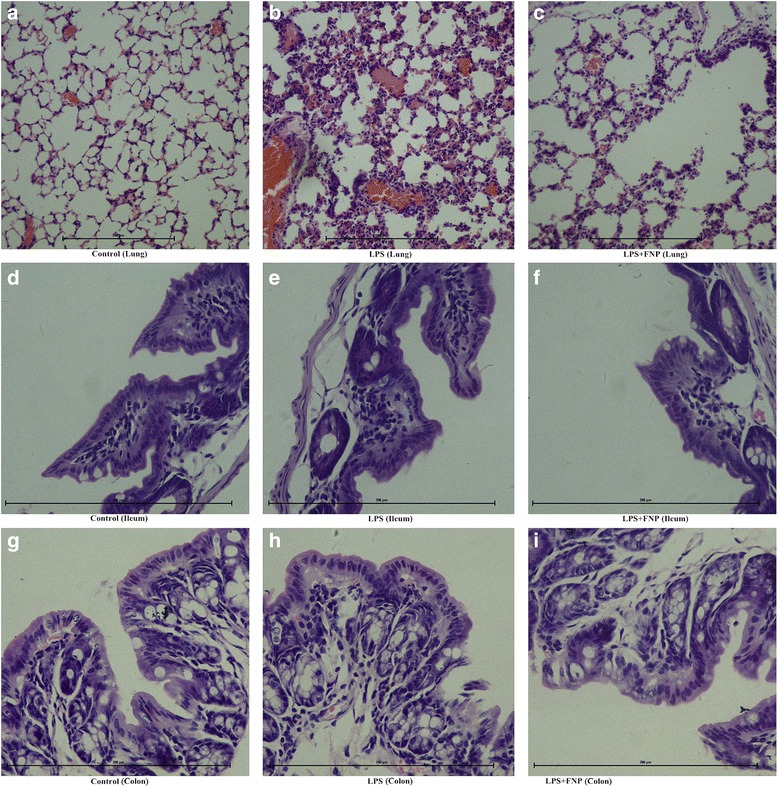
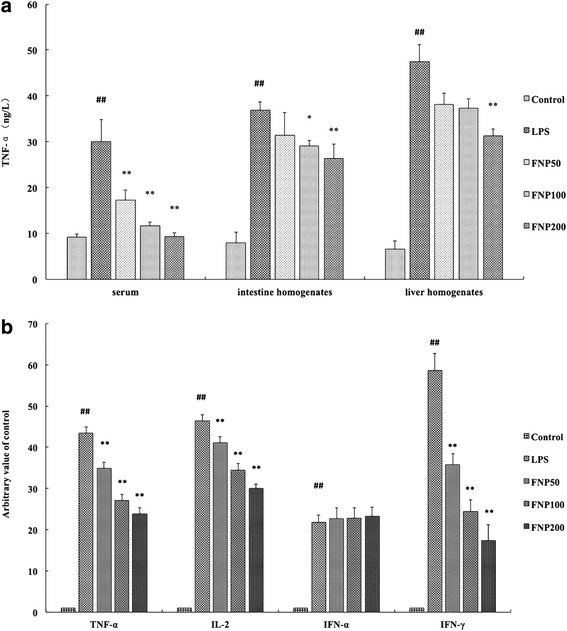
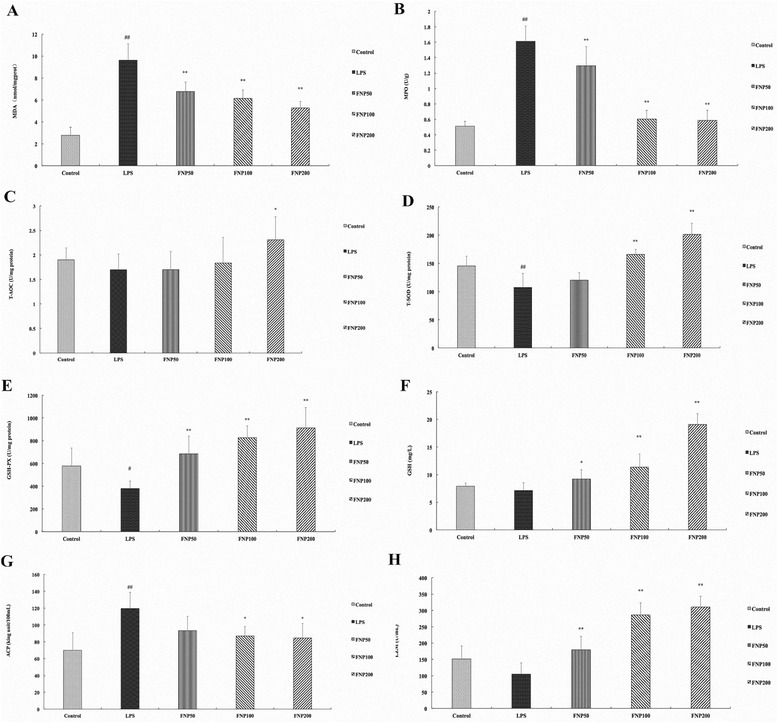
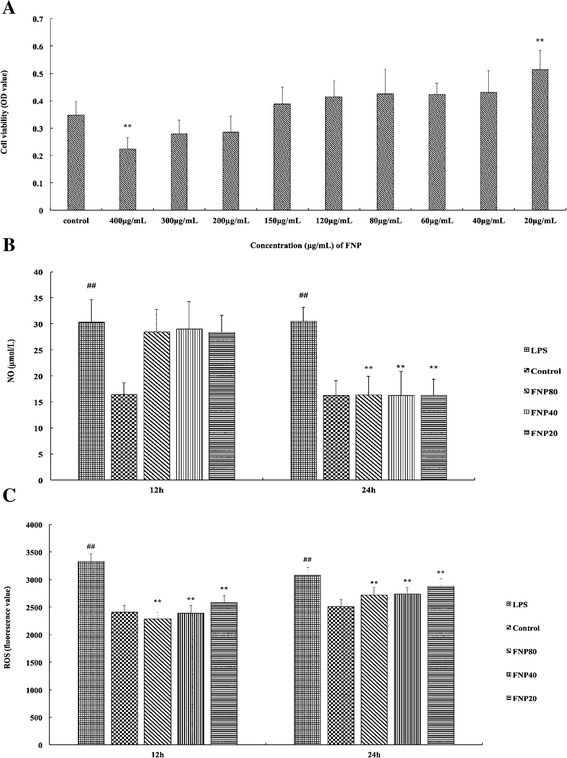
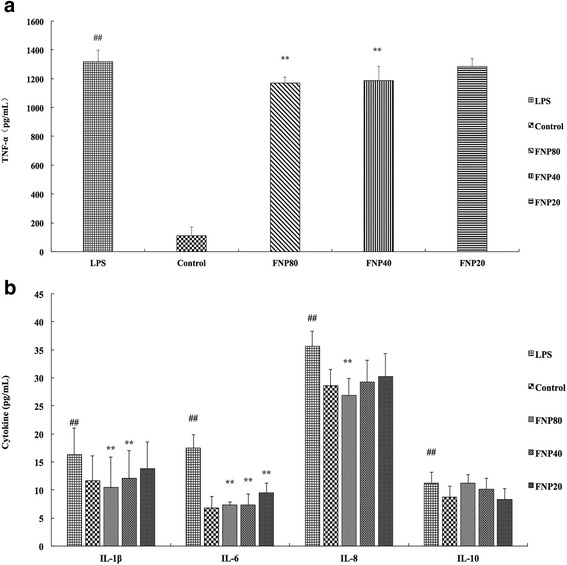
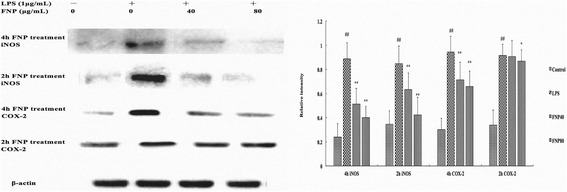
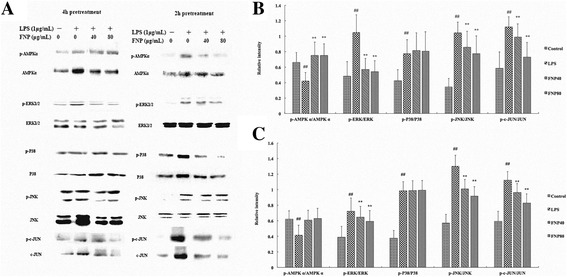
Methods: The content of total flavonoid of FNP was determined by the aluminum colorimetric method. The content of rutin, quercetin and quercitrin was determined by HPLC method. Mice received FNP orally 3 days before an intra-peritoneal (i.p.) injection of lipopolysaccharide (LPS). Total superoxidase dismutase (T-SOD), total antioxidant capacity (T-AOC), glutathione peroxidase (GSH-PX), glutathione (GSH), myeloperoxidase (MPO) and malondialdehyde (MDA) levels were measured. Tumor necrosis factor-α levels in serum and tissue was measured. mRNA expressions of pro-inflammatory cytokines in lung were assessed by Real-Time PCR. Histopathological changes were evaluated in lung, ileum and colon. We also investigated FNP on reactive oxygen species (ROS), nitric oxide (NO) and pro-inflammatory cytokines (TNF-α, IL-1β, IL-6 and IL-8) production, inducible nitric oxide synthase (iNOS), Cyclooxygenase-2 (COX-2) protein expression, phosphorylation of MAPKs and AMPK in LPS-stimulated RAW264.7 cells.
Results: FNP increased the levels of T-SOD, T-AOC, GSH-PX and GSH, decreased the levels of TNF-α, MPO and MDA, attenuate the histopathological lesion in LPS-stimulated mice. FNP inhibited production of inflammatory cytokines, ROS and NO, protein expressions of iNOS and COX-2, phosphorylation of ERK, JNK and c-JUN in MAPKs, promoted phosphorylation of AMPKα suppressed by LPS.
Conclusion: These results suggested in vivo anti-inflammatory activities of FNP might contributed to its enhancement in antioxidant capacity, its inhibitory effects may be mediated by inhibiting the phosphorylation of JNK, ERK and c-JUN in MAPKs signaling pathways.
Figures
Similar articles
-
In vitro and in vivo anti-inflammatory activities of Polygonum hydropiper methanol extract.J Ethnopharmacol. 2012 Jan 31;139(2):616-25. doi: 10.1016/j.jep.2011.12.003. Epub 2011 Dec 13. J Ethnopharmacol. 2012. PMID: 22182430
-
Anti-Inflammatory and Anti-Oxidant Effects of Korean Ginseng Berry Extract in LPS-Activated RAW264.7 Macrophages.Am J Chin Med. 2021;49(3):719-735. doi: 10.1142/S0192415X21500336. Epub 2021 Mar 5. Am J Chin Med. 2021. PMID: 33683191
-
Boehmeria nivea attenuates LPS-induced inflammatory markers by inhibiting p38 and JNK phosphorylations in RAW264.7 macrophages.Pharm Biol. 2013 Sep;51(9):1131-6. doi: 10.3109/13880209.2013.781196. Epub 2013 Jun 10. Pharm Biol. 2013. PMID: 23750815
-
Antioxidative and anti-inflammatory activities of Polygonum minus: a review of literature.Rev Cardiovasc Med. 2020 Jun 30;21(2):275-287. doi: 10.31083/j.rcm.2020.02.50. Rev Cardiovasc Med. 2020. PMID: 32706215
-
Anti-inflammatory plant flavonoids and cellular action mechanisms.J Pharmacol Sci. 2004 Nov;96(3):229-45. doi: 10.1254/jphs.crj04003x. Epub 2004 Nov 12. J Pharmacol Sci. 2004. PMID: 15539763 Review.
Cited by
-
Benefits of Some Phytochemical Compounds in Experimental Sepsis Models: A Therapeutic Perspective.Eurasian J Med. 2023 Dec;55(1):157-164. doi: 10.5152/eurasianjmed.2023.23382. Eurasian J Med. 2023. PMID: 39128074 Free PMC article.
-
The effects of adipose-derived mesenchymal stem cells combined with sodium selenite on Hashimoto's thyroiditis.Am J Transl Res. 2020 Oct 15;12(10):6422-6433. eCollection 2020. Am J Transl Res. 2020. PMID: 33194040 Free PMC article.
-
Natural product derived phytochemicals in managing acute lung injury by multiple mechanisms.Pharmacol Res. 2021 Jan;163:105224. doi: 10.1016/j.phrs.2020.105224. Epub 2020 Sep 29. Pharmacol Res. 2021. PMID: 33007416 Free PMC article. Review.
-
Novel oxicam nonsteroidal compound XK01 attenuates inflammation by suppressing the NF-κB and MAPK pathway in RAW264.7 macrophages.Heliyon. 2024 Jan 9;10(2):e24004. doi: 10.1016/j.heliyon.2024.e24004. eCollection 2024 Jan 30. Heliyon. 2024. PMID: 38312593 Free PMC article.
-
Ethyl acetate fraction of flavonoids from Polygonum hydropiper L. modulates pseudorabies virus-induced inflammation in RAW264.7 cells via the nuclear factor-kappa B and mitogen-activated protein kinase pathways.J Vet Med Sci. 2020 Dec 26;82(12):1781-1792. doi: 10.1292/jvms.20-0263. Epub 2020 Oct 1. J Vet Med Sci. 2020. PMID: 32999131 Free PMC article.
References
Publication types
MeSH terms
Substances
LinkOut - more resources
Full Text Sources
Other Literature Sources
Research Materials
Miscellaneous
