. 2016 Mar;202(3):945-60.
doi: 10.1534/genetics.115.184697. Epub 2016 Jan 22.

Static and Dynamic Factors Limit Chromosomal Replication Complexity in Escherichia coli, Avoiding Dangers of Runaway Overreplication

Affiliations

Static and Dynamic Factors Limit Chromosomal Replication Complexity in Escherichia coli, Avoiding Dangers of Runaway Overreplication

Sharik R Khan et al. Genetics. 2016 Mar.

Abstract

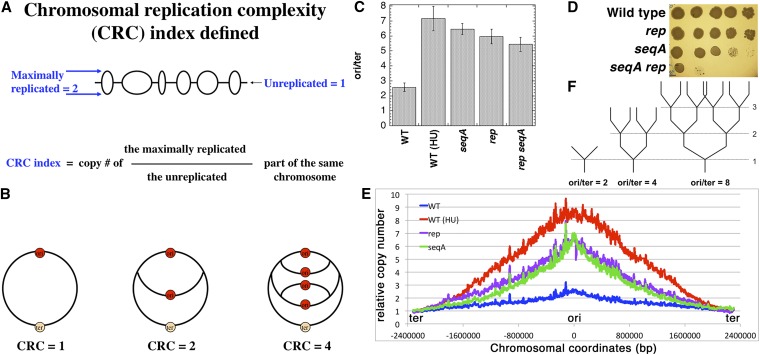
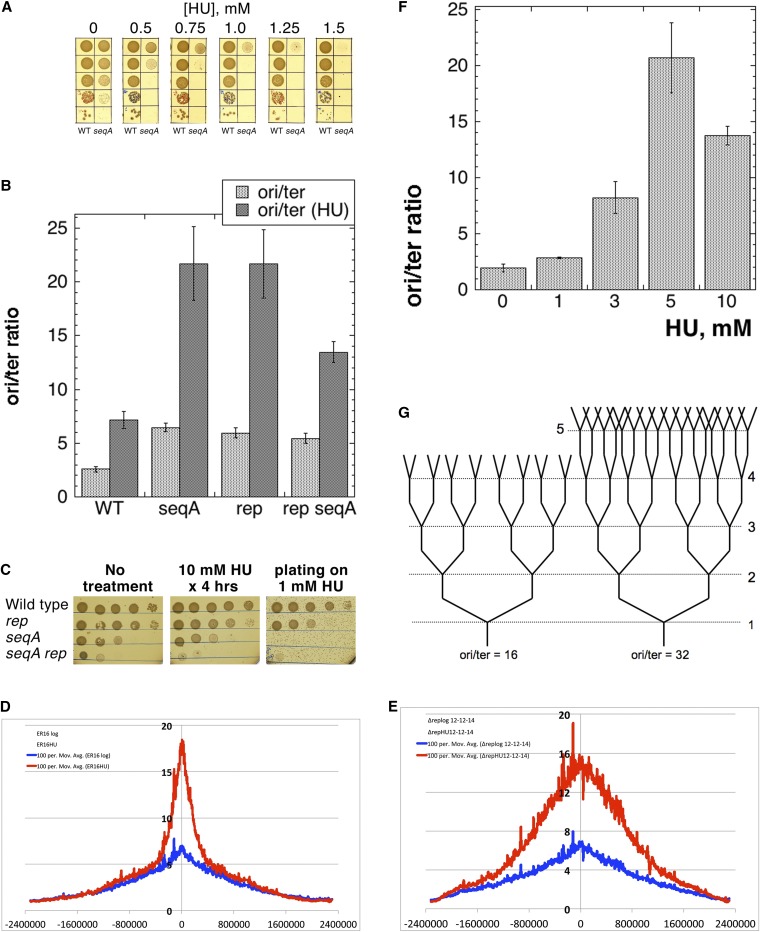
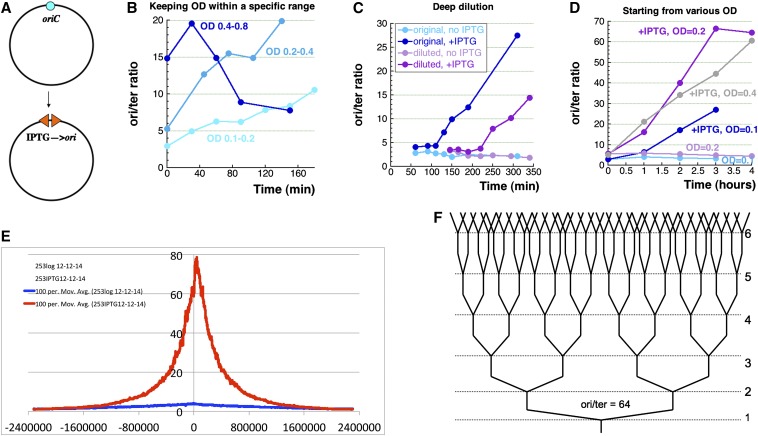
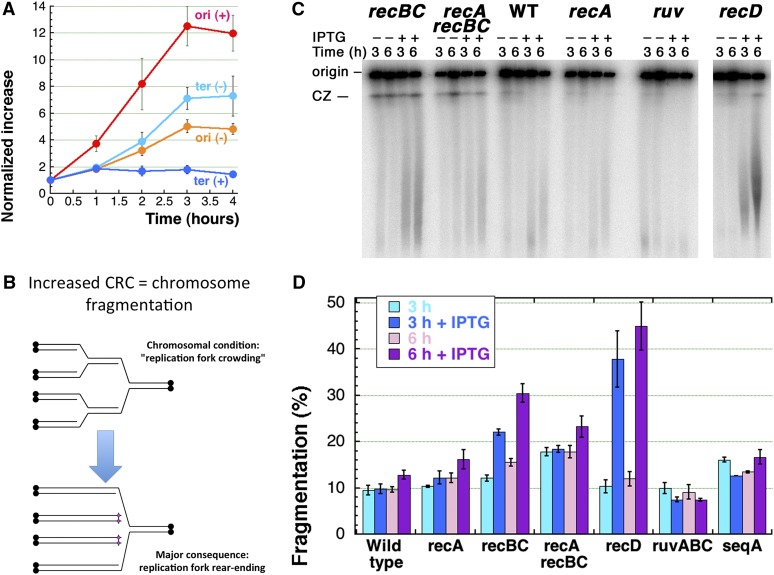
We define chromosomal replication complexity (CRC) as the ratio of the copy number of the most replicated regions to that of unreplicated regions on the same chromosome. Although a typical CRC of eukaryotic or bacterial chromosomes is 2, rapidly growing Escherichia coli cells induce an extra round of replication in their chromosomes (CRC = 4). There are also E. coli mutants with stable CRC∼6. We have investigated the limits and consequences of elevated CRC in E. coli and found three limits: the "natural" CRC limit of ∼8 (cells divide more slowly); the "functional" CRC limit of ∼22 (cells divide extremely slowly); and the "tolerance" CRC limit of ∼64 (cells stop dividing). While the natural limit is likely maintained by the eclipse system spacing replication initiations, the functional limit might reflect the capacity of the chromosome segregation system, rather than dedicated mechanisms, and the tolerance limit may result from titration of limiting replication factors. Whereas recombinational repair is beneficial for cells at the natural and functional CRC limits, we show that it becomes detrimental at the tolerance CRC limit, suggesting recombinational misrepair during the runaway overreplication and giving a rationale for avoidance of the latter.

Keywords: hydroxyurea; overinitiation; recA; rep; seqA.


Figures

Figure 1
Figure 1
Increased replication complexity in cells with slow replication forks reveals the “natural” CRC limit. All cultures in Figure 1 and Figure 2 were grown at 28°; thus, the wild-type doubling time is ∼40 min, and the ori/ter ratio is ∼2. (A) A scheme of the replicating eukaryotic chromosome and the definition of the CRC index. (B) The replication complexity of the bacterial chromosome is simply expressed (and measured) as the origin-to-terminus ratio. (C) Ori/ter ratios in growing E. coli cultures of the indicated mutants (or conditions). (D) Serial dilutions of growing cultures with the corresponding genotypes were spotted to illustrate growth rate differences. (E) Chromosomal marker-frequency profiles of the growing cultures of wild-type, wild-type (HU), rep, and seqA strains. (F) Schematic chromosomal replication complexity at various ori/ter ratios. The chromosomes are shown as lines, and the replication points as Y-junctions. The chromosomes at different replication complexities are not to scale to align the replication points (numbered on the right).
Figure 2
Figure 2
Breaking through the natural limit of chromosomal replication complexity reveals the “functional” CRC limit. (A) Inhibition of seqA mutant cells with concentrations of HU subinhibitory for wild-type cells. (B) Replication complexity in seqA, rep, and seqA rep mutant cells treated with 10 mM HU for 4 hr. Data for wild-type (HU) and for untreated mutants are from Figure 1B. (C) Survival of the cells from cultures either treated with 10 mM HU for 4 hr or spotted on LB + 1 mM HU. (D) Chromosomal marker-frequency profiles of the untreated seqA mutant (blue trend line) vs. the seqA mutant treated with 10 mM HU for 4 hr (red trend line). (E) Chromosomal marker-frequency profiles of the untreated rep mutant (blue trend line) vs. the rep mutant treated with 10 mM HU for 4 hr (red trend line). (F) CRC in wild-type cells growing at steady state in the presence of the indicated concentrations of HU. An overnight culture of AB1157 was diluted 1000-fold and split into several subcultures grown in the presence of the indicated HU concentrations for 24 hr. Subcultures that reached saturation were again diluted 100-fold into the same media and grown for ∼4 hr. The 10 mM culture grew extremely slowly and was not diluted the second time, but just grown for another 4 hr. Kinetics of OD increase of the cultures were monitored, as well as the shape of the cells under the microscope, to guard against a sweep by HU-resistant mutants. (G) Schematic chromosomal replication complexity at ori/ter = 16 and 32.
Figure 3
Figure 3
Finding optimal induction conditions for maximal ori/ter ratio with inducible chromosomal origin. All cultures in this figure and in Figure 4 and Figure 5 were grown at 37° to fully inactivate the recBC(Ts) allele, if present. At 37°, the wild-type doubling time is ∼25 min, elevating the basal ori/ter ratio to almost 4. (A) A scheme of the chromosome driven by IOC, which is the double back-to-back IPTG-driven ColE1 origin, inserted ∼5 kbp “to the right” of oriC, which is still there. (B) Optimizing the induction 1: keeping OD of the induced culture within specific ranges. In B–D, the strains were either SRK252 or SRK253, as they behaved essentially the same. (C) Optimizing the induction 2: deep dilution of the culture. An overnight culture was diluted 100-fold (“original culture”), grown for 2 hr, then a portion of it was further diluted 400-fold (at the time point of 120 min), and both the just-diluted and the original cultures were induced with IPTG at that time. (D) Optimizing the induction 3: starting induction from cultures with various (indicated) ODs. (E) Chromosomal marker-frequency profiles of the wild-type (blue) and IOC (red) strains after 4 hr of IPTG induction from OD = 0.2. (F) Schematic chromosome replication complexity at ori/ter = 64.
Figure 4
Figure 4
Chromosome fragmentation due to the induced overinitiation. (A) Kinetics of origin and terminus accumulation in the absence of induction (–) vs. after IPTG induction (+). The apparently low numbers for origin increase in the IPTG-induced cultures (12× over the initial level) actually match the high ori/ter ratios from Figure 3D because the initial ori/ter ratio (6 in this experiment) should be used as a multiplier. (B) A scheme of how replication fork crowding can lead to double-strand DNA breaks via replication fork rear-ending into each other. (C) A representative pulsed-field gel to detect chromosomal fragmentation in various rec mutants carrying the inducible origin. CZ, compression zone. The resolution of these gels is such that the bottom corresponds to ∼50 kbp, while the compression zone accumulates species that are ≥2 mbp (Kouzminova et al. 2004). (D) Quantification of chromosomal fragmentation at 3 hr (3 h) and 6 hr (6 h) of IPTG induction in various mutants carrying inducible origin. The corresponding uninduced controls (light color bars) serve as a background. Data are means of three to eight independent determinations ± SEM.
Figure 5
Figure 5
Genetics of survival of the induced overinitiation vs. the kinetics of CRC accumulation. (A) A scheme of the two major pathways of recombinational repair in E. coli. Magenta circle, a noncoding DNA lesion; cyan triangle, the invading 3′-single-strand end. (B) Survival of 6 hr IPTG induction by wild-type and various mutant IOC cultures with wild-type-like effects. (C) Survival of 6 hr IPTG induction by wild-type and various double-strand break repair-mutant IOC cultures. (D) Kinetics of the ori/ter ratios during IPTG induction of IOC in wild-type cells, as well as in recA, ruv, and ruv recG mutants. (E) Kinetics of the ori/ter ratios during IPTG induction of IOC in recBC(Ts), recA recBC(Ts), and recD mutants. (F) Kinetics of the ori/ter ratios during IPTG induction of IOC in rep and seqA mutants. (G) A scheme of possible chromosome problems due to runaway CRC. DNA duplexes are presented by single lines. Black lines, the circular domains of the chromosome; blue lines, the (partially) linear domains that would not enter pulsed-field gels; the pink lines, subchromosomal fragments that would enter pulsed-field gels. Scenario I: The overreplicating chromosome without problems and lethality. Scenario II: Some replication forks rear-ended the previous forks in a paired fashion, while (in the top half) new initiations also happened, masking some fragmentation. Similar to scenario I, this scenario also predicts no lethality, even without any further action form the cell. Scenario III: Unpaired replication fork disintegration generates multi-tailed chromosome (expected to be lethal without repair or linear DNA degradation).
Figure 6
Figure 6
A model for recombinational misrepair: attachment of a double-strand end to a cousin duplex, rather than to the sister duplex. In some panels, chromosomal arms are color-coded to facilitate tracking. (A) A theta-replicating chromosome with CRC = 2. (B) Overinitiation increases CRC to 4. (C) Disintegration of one of the replication forks generates a double-strand end (DSE, marked with yellow star) that needs to be reattached by homology to restore the replication fork. Because of the increased CRC, there are three homologous duplexes: the sister one (black) and two cousins (blue and purple). R, reattachment to sister will be “repair” and will restore the structure in B. MR, attachment to one of the cousins will constitute “misrepair” and will lead to the structure in D. (D) A replicating chromosome with an inter-cousin arm. (E) Replication of this chromosome leads to four chromosomes: a free one (purple) and the “pince-nez” structure, linking circular black and blue chromosomes with a linear concatemeric red chromosome. How such a structure can be resolved is currently unknown.

Similar articles

Cited by

References

    1. Ahmad S. I., Kirk S. H., Eisenstark A., 1998. Thymine metabolism and thymineless death in prokaryotes and eukaryotes. Annu. Rev. Microbiol. 52: 591–625. - PubMed
    1. Atkinson J., Gupta M. K., McGlynn P., 2011. Interaction of Rep and DnaB on DNA. Nucleic Acids Res. 39: 1351–1359. - PMC - PubMed
    1. Bidnenko V., Ehrlich S. D., Michel B., 2002. Replication fork collapse at replication terminator sequences. EMBO J. 21: 3898–3907. - PMC - PubMed
    1. Bipatnath M., Dennis P. P., Bremer H., 1998. Initiation and velocity of chromosome replication in Escherichia coli B/r and K-12. J. Bacteriol. 180: 265–273. - PMC - PubMed
    1. Bird R. E., Louarn J., Martuscelli J., Caro L., 1972. Origin and sequence of chromosome replication in Escherichia coli. J. Mol. Biol. 70: 549–566. - PubMed

Publication types

LinkOut - more resources