A meta-analysis of fMRI decoding: Quantifying influences on human visual population codes
- PMID: 26801229
- PMCID: PMC4761448
- DOI: 10.1016/j.neuropsychologia.2016.01.018
A meta-analysis of fMRI decoding: Quantifying influences on human visual population codes
Abstract
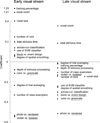
Information in the human visual system is encoded in the activity of distributed populations of neurons, which in turn is reflected in functional magnetic resonance imaging (fMRI) data. Over the last fifteen years, activity patterns underlying a variety of perceptual features and objects have been decoded from the brains of participants in fMRI scans. Through a novel multi-study meta-analysis, we have analyzed and modeled relations between decoding strength in the visual ventral stream, and stimulus and methodological variables that differ across studies. We report findings that suggest: (i) several organizational principles of the ventral stream, including a gradient of pattern granulation and an increasing abstraction of neural representations as one proceeds anteriorly; (ii) how methodological choices affect decoding strength. The data also show that studies with stronger decoding performance tend to be reported in higher-impact journals, by authors with a higher h-index. As well as revealing principles of regional processing, our results and approach can help investigators select from the thousands of design and analysis options in an empirical manner, to optimize future studies of fMRI decoding.
Keywords: Decoding; MVPA; Meta-analysis; Objects; Patterns; Vision.
Copyright © 2016 Elsevier Ltd. All rights reserved.
Figures


Similar articles
-
Decoding the visual and subjective contents of the human brain.Nat Neurosci. 2005 May;8(5):679-85. doi: 10.1038/nn1444. Epub 2005 Apr 24. Nat Neurosci. 2005. PMID: 15852014 Free PMC article.
-
Visual Object Recognition: Do We (Finally) Know More Now Than We Did?Annu Rev Vis Sci. 2016 Oct 14;2:377-396. doi: 10.1146/annurev-vision-111815-114621. Epub 2016 Aug 3. Annu Rev Vis Sci. 2016. PMID: 28532357 Review.
-
Sensible decoding.Neuroimage. 2015 Apr 15;110:217-8. doi: 10.1016/j.neuroimage.2015.02.009. Epub 2015 Feb 11. Neuroimage. 2015. PMID: 25680521
-
Spatial scale and distribution of neurovascular signals underlying decoding of orientation and eye of origin from fMRI data.J Neurophysiol. 2017 Feb 1;117(2):818-835. doi: 10.1152/jn.00590.2016. Epub 2016 Nov 30. J Neurophysiol. 2017. PMID: 27903637 Free PMC article.
-
The human visual cortex.Annu Rev Neurosci. 2004;27:649-77. doi: 10.1146/annurev.neuro.27.070203.144220. Annu Rev Neurosci. 2004. PMID: 15217346 Review.
Cited by
-
Goal-Directed Visual Processing Differentially Impacts Human Ventral and Dorsal Visual Representations.J Neurosci. 2017 Sep 6;37(36):8767-8782. doi: 10.1523/JNEUROSCI.3392-16.2017. Epub 2017 Aug 14. J Neurosci. 2017. PMID: 28821655 Free PMC article.
-
Experientially-grounded and distributional semantic vectors uncover dissociable representations of conceptual categories.Lang Cogn Neurosci. 2023 Jul 12;39(8):1020-1044. doi: 10.1080/23273798.2023.2232481. eCollection 2024. Lang Cogn Neurosci. 2023. PMID: 39777206 Free PMC article.
-
Neural Patterns are More Similar across Individuals during Successful Memory Encoding than during Failed Memory Encoding.Cereb Cortex. 2020 Jun 1;30(7):3872-3883. doi: 10.1093/cercor/bhaa003. Cereb Cortex. 2020. PMID: 32147702 Free PMC article.
-
Neural activity in human visual cortex is transformed by learning real world size.Neuroimage. 2019 Feb 1;186:570-576. doi: 10.1016/j.neuroimage.2018.11.039. Epub 2018 Nov 23. Neuroimage. 2019. PMID: 30476625 Free PMC article.
-
Dyadic interaction processing in the posterior temporal cortex.Neuroimage. 2019 Sep;198:296-302. doi: 10.1016/j.neuroimage.2019.05.027. Epub 2019 May 14. Neuroimage. 2019. PMID: 31100434 Free PMC article.
References
-
- Baas M, De Dreu CKW, Nijstad BA. A meta-analysis of 25 years of mood-creativity research: hedonic tone, activation, or regulatory focus? Psychological Bulletin. 2008;134(6):779–806. - PubMed
-
- Bäckman L, Jones S, Berger A-K, Laukka EJ, Small BJ. Cognitive impairment in preclinical Alzheimer’s disease: a meta-analysis. Neuropsychology. 2005;19(4):520–531. - PubMed
-
- Brants M, Baeck A, Wagemans J, Op de Beeck HP. Multiple scales of organization for object selectivity in ventral visual cortex. NeuroImage. 2011;56:1372–1381. - PubMed
Publication types
MeSH terms
Grants and funding
LinkOut - more resources
Full Text Sources
Other Literature Sources
Medical
Research Materials

