. 2016 Jan 22:14:6.
doi: 10.1186/s12915-016-0229-6.

Alternative cleavage and polyadenylation in spermatogenesis connects chromatin regulation with post-transcriptional control

Affiliations

Alternative cleavage and polyadenylation in spermatogenesis connects chromatin regulation with post-transcriptional control

Wencheng Li et al. BMC Biol. .

Abstract

Background: Most mammalian genes display alternative cleavage and polyadenylation (APA). Previous studies have indicated preferential expression of APA isoforms with short 3' untranslated regions (3'UTRs) in testes.

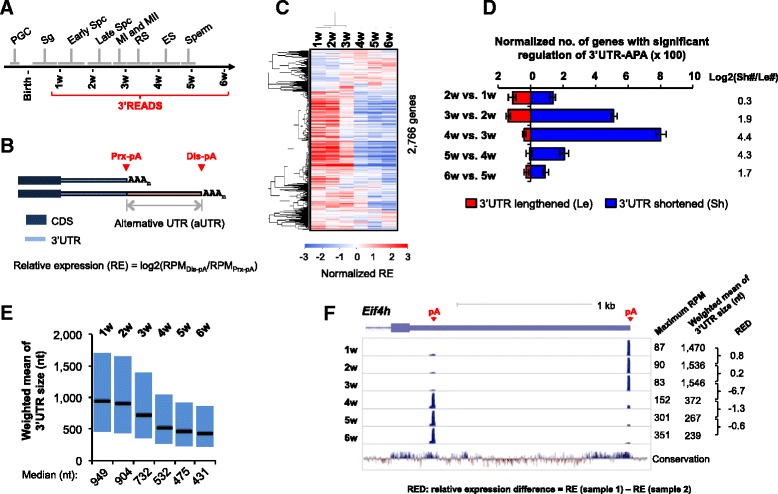
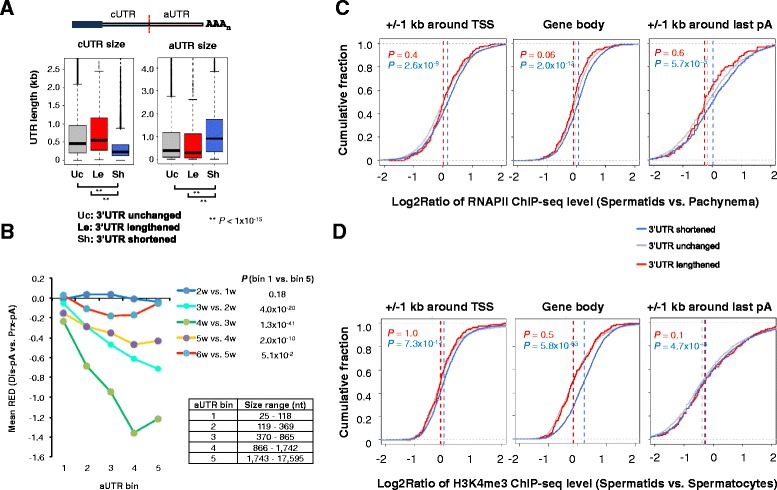
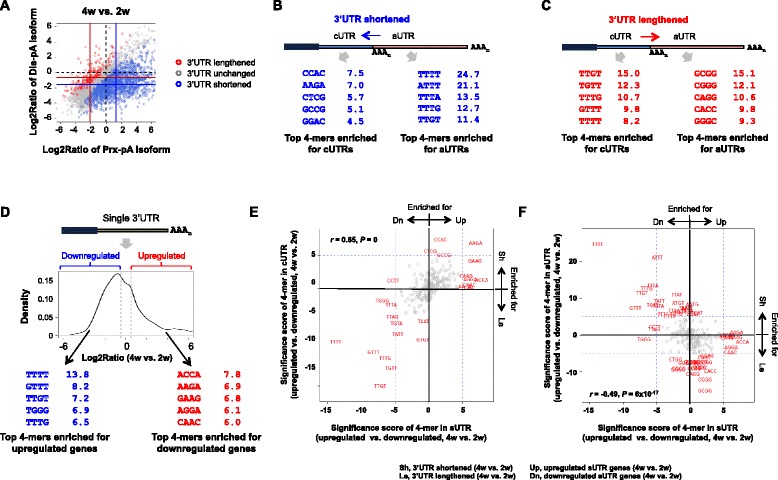
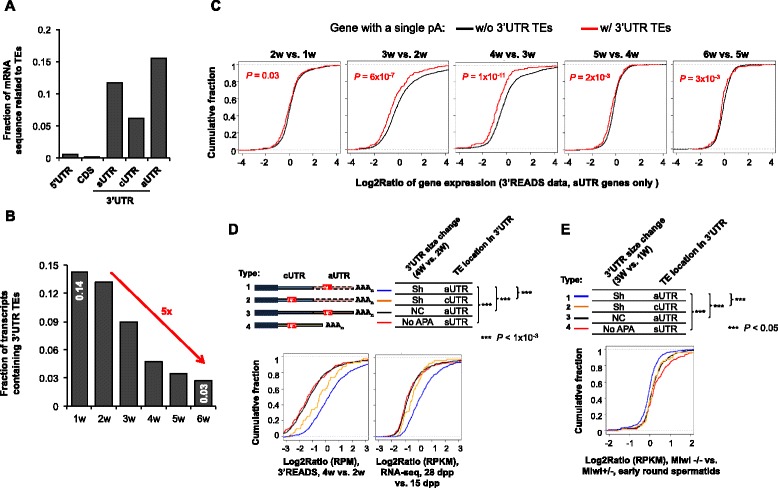
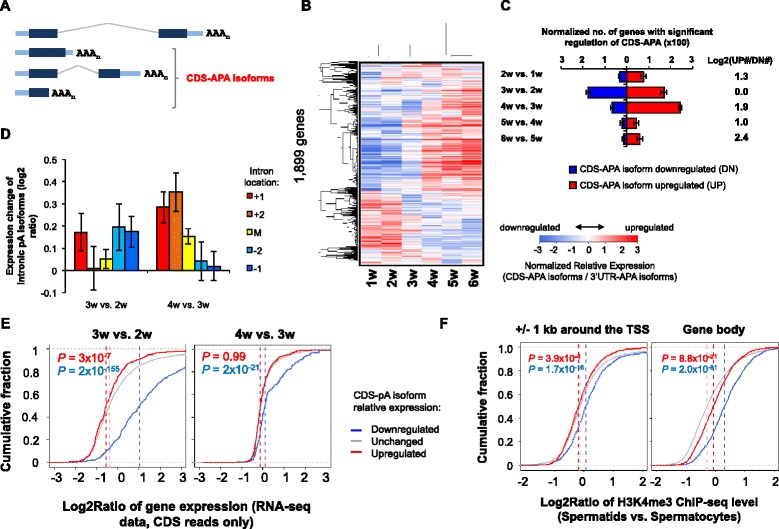
Results: By deep sequencing of the 3' end region of poly(A) + transcripts, we report widespread shortening of 3'UTR through APA during the first wave of spermatogenesis in mouse, with 3'UTR size being the shortest in spermatids. Using genes without APA as a control, we show that shortening of 3'UTR eliminates destabilizing elements, such as U-rich elements and transposable elements, which appear highly potent during spermatogenesis. We additionally found widespread regulation of APA events in introns and exons that can affect the coding sequence of transcripts and global activation of antisense transcripts upstream of the transcription start site, suggesting modulation of splicing and initiation of transcription during spermatogenesis. Importantly, genes that display significant 3'UTR shortening tend to have functions critical for further sperm maturation, and testis-specific genes display greater 3'UTR shortening than ubiquitously expressed ones, indicating functional relevance of APA to spermatogenesis. Interestingly, genes with shortened 3'UTRs tend to have higher RNA polymerase II and H3K4me3 levels in spermatids as compared to spermatocytes, features previously known to be associated with open chromatin state.

Conclusions: Our data suggest that open chromatin may create a favorable cis environment for 3' end processing, leading to global shortening of 3'UTR during spermatogenesis. mRNAs with shortened 3'UTRs are relatively stable thanks to evasion of powerful mRNA degradation mechanisms acting on 3'UTR elements. Stable mRNAs generated in spermatids may be important for protein production at later stages of sperm maturation, when transcription is globally halted.


Figures

Fig. 1
Fig. 1
Significant 3’UTR shortening during spermatogenesis. a Schematic of the first wave spermatogenesis in mouse. ES, elongated spermatids; MI and MII, meiosis phases I and II; PGC, primordial germ cells; RS, round spermatids; Sg, spermatogonia; Spc, spermatocytes. b Schematic of APA analysis. Relative expression (RE) of two selected pA isoforms using proximal (Prx) and distal (Dis) pAs was based on the formula indicated. The region between the two pAs is alternative UTR (aUTR). c Heatmap showing gene RE values during spermatogenesis. Each row is a pA pair of a gene, whose RE values in different samples (columns) were normalized to the mean of each row. Two-way clustering was conducted using the Pearson correlation coefficient as metric. Only genes with read number ≥20 for Prx-pA and Dis-pA isoforms combined were selected for analysis (a total of 2,766 genes). d Normalized number of genes with significant regulation of 3’UTR-APA between adjacent stages. The global analysis of alternative polyadenylation (GAAP) and significance analysis of alternative polyadenylation (SAAP) methods were used (see Methods for details). The numbers of genes with 3’UTR lengthened (Le) and shortened (Sh) are plotted separately, as indicated. Error bars are standard deviation based on 20 times of data sampling. The log2Ratio of number of Sh genes to that of Le genes, or log2(Sh#/Le#), for each comparison is shown on the right. e Boxplots of weighted mean of 3’UTR size (see Methods for its calculation). Median values are indicated. f APA of an example gene Eif4h in spermatogenesis. Only the 3’-most exon is shown. The maximum RPM value for each track (y-axis) and the weighted 3’UTR size at each time point are shown. The relative expression difference (RED) value between two adjacent time points is indicated. The conservation track was based on the PhyloP score
Fig. 2
Fig. 2
3’UTRs are the shortest in spermatids. a Schematic showing analysis of 3’UTR-APA using RNA-seq reads. Three 3’UTR-APA isoforms are shown. The common 3’UTR portion is called cUTR, and the alternative portion aUTR. RNA-seq reads mapped to aUTR was normalized to those mapped to cUTR to infer the relative expression of long vs. short 3’UTR isoforms. b Cumulative distribution function (CDF) curves of log2Ratio for RNA-seq reads mapped to aUTRs vs. those to cUTRs in different purified cells from testis. Median values are shown on the right. The data set used [NCBI GEO:GSE43717] was based on a strand-specific RNA-seq method. c An example gene Cep57. The 3’READS data indicating 3’UTR-pA sites are shown on the top and RNA-seq data are shown at the bottom. Weighted mean of 3’UTR size based on the 3’READS data is shown for each time point
Fig. 3
Fig. 3
Genes with shortened 3’UTRs are more likely to have upregulated expression. a Gene expression changes at different stages of spermatogenesis. Genes were divided into three groups based on 3’UTR regulation between comparing samples (FDR = 5 %, SAAP analysis), namely shortened, unchanged and lengthened (shown in blue, gray and red, respectively). 3’READS data were used for the analysis, with all APA isoforms of a gene combined to represent the overall expression of the gene. The median value for each group is indicated by a dotted vertical line. P values (K–S test) indicating difference in expression between genes with shortened or lengthened 3’UTRs and genes with 3’UTRs unchanged are shown in each graph (in blue or red, respectively). b Gene expression changes between different stages of spermatogenesis based on RNA-seq reads [NCBI GEO:GSE42004] mapped to coding sequences (CDS). Because only CDS reads were used, gene expression analysis was not affected by 3’UTR changes. As in (a), genes were divided into three groups based on APA regulation using 3’READS data with the closest time points. Dpp, day post partum. c Gene expression levels (log2(RPKM)) for genes with shortened, unchanged or lengthened 3’UTRs at different stages of spermatogenesis. The plot is based on the RNA-seq data used for (b). 3’UTR regulation is based on 4w vs. 2w comparison. d Testis-specific genes tend to have greater 3’UTR shortening than ubiquitously expressed genes. The number of genes for each group is indicated. The P value (K–S test) indicates difference in relative expression difference (RED, 4w vs. 2w, see Fig. 1f for definition) between two groups
Fig. 4
Fig. 4
Shortening of 3’UTR by APA correlates with high transcriptional activity and open chromatin. a cUTR and aUTR sizes of genes with different 3’UTR-APA regulations. Left, boxplot showing cUTR size of genes with shortened (Sh), lengthened (Le), or unchanged (Uc) 3’UTRs. Right, same as the plot on the left except that aUTR size is plotted. 3’UTR regulation by APA was based on the SAAP analysis (4w vs. 2w, FDR = 5 %). P values comparing different gene groups were based on the K–S test. b Genes with longer aUTRs tend to have greater 3’UTR shortening in spermatogenesis. Genes are divided into five bins based on aUTR size, as indicated. The mean RED values between adjacent time points of all genes are plotted. P values (Wilcoxon rank-sum test) comparing gene bins 1 and 5 are shown. c Log2Ratio of RNAPII ChIP-seq levels between spermatids and pachynema (pachytene stage spermatocytes) for three groups of genes, namely 3’UTR shortened, unchanged and lengthened, around the TSS (+/− 1 kb, left), in gene body (middle) and around the last pA (+/− 1 kb, right). 3’UTR regulation was based on comparison of 4w and 2w samples. P values (K–S test) comparing genes with 3’UTR shortened (blue) or lengthened (red) with 3’UTR unchanged are indicated. d Log2Ratio of H3K4me3 ChIP-seq levels between spermatids and spermatocytes for three groups of genes, namely 3’UTR shortened, unchanged and lengthened, around the TSS (+/− 1 kb, left), in gene body (middle) and around the last pA (+/− 1 kb, right). 3’UTR regulation was based on comparison of 4w and 2w samples. P values (K–S test) comparing genes with 3’UTR shortened (blue) or lengthened (red) with 3’UTR unchanged are indicated
Fig. 5
Fig. 5
3’UTR cis elements contribute to mRNA abundance changes and APA profiles in spermatogenesis. a Scatterplot showing genes with lengthened, shortened and unchanged 3’UTRs between 4w and 2w samples. Significant 3’UTR-APA events were based on the SAAP analysis (FDR = 5 %) using the top two most abundant 3’UTR-pA isoforms of each gene. b Significant 4-mers enriched in cUTRs and aUTRs of genes with shortened 3’UTRs. Values are − log10(P), where P was based on the Fisher’s exact test examining the enrichment of 4-mers in cUTR (left) or aUTR (right) regions of genes with shortened 3’UTRs (4w vs. 2w). c As in (b) except that genes with lengthened 3’UTRs were analyzed. d Top, schematic showing cis element analysis using genes with only one pA, i.e., having a single 3’UTR (sUTR). Middle, upregulated and downregulated sUTR genes in the 4w vs. 2w comparison, corresponding to >1.4 fold change in RPM value, were selected for 3’UTR analysis. Bottom, top enriched 4-mers for sUTRs of downregulated genes (left) or upregulated genes (right). As in (b), values are − log10(P), where P was based on the Fisher’s exact test examining 4-mer enrichment. e Comparison of 4-mer enrichment in cUTR as calculated in (b) and (c) with that in sUTR as calculated in (d). X-axis values are − log10(P)*S, where P is the 4-mer enrichment P value for upregulated vs. downregulated genes, and S is 1 if a 4-mer is more enriched for sUTRs of upregulated genes, or −1 otherwise. Y-axis values are − log10(P)*S, where P is for enrichment of 4-mer in cUTRs of shortened or lengthened 3’UTRs, whichever is greater, and S is 1 if a 4-mer is more enriched for cUTRs of shortened 3’UTRs or −1 otherwise. f As in (e) except that y-axis is for enrichment of 4-mers in aUTRs of shortened or lengthened 3’UTRs
Fig. 6
Fig. 6
3’UTR shortening eliminates TEs. a TE contents in 5’UTR, CDS and 3’UTR of all genes. aUTR, alternative 3’UTR; cUTR, common 3’UTR; sUTR, single 3’UTR (gene without APA). The fraction of mRNA sequence related to TEs was based on the number of nucleotides of the TEs annotated by the RepeatMasker track of UCSC Genome Browser (mm9). b Change of TE-containing mRNAs in spermatogenesis. The fraction of the transcripts containing 3’UTR TEs at each time point is plotted. c Gene expression changes for genes with or without 3’UTR TEs. Only genes with a single 3’UTR (sUTR) were used for this analysis. Expression was based on the 3’READS data. P values (K–S test) indicating difference between the two gene groups are shown. d Expression changes of four types of genes. A type 1 gene has 3’UTR shortened and contains TEs only in aUTR; a type 2 gene also has 3’UTR shortened but contains TEs in cUTR only; a type 3 gene has 3’UTR unchanged and contains TEs in aUTR; a type 4 gene has a single 3’UTR (no APA) and there are TEs in the 3’UTR. All APA regulation was based on the 4w vs. 2w comparison. Bottom, gene expression was analyzed using 3’READS data (4w vs. 2w, left), or CDS reads of RNA-seq data (28 dpp vs. 15 dpp, right). P values (K–S test) indicating difference between type 1 genes and others are indicated on the top. e Gene expression difference in Miwi−/− vs. Miwi+/− at the early round spermatid stage for the four gene types described in (d) except that the APA analysis was based on 3w vs. 1w comparison. Gene expression was based on RNA-seq reads mapped to CDS. The type 1 gene set was compared with other types using the K–S test. P values are all significant (<1 × 10−3)
Fig. 7
Fig. 7
Regulation of CDS-APA in spermatogenesis. a Schematic of CDS-APA. CDS-APA isoforms are those using pAs in introns or non-3’-most exons. b Heatmap showing relative expression (RE) values of CDS-APA isoforms vs. 3’-most exon isoforms. RE values are mean-centered and clustered using hierarchical clustering with Pearson correlation coefficient as metric. c Normalized number of genes with significant regulation of CDS-APA as identified by GAAP and SAAP analyses (FDR = 5 %) (see Methods for details). The ratio of number of genes with upregulated (UP) CDS-APA isoforms to that with downregulated (DN) isoforms is indicated. d Regulation of isoforms using pAs in different introns. Introns were divided into five groups, i.e., the first and second introns (+1 and +2, respectively), the last and second to last introns (−1 and −2, respectively) and middle introns (M). The expression change of isoform is based on RPM values. e Gene expression changes vs. CDS-pA regulation. Genes were divided into three indicated groups based on CDS-APA regulation between comparing samples (SAAP analysis, FDR = 5 %). The median value for each group is indicated by a dotted vertical line. The P value (K–S test) for difference between genes with upregulated or downregulated CDS-APA and those with unchanged CDS-APA is shown in each graph (in red or blue, respectively). RNA-seq data with CDS reads were used for gene expression analysis. f ChIP-seq analysis of H3K4me3 levels on genes with CDS-APA regulation. Log2Ratio of ChIP-seq levels between spermatids and spermatocytes for the three gene groups is shown. CDS-APA regulation was based on comparison of 4w and 2w samples, corresponding to spermatid and spermatocyte stages, respectively. P value (K–S test) comparing genes having downregulated (blue) or upregulated (red) CDS-pA isoforms with genes having CDS-APA unchanged is indicated
Fig. 8
Fig. 8
Widespread activation of upstream antisense RNA expression in spermatogenesis. a Schematic of upstream antisense RNA (uaRNA). An uaRNA is defined as an antisense transcript with pA located within 2 kb from the transcription start site (TSS) of a gene. b uaRNA expression is significantly upregulated in spermatogenesis. 3’READS data were used for the plot. Reads per million (RPM) value was assigned to each pA location. c Relationship between uaRNA expression and sense RNA expression at different time points. Correlation is indicated by the Pearson correlation coefficient (r) and P value for linear regression. d ChIP-seq analysis of H3K4me3 levels on genes with uaRNA regulation. Enrichment scores of H3K4me3 +/− 4 kb around the TSS are plotted for genes with upregulated uaRNAs or other genes. P values were based on the Wilcoxon rank-sum test comparing RPM values of the two gene groups in the +/− 1 kb region from the TSS
Fig. 9
Fig. 9
A proposed model for the mechanism and consequence of APA regulation in spermatogenesis. During maturation of spermatocytes into spermatids, chromatin becomes more open, leading to more transcriptional activities. Open chromatin and/or heightened transcription may create a more permissive cis environment for cleavage/polyadenylation (C/P). The enhanced C/P activity results in more usage of proximal pAs, leading to higher expression of short 3’UTR isoforms relative to long isoforms. Isoforms with short 3’UTRs avoid destabilizing cis elements in 3’UTRs, such as U-rich elements and TEs, which are potent during spermatogenesis. Stable isoforms are stored for translation after the spermatid stage when transcription is globally halted. Question marks indicate detailed mechanism(s) are not clear

Similar articles

Cited by

References

    1. Zhao J, Hyman L, Moore C. Formation of mRNA 3' ends in eukaryotes: mechanism, regulation, and interrelationships with other steps in mRNA synthesis. Microbiol Mol Biol Rev. 1999;63(2):405–45. - PMC - PubMed
    1. Colgan DF, Manley JL. Mechanism and regulation of mRNA polyadenylation. Genes Dev. 1997;11(21):2755–66. doi: 10.1101/gad.11.21.2755. - DOI - PubMed
    1. Tian B, Graber JH. Signals for pre-mRNA cleavage and polyadenylation. Wiley Interdiscip Rev RNA. 2012;3(3):385–96. doi: 10.1002/wrna.116. - DOI - PMC - PubMed
    1. Proudfoot NJ. Ending the message: poly(A) signals then and now. Genes Dev. 2011;25(17):1770–82. doi: 10.1101/gad.17268411. - DOI - PMC - PubMed
    1. Mandel CR, Bai Y, Tong L. Protein factors in pre-mRNA 3'-end processing. Cell Mol Life Sci. 2008;65(7-8):1099–122. doi: 10.1007/s00018-007-7474-3. - DOI - PMC - PubMed

Publication types