Post-weaning blood transcriptomic differences between Yorkshire pigs divergently selected for residual feed intake
- PMID: 26801403
- PMCID: PMC4724083
- DOI: 10.1186/s12864-016-2395-x
Post-weaning blood transcriptomic differences between Yorkshire pigs divergently selected for residual feed intake
Abstract
Background: Improving feed efficiency (FE) of pigs by genetic selection is of economic and environmental significance. An increasingly accepted measure of feed efficiency is residual feed intake (RFI). Currently, the molecular mechanisms underlying RFI are largely unknown. Additionally, to incorporate RFI into animal breeding programs, feed intake must be recorded on individual pigs, which is costly and time-consuming. Thus, convenient and predictive biomarkers for RFI that can be measured at an early age are greatly desired. In this study, we aimed to explore whether differences exist in the global gene expression profiles of peripheral blood of 35 to 42 day-old pigs with extremely low (more efficient) and high RFI (less efficient) values from two lines that were divergently selected for RFI during the grow-finish phase, to use such information to explore the potential molecular basis of RFI differences, and to initiate development of predictive biomarkers for RFI.
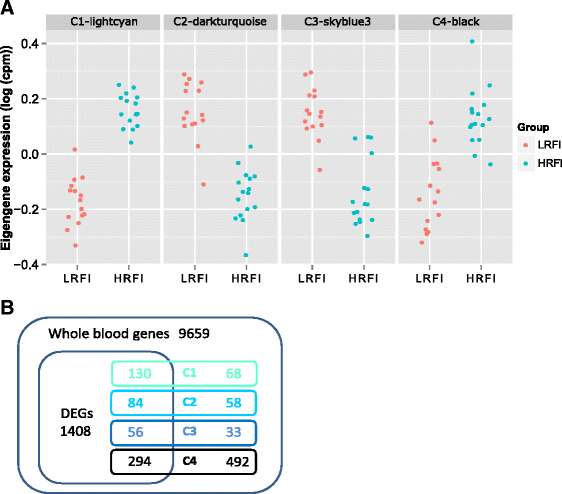
Results: We identified 1972 differentially expressed genes (DEGs) (q ≤ 0.15) between the low (n = 15) and high (n = 16) RFI groups of animals by using RNA sequencing technology. We validated 24 of 37 selected DEGs by reverse transcription-quantitative PCR (RT-qPCR) in a joint analysis of 24 (12 per line) of the 31 samples already used for RNA-seq plus 24 (12 per line) novel samples from the same contemporary group of pigs. Using an analysis of the 24 novel samples alone, only nine of the 37 selected DEGs were validated. Genes involved in small molecule biosynthetic process, antigen processing and presentation of peptide antigen via major histocompatibility complex (MHC) class I, and steroid biosynthetic process were overrepresented among DEGs that had higher expression in the low versus high RFI animals. Genes known to function in the proteasome complex or mitochondrion were also significantly enriched among genes with higher expression in the low versus high RFI animals. Alternatively, genes involved in signal transduction, bone mineralization and regulation of phosphorylation were overrepresented among DEGs with lower expression in the low versus high RFI animals. The DEGs significantly overlapped with genes associated with disease, including hyperphagia, eating disorders and mitochondrial diseases (q < 1E-05). A weighted gene co-expression network analysis (WGCNA) identified four co-expression modules that were differentially expressed between the low and high RFI groups. Genes involved in lipid metabolism, regulation of bone mineralization, cellular immunity and response to stimulus were overrepresented within the two modules that were most significantly differentially expressed between the low and high RFI groups. We also found five of the DEGs and one of the co-expression modules were significantly associated with the RFI phenotype of individual animals (q < 0.05).
Conclusions: The post-weaning blood transcriptome was clearly different between the low and high RFI groups. The identified DEGs suggested potential differences in mitochondrial and proteasomal activities, small molecule biosynthetic process, and signal transduction between the two RFI groups and provided potential new insights into the molecular basis of RFI in pigs, although the observed relationship between the post-weaning blood gene expression and RFI phenotype measured during the grow-finish phase was not strong. DEGs and representative genes in co-expression modules that were associated with RFI phenotype provide a preliminary list for developing predictive biomarkers for RFI in pigs.
Figures


Similar articles
-
Divergent selection for residual feed intake affects the transcriptomic and proteomic profiles of pig skeletal muscle.J Anim Sci. 2015 Jun;93(6):2745-58. doi: 10.2527/jas.2015-8928. J Anim Sci. 2015. PMID: 26115262
-
Acute systemic inflammatory response to lipopolysaccharide stimulation in pigs divergently selected for residual feed intake.BMC Genomics. 2019 Oct 11;20(1):728. doi: 10.1186/s12864-019-6127-x. BMC Genomics. 2019. PMID: 31610780 Free PMC article.
-
RNA-Seq transcriptomics and pathway analyses reveal potential regulatory genes and molecular mechanisms in high- and low-residual feed intake in Nordic dairy cattle.BMC Genomics. 2017 Mar 24;18(1):258. doi: 10.1186/s12864-017-3622-9. BMC Genomics. 2017. PMID: 28340555 Free PMC article.
-
Residual Feed Intake as an Efficiency Metric for Pre-Weaning Dairy Calves: What Do We Know?Life (Basel). 2023 Aug 11;13(8):1727. doi: 10.3390/life13081727. Life (Basel). 2023. PMID: 37629582 Free PMC article. Review.
-
Identification of gene expression profiles in myocardial infarction: a systematic review and meta-analysis.BMC Med Genomics. 2018 Nov 27;11(1):109. doi: 10.1186/s12920-018-0427-x. BMC Med Genomics. 2018. PMID: 30482209 Free PMC article.
Cited by
-
Genome-wide analysis of DNA methylation in obese, lean, and miniature pig breeds.Sci Rep. 2016 Jul 22;6:30160. doi: 10.1038/srep30160. Sci Rep. 2016. PMID: 27444743 Free PMC article.
-
Transcriptome Analysis Identifies Candidate Genes and Pathways Associated With Feed Efficiency in Hu Sheep.Front Genet. 2019 Nov 19;10:1183. doi: 10.3389/fgene.2019.01183. eCollection 2019. Front Genet. 2019. PMID: 31798641 Free PMC article.
-
Muscle Transcriptome Analysis Reveals Potential Candidate Genes and Pathways Affecting Intramuscular Fat Content in Pigs.Front Genet. 2020 Aug 11;11:877. doi: 10.3389/fgene.2020.00877. eCollection 2020. Front Genet. 2020. PMID: 32849841 Free PMC article.
-
Systems Biology Reveals NR2F6 and TGFB1 as Key Regulators of Feed Efficiency in Beef Cattle.Front Genet. 2019 Mar 22;10:230. doi: 10.3389/fgene.2019.00230. eCollection 2019. Front Genet. 2019. PMID: 30967894 Free PMC article.
-
Porcine Feed Efficiency-Associated Intestinal Microbiota and Physiological Traits: Finding Consistent Cross-Locational Biomarkers for Residual Feed Intake.mSystems. 2019 Jun 18;4(4):e00324-18. doi: 10.1128/mSystems.00324-18. mSystems. 2019. PMID: 31213524 Free PMC article.
References
-
- National program of swine feed efficiency [http://www.swinefeedefficiency.com/project.html]. Accessed 21 Jan. 2016 .
-
- Patience JF. Feed efficiency in swine. Wageningen: Wageningen Academic Publishers; 2012.
-
- Koch RM, Swiger LA, Chambers D, Gregory KE. Efficiency of Feed Use in Beef Cattle. J Anim Sci. 1963;22(2):486–94.
Publication types
MeSH terms
LinkOut - more resources
Full Text Sources
Other Literature Sources
Research Materials

