. 2016 Jan 22:17:74.
doi: 10.1186/s12864-016-2401-3.

Comparative genome-wide transcriptome analysis of Vitis vinifera responses to adapted and non-adapted strains of two-spotted spider mite, Tetranyhus urticae

Affiliations

Comparative genome-wide transcriptome analysis of Vitis vinifera responses to adapted and non-adapted strains of two-spotted spider mite, Tetranyhus urticae

Jose Díaz-Riquelme et al. BMC Genomics. .

Abstract

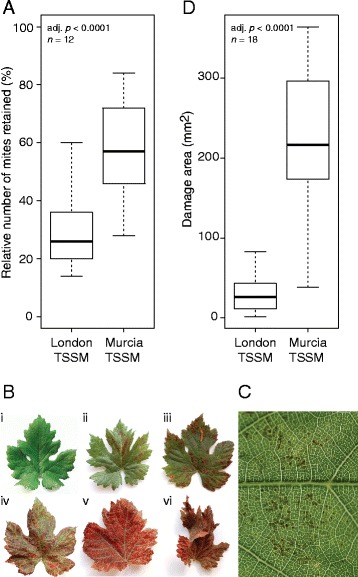
Background: The two-spotted spider mite, Tetranychus urticae, is an extreme generalist plant pest. Even though mites can feed on many plant species, local mite populations form host races that do not perform equally well on all potential hosts. An acquisition of the ability to evade plant defenses is fundamental for mite's ability to use a particular plant as a host. Thus, understanding the interactions between the plant and mites with different host adaptation status allows the identification of functional plant defenses and ways mites can evolve to avoid them.

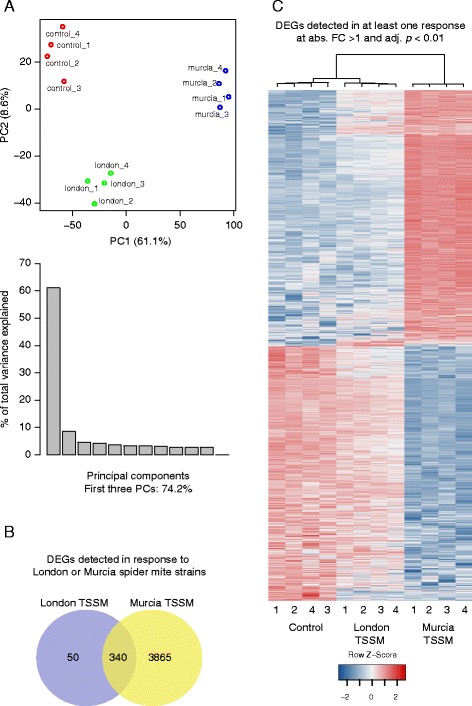
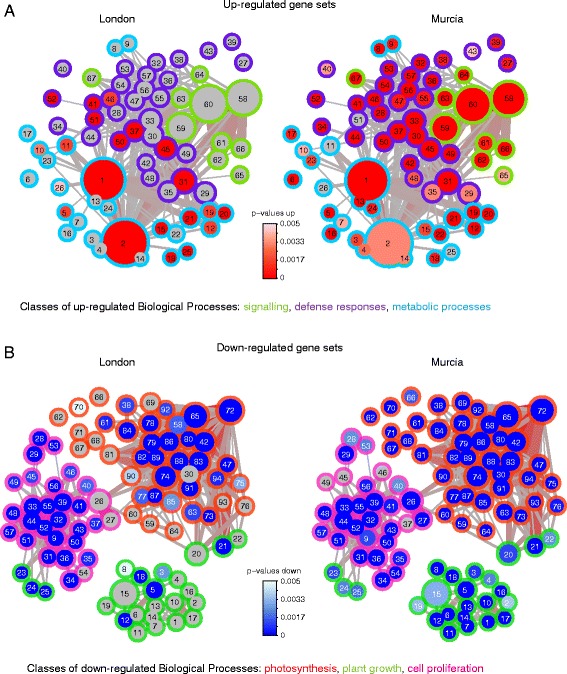
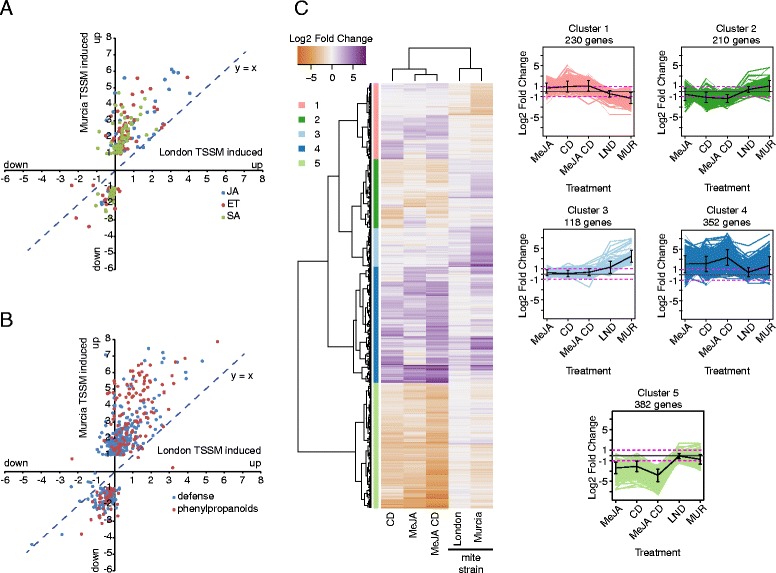
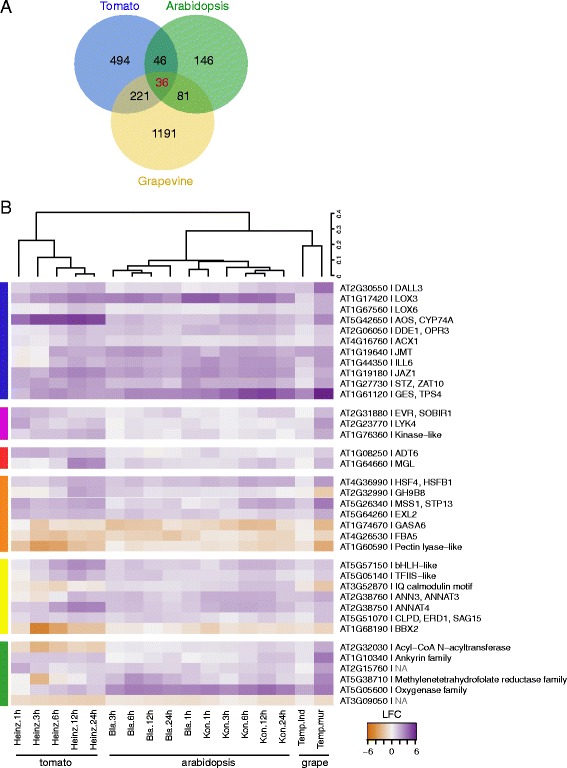
Results: The grapevine genome-wide transcriptional responses to spider mite strains that are non-adapted and adapted to grapevine as a host were examined. Comparative transcriptome analysis of grapevine responses to these mite strains identified the existence of weak responses induced by the feeding of the non-adapted strain. In contrast, strong but ineffective induced defenses were triggered upon feeding of the adapted strain. A comparative meta-analysis of Arabidopsis, tomato and grapevine responses to mite feeding identified a core of 36 highly conserved genes involved in the perception, regulation and metabolism that were commonly induced in all three species by mite herbivory.

Conclusions: This study describes the genome-wide grapevine transcriptional responses to herbivory of mite strains that differ in their ability to use grapevine as a host. It raises hypotheses whose testing will lead to our understanding of grapevine defenses and mite adaptations to them.


Figures

Fig. 1
Fig. 1
Performance of non-adapted London and adapted Murcia spider mite strains on grapevine. a Dispersal behavior of spider mites, as assessed by the total number of mites retained on the infested leaf after 24 h. b Progressive symptoms of feeding of the adapted mite on grapevine leaves (i-vi). c Close up of the grapevine leaf exposed to spider mite feeding for 24 h showing brown spots. d Extent of damage area of brown spots of grapevine leaves exposed to 50 mites for 24 h
Fig. 2
Fig. 2
Grapevine transcriptional responses to feeding of non-adapted London and adapted Murcia spider mite strains. a Principal component analysis of expression measures data for non-adapted London and adapted Murcia TSSM strains. b Comparison of DEGs detected in response to London or Murcia TSSM strains. c Hierarchical clustering analysis of log2 Fold Changes exhibited by DEGs with absolute FC > 2 and BH-adjusted P < 0.01 detected upon feeding of non-adapted London and adapted Murcia TSSM strains for 24 h. The distance metric was Pearson’s r, and the hierarchical clustering method was average
Fig. 3
Fig. 3
Gene set enrichment analysis of biological processes for differentially expressed genes (DEG) detected in grapevine responses to feeding of non-adapted London and adapted Murcia spider mite strains. Parametric analysis of gene set enrichment (PAGE) network based on Biological Processes (BP) Gene Ontology (GO) annotation with significantly enriched (a) up- and (b) down-regulated gene sets. Nodes represent gene sets, edges indicate the overlap in genes belonging to connected gene sets. Gene sets: blue – down-regulated, red – up-regulated, gray – not detected as differentially regulated. Size corresponds to number of genes in a given gene set (up-regulated gene sets – 15 to 568, down-regulated – 15 to 112), correspondence between node labels and GO Term/ID is provided in Data S3. The color (gray to red) and width of the edges correspond to an overlap size (up-regulated gene sets – 8 to 351, down-regulated – 8 to 55)
Fig. 4
Fig. 4
Analysis of differentially expressed genes detected in response to London spider mite strain with BH-adjusted P < 0.01. a Scatter plot of Log2 Fold Changes detected in response to London and Murcia spider mite strains. b Parametric analysis of gene set enrichment (PAGE) network based on Biological Processes (BP) Gene Ontology (GO) annotation with significantly enriched up- and down-regulated gene sets. Nodes represent gene sets, edges indicate the overlap in genes belonging to connected gene sets. Gene sets: blue – down-regulated, red – up-regulated, gray – not detected as differentially regulated. Size corresponds to number of genes in a given gene set (5 to 163), correspondence between node labels and GO Term/ID is provided in Data S6. The color (gray to red) and width of the edges correspond to an overlap size (3 to 43)
Fig. 5
Fig. 5
Analysis of differentially expressed genes associated with hormone signaling and defense compound production in response to spider mite feeding and comparison of grapevine response to JA pathway induction and spider mite feeding. a Scatter plot of Log2 Fold Changes of DEG associated with JA (blue), ET (red) and SA (green) signaling cascades detected in response to London and Murcia spider mite strains. b Scatter plot of Log2 Fold Changes of DEG associated with defense compounds (blue) and phenylpropanoids (red) production detected in response to London and Murcia spider mite strains. c Hierarchical clustering analysis of log2 Fold Changes of 1292 genes detected as most variable in response to induction of JA pathway [16] and spider mite feeding (this study). Genes and condition clustering was performed using Pearson’s r as a distance metric and average clustering
Fig. 6
Fig. 6
Analysis of conservation of defense response to spider mite herbivory across Arabidopsis, grapevine and tomato. a Comparison of DEG detected in response to spider mite herbivory that are orthologous across three species [4, 5]. b Hierarchical clustering analysis of log2 Fold Changes of core 36 conserved DEG involved in JA metabolism and signaling (blue), perception (purple), amino acid metabolism (red), growth (orange), regulation (yellow) and enzymatic reactions (green)

Similar articles

Cited by

References

    1. Kessler A, Baldwin IT. Plant responses to insect herbivory: The emerging molecular analysis. Annu Rev Plant Biol. 2002;53:299–328. doi: 10.1146/annurev.arplant.53.100301.135207. - DOI - PubMed
    1. Jeppson LR, Keifer HH, Baker EW. Mites injurious to economic plants. Berkeley: London: University of California Press; 1975.
    1. Spider Mites Web: a comprehensive database for the Tetranychidae. [http://www.montpellier.inra.fr/CBGP/spmweb]
    1. Martel C, Zhurov V, Navarro M, Martinez M, Cazaux M, Auger P, et al. Tomato Whole Genome Transcriptional Response to Tetranychus urticae Identifies Divergence of Spider Mite-Induced Responses Between Tomato and Arabidopsis. Mol Plant Microbe Interact. 2015;28(3):343–361. doi: 10.1094/MPMI-09-14-0291-FI. - DOI - PubMed
    1. Zhurov V, Navarro M, Bruinsma KA, Arbona V, Santamaria ME, Cazaux M, et al. Reciprocal responses in the interaction between Arabidopsis and the cell-content-feeding chelicerate herbivore spider mite. Plant Physiol. 2014;164(1):384–399. doi: 10.1104/pp.113.231555. - DOI - PMC - PubMed

Publication types

LinkOut - more resources