

Gene expression profiling in necrotizing enterocolitis reveals pathways common to those reported in Crohn's disease
- PMID: 26801768
- PMCID: PMC4722613
- DOI: 10.1186/s12920-016-0166-9
Gene expression profiling in necrotizing enterocolitis reveals pathways common to those reported in Crohn's disease
Abstract
Background: Necrotizing enterocolitis (NEC) is the most frequent life-threatening gastrointestinal disease experienced by premature infants in neonatal intensive care units. The challenge for neonatologists is to detect early clinical manifestations of NEC. One strategy would be to identify specific markers that could be used as early diagnostic tools to identify preterm infants most at risk of developing NEC or in the event of a diagnostic dilemma of suspected disease. As a first step in this direction, we sought to determine the specific gene expression profile of NEC.
Methods: Deep sequencing (RNA-Seq) was used to establish the gene expression profiles in ileal samples obtained from preterm infants diagnosed with NEC and non-NEC conditions. Data were analyzed with Ingenuity Pathway Analysis and ToppCluster softwares.
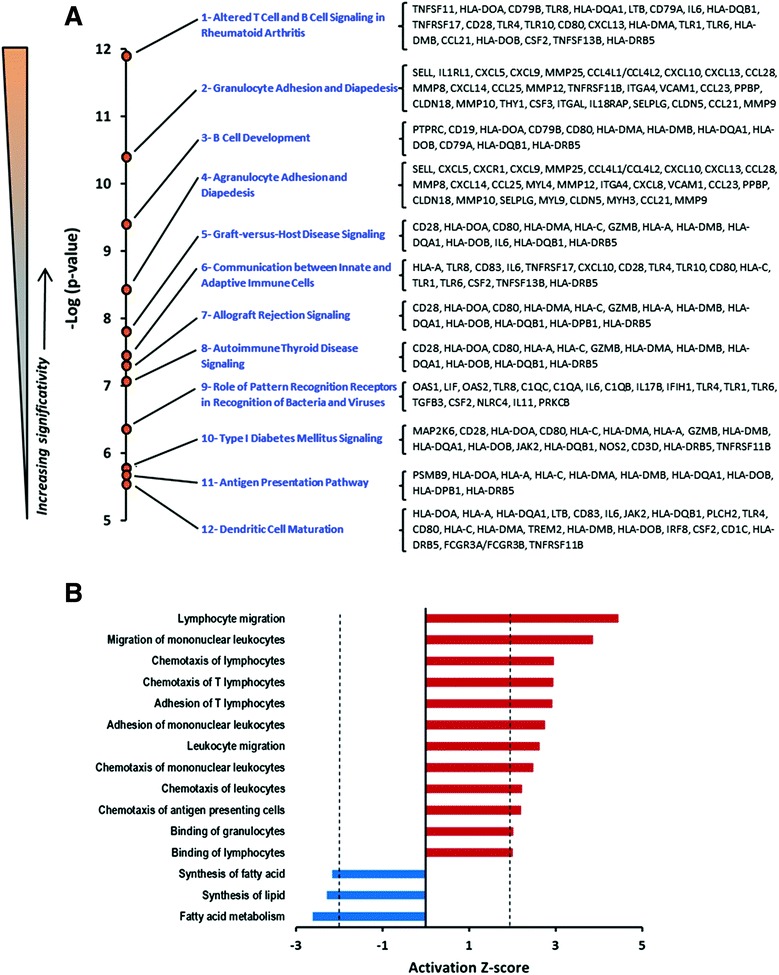
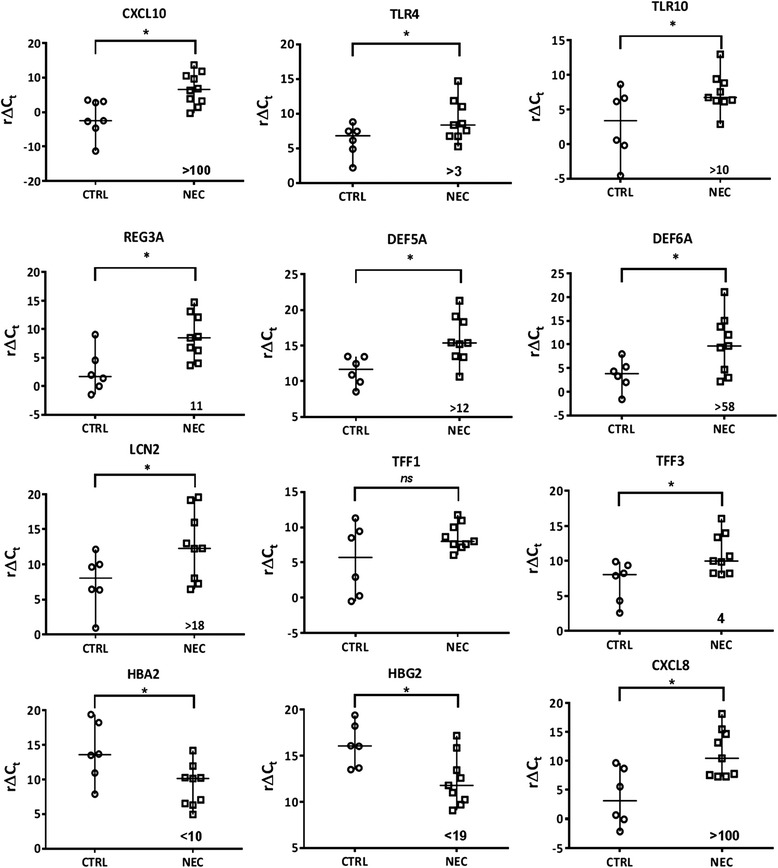
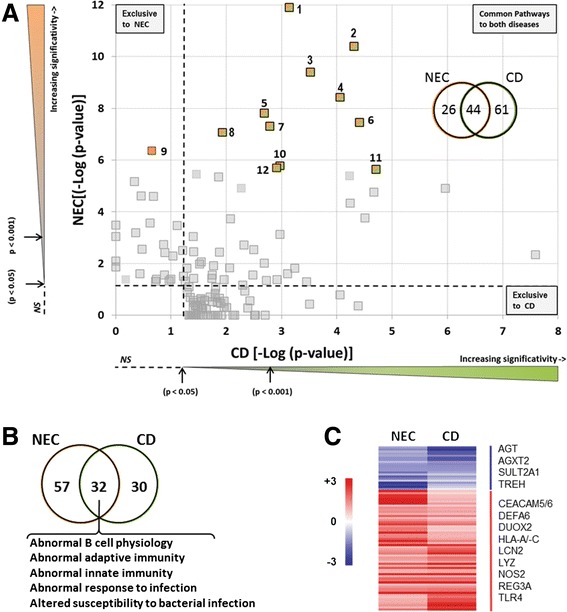
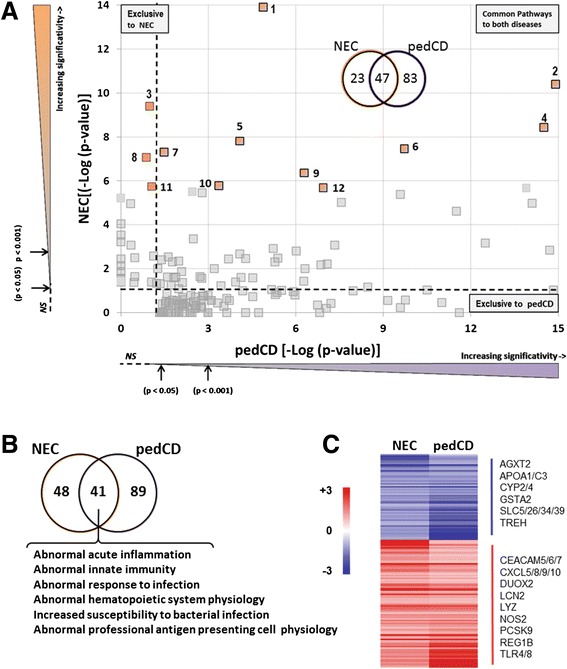
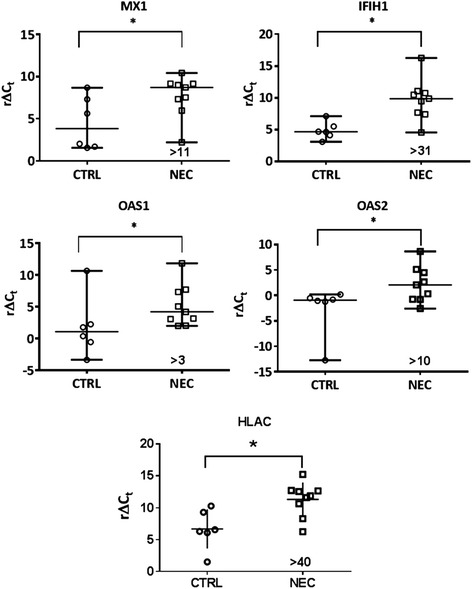
Results: Data analysis indicated that the most significant functional pathways over-represented in NEC neonates were associated with immune functions, such as altered T and B cell signaling, B cell development, and the role of pattern recognition receptors for bacteria and viruses. Among the genes that were strongly modulated in neonates with NEC, we observed a significant degree of similarity when compared with those reported in Crohn's disease, a chronic inflammatory bowel disease.
Conclusions: Gene expression profile analysis revealed a predominantly altered immune response in the intestine of NEC neonates. Moreover, comparative analysis between NEC and Crohn's disease gene expression repertoires revealed a surprisingly high degree of similarity between these two conditions suggesting a new avenue for identifying NEC biomarkers.
Figures
Similar articles
-
IL-17-related signature genes linked to human necrotizing enterocolitis.BMC Res Notes. 2021 Mar 4;14(1):82. doi: 10.1186/s13104-021-05489-9. BMC Res Notes. 2021. PMID: 33663574 Free PMC article.
-
Identification of Inflammatory Genes, Pathways, and Immune Cells in Necrotizing Enterocolitis of Preterm Infant by Bioinformatics Approaches.Biomed Res Int. 2021 Apr 6;2021:5568724. doi: 10.1155/2021/5568724. eCollection 2021. Biomed Res Int. 2021. PMID: 33880370 Free PMC article.
-
Clostridium butyricum Strains and Dysbiosis Linked to Necrotizing Enterocolitis in Preterm Neonates.Clin Infect Dis. 2015 Oct 1;61(7):1107-15. doi: 10.1093/cid/civ468. Epub 2015 Jun 17. Clin Infect Dis. 2015. PMID: 26084844
-
Probiotics for prevention of necrotizing enterocolitis in preterm infants.Evid Based Child Health. 2014 Sep;9(3):584-671. doi: 10.1002/ebch.1976. Evid Based Child Health. 2014. PMID: 25236307 Review.
-
Understanding the susceptibility of the premature infant to necrotizing enterocolitis (NEC).Pediatr Res. 2008 Feb;63(2):117-23. doi: 10.1203/PDR.0b013e31815ed64c. Pediatr Res. 2008. PMID: 18091350 Review.
Cited by
-
IL-17-related signature genes linked to human necrotizing enterocolitis.BMC Res Notes. 2021 Mar 4;14(1):82. doi: 10.1186/s13104-021-05489-9. BMC Res Notes. 2021. PMID: 33663574 Free PMC article.
-
Role of innate T cells in necrotizing enterocolitis.Front Immunol. 2024 Feb 8;15:1357483. doi: 10.3389/fimmu.2024.1357483. eCollection 2024. Front Immunol. 2024. PMID: 38390341 Free PMC article. Review.
-
Identification of Inflammatory Genes, Pathways, and Immune Cells in Necrotizing Enterocolitis of Preterm Infant by Bioinformatics Approaches.Biomed Res Int. 2021 Apr 6;2021:5568724. doi: 10.1155/2021/5568724. eCollection 2021. Biomed Res Int. 2021. PMID: 33880370 Free PMC article.
-
Extracellular Nicotinamide Phosphoribosyltransferase Is a Therapeutic Target in Experimental Necrotizing Enterocolitis.Biomedicines. 2024 Apr 28;12(5):970. doi: 10.3390/biomedicines12050970. Biomedicines. 2024. PMID: 38790933 Free PMC article.
-
Characterization of the pathoimmunology of necrotizing enterocolitis reveals novel therapeutic opportunities.Nat Commun. 2020 Nov 13;11(1):5794. doi: 10.1038/s41467-020-19400-w. Nat Commun. 2020. PMID: 33188181 Free PMC article.
References
Publication types
MeSH terms
Substances
Grants and funding
LinkOut - more resources
Full Text Sources
Other Literature Sources
Medical
Molecular Biology Databases
Research Materials
