

The identification of additional zebrafish DICP genes reveals haplotype variation and linkage to MHC class I genes
- PMID: 26801775
- PMCID: PMC7188334
- DOI: 10.1007/s00251-016-0901-6
The identification of additional zebrafish DICP genes reveals haplotype variation and linkage to MHC class I genes
Abstract
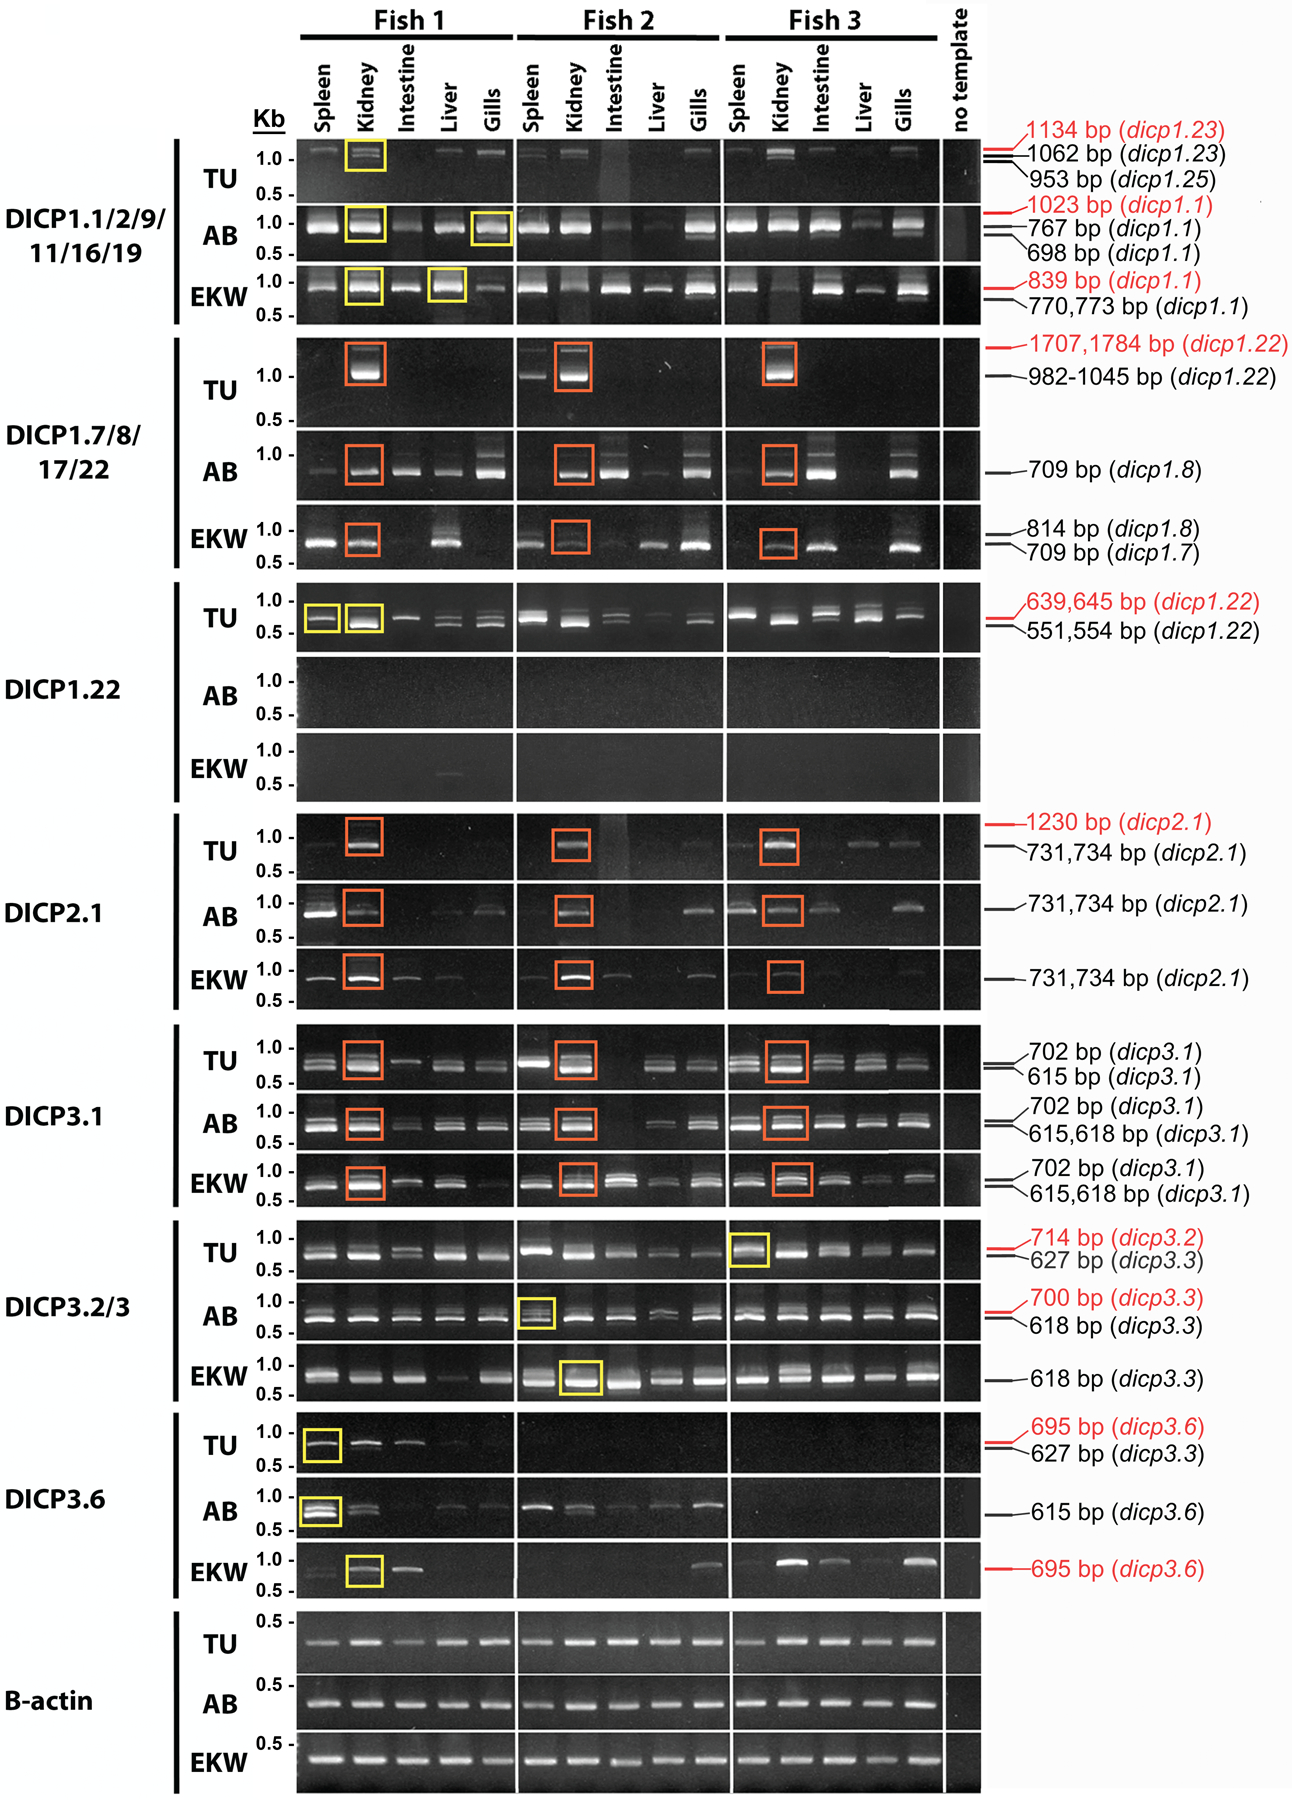
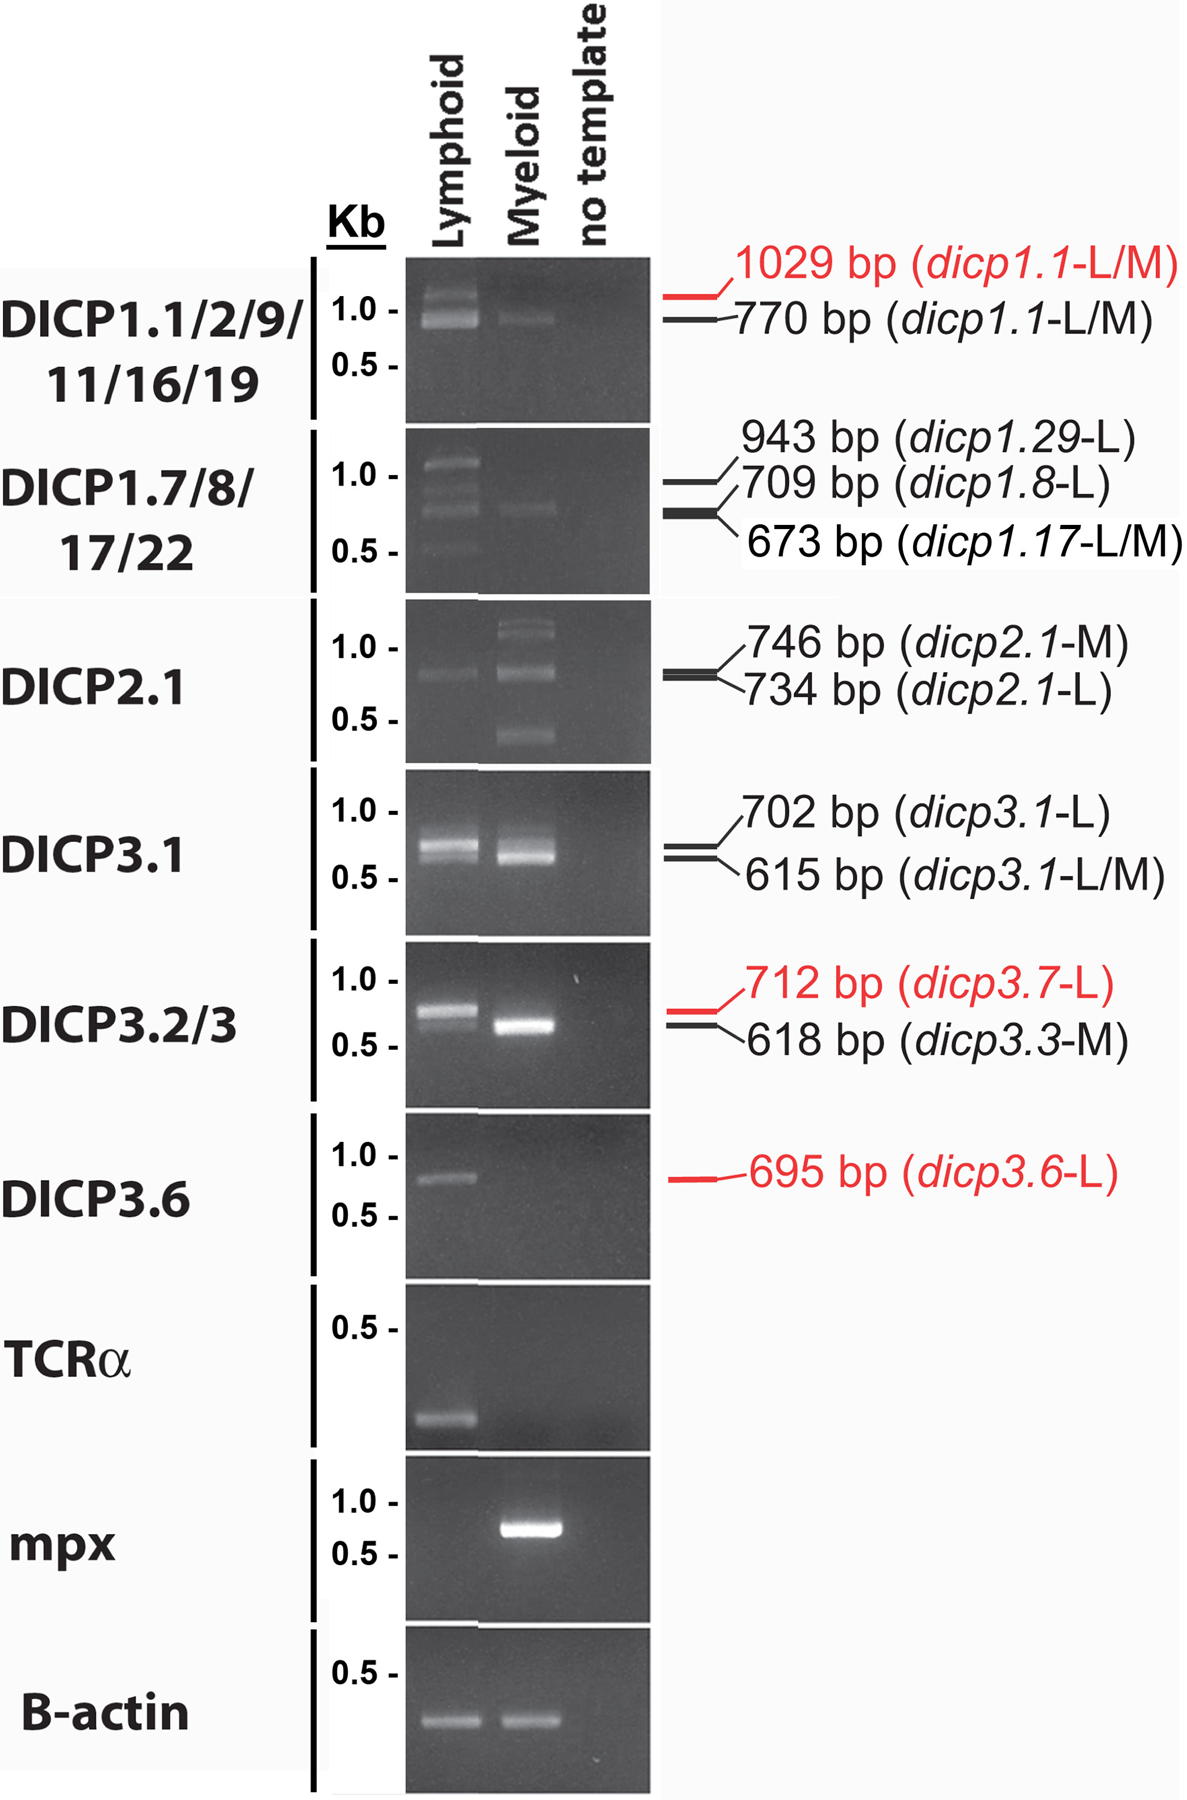
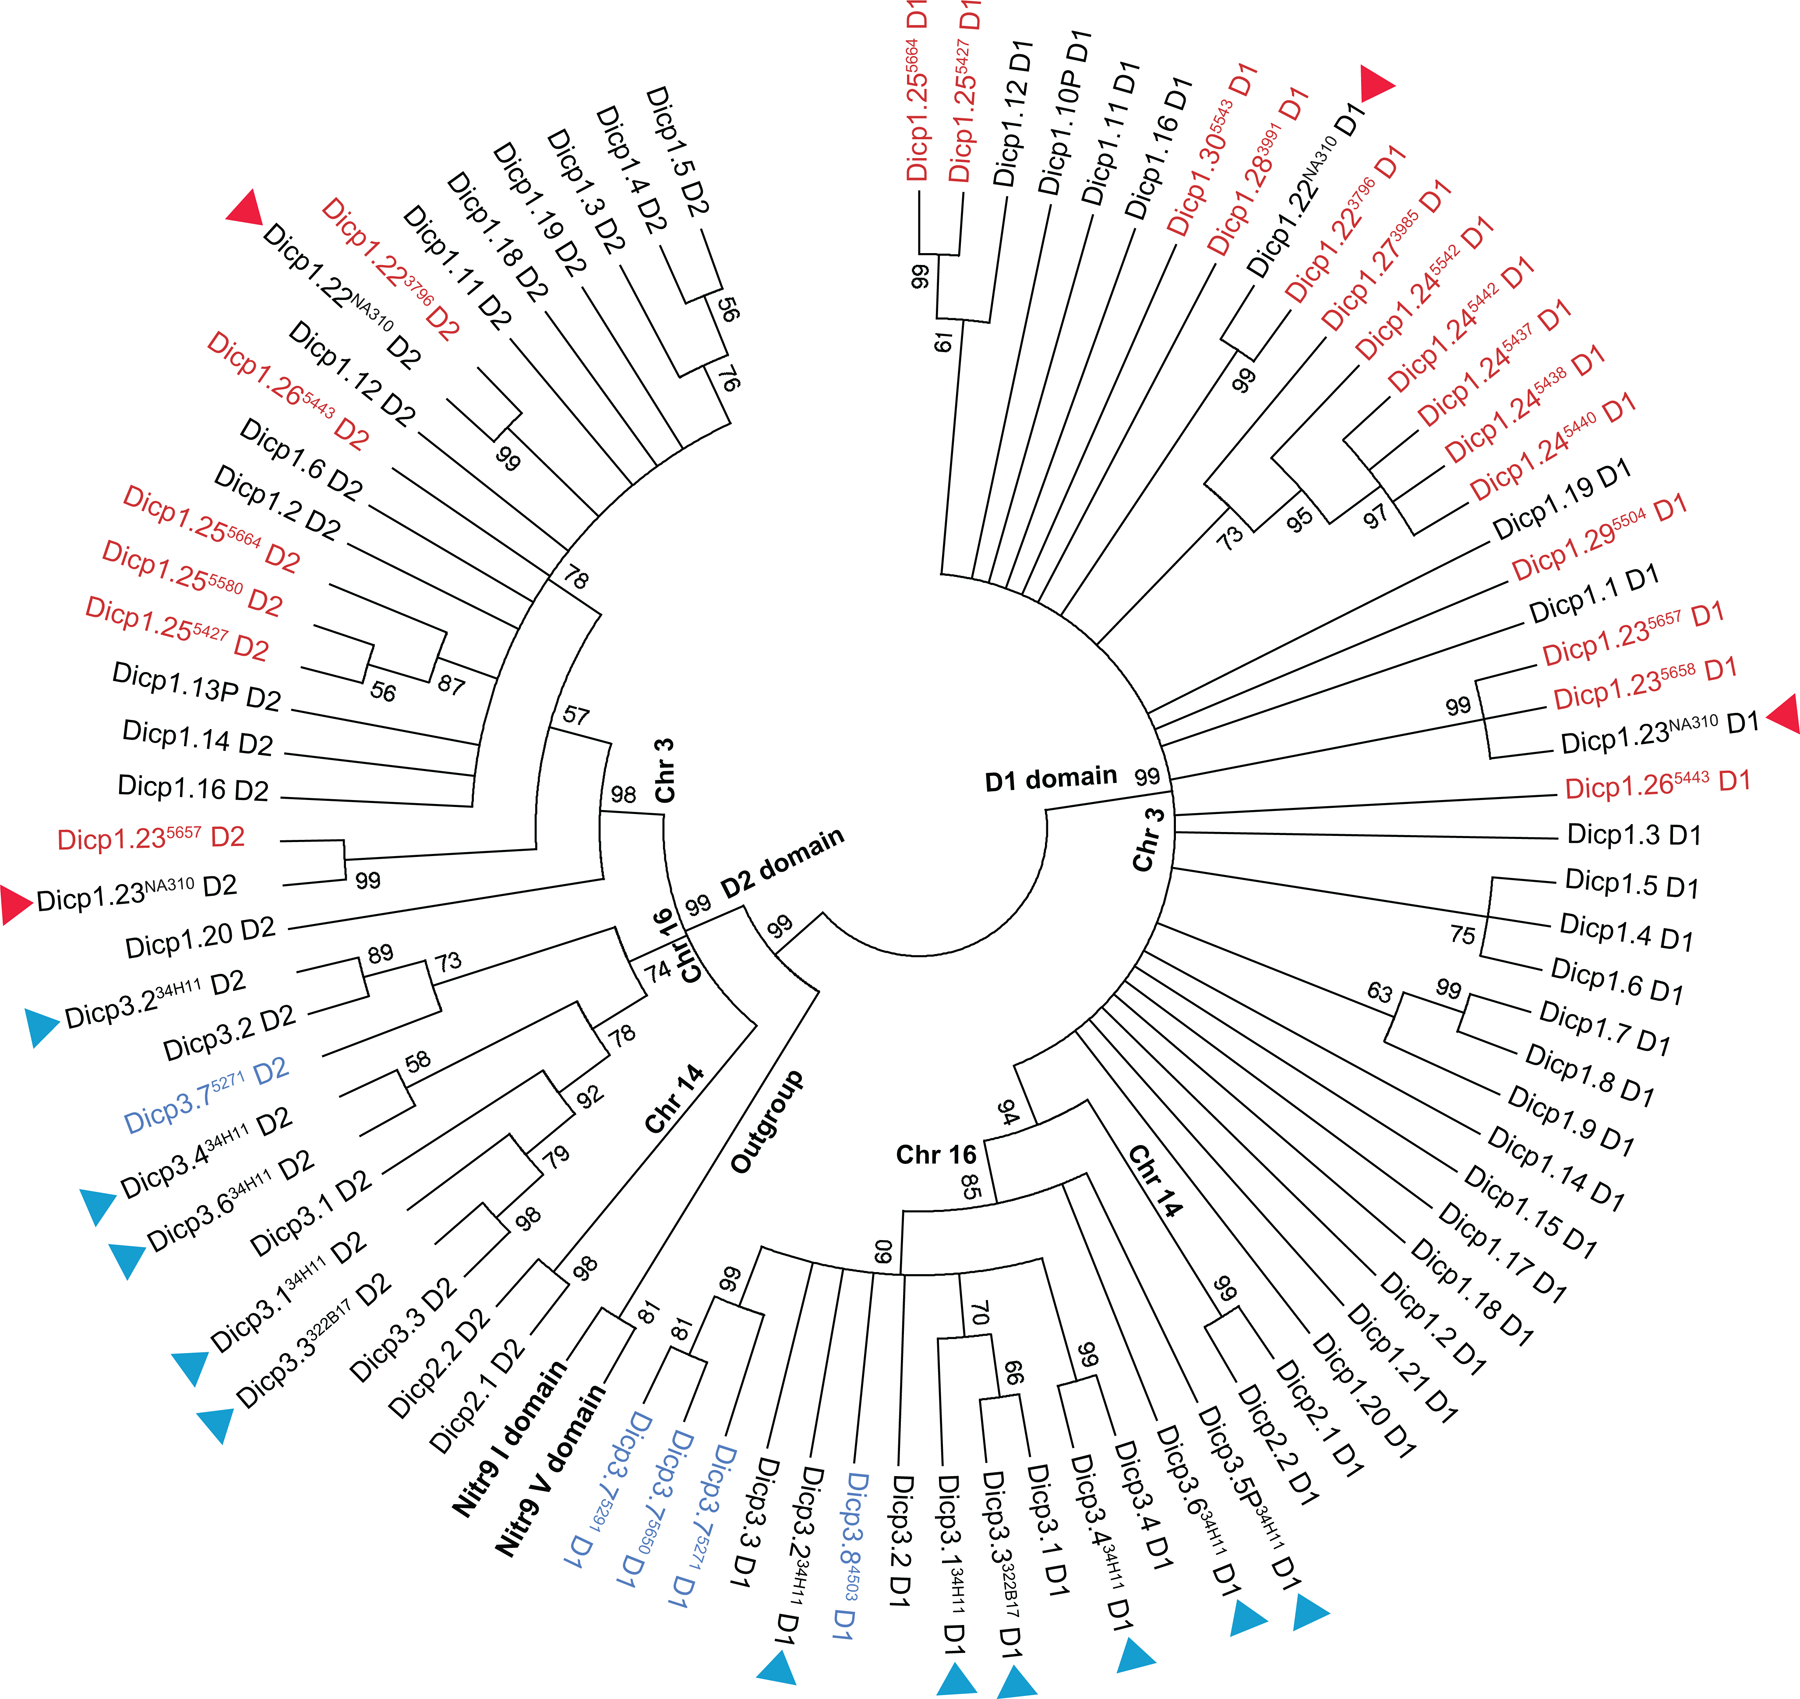
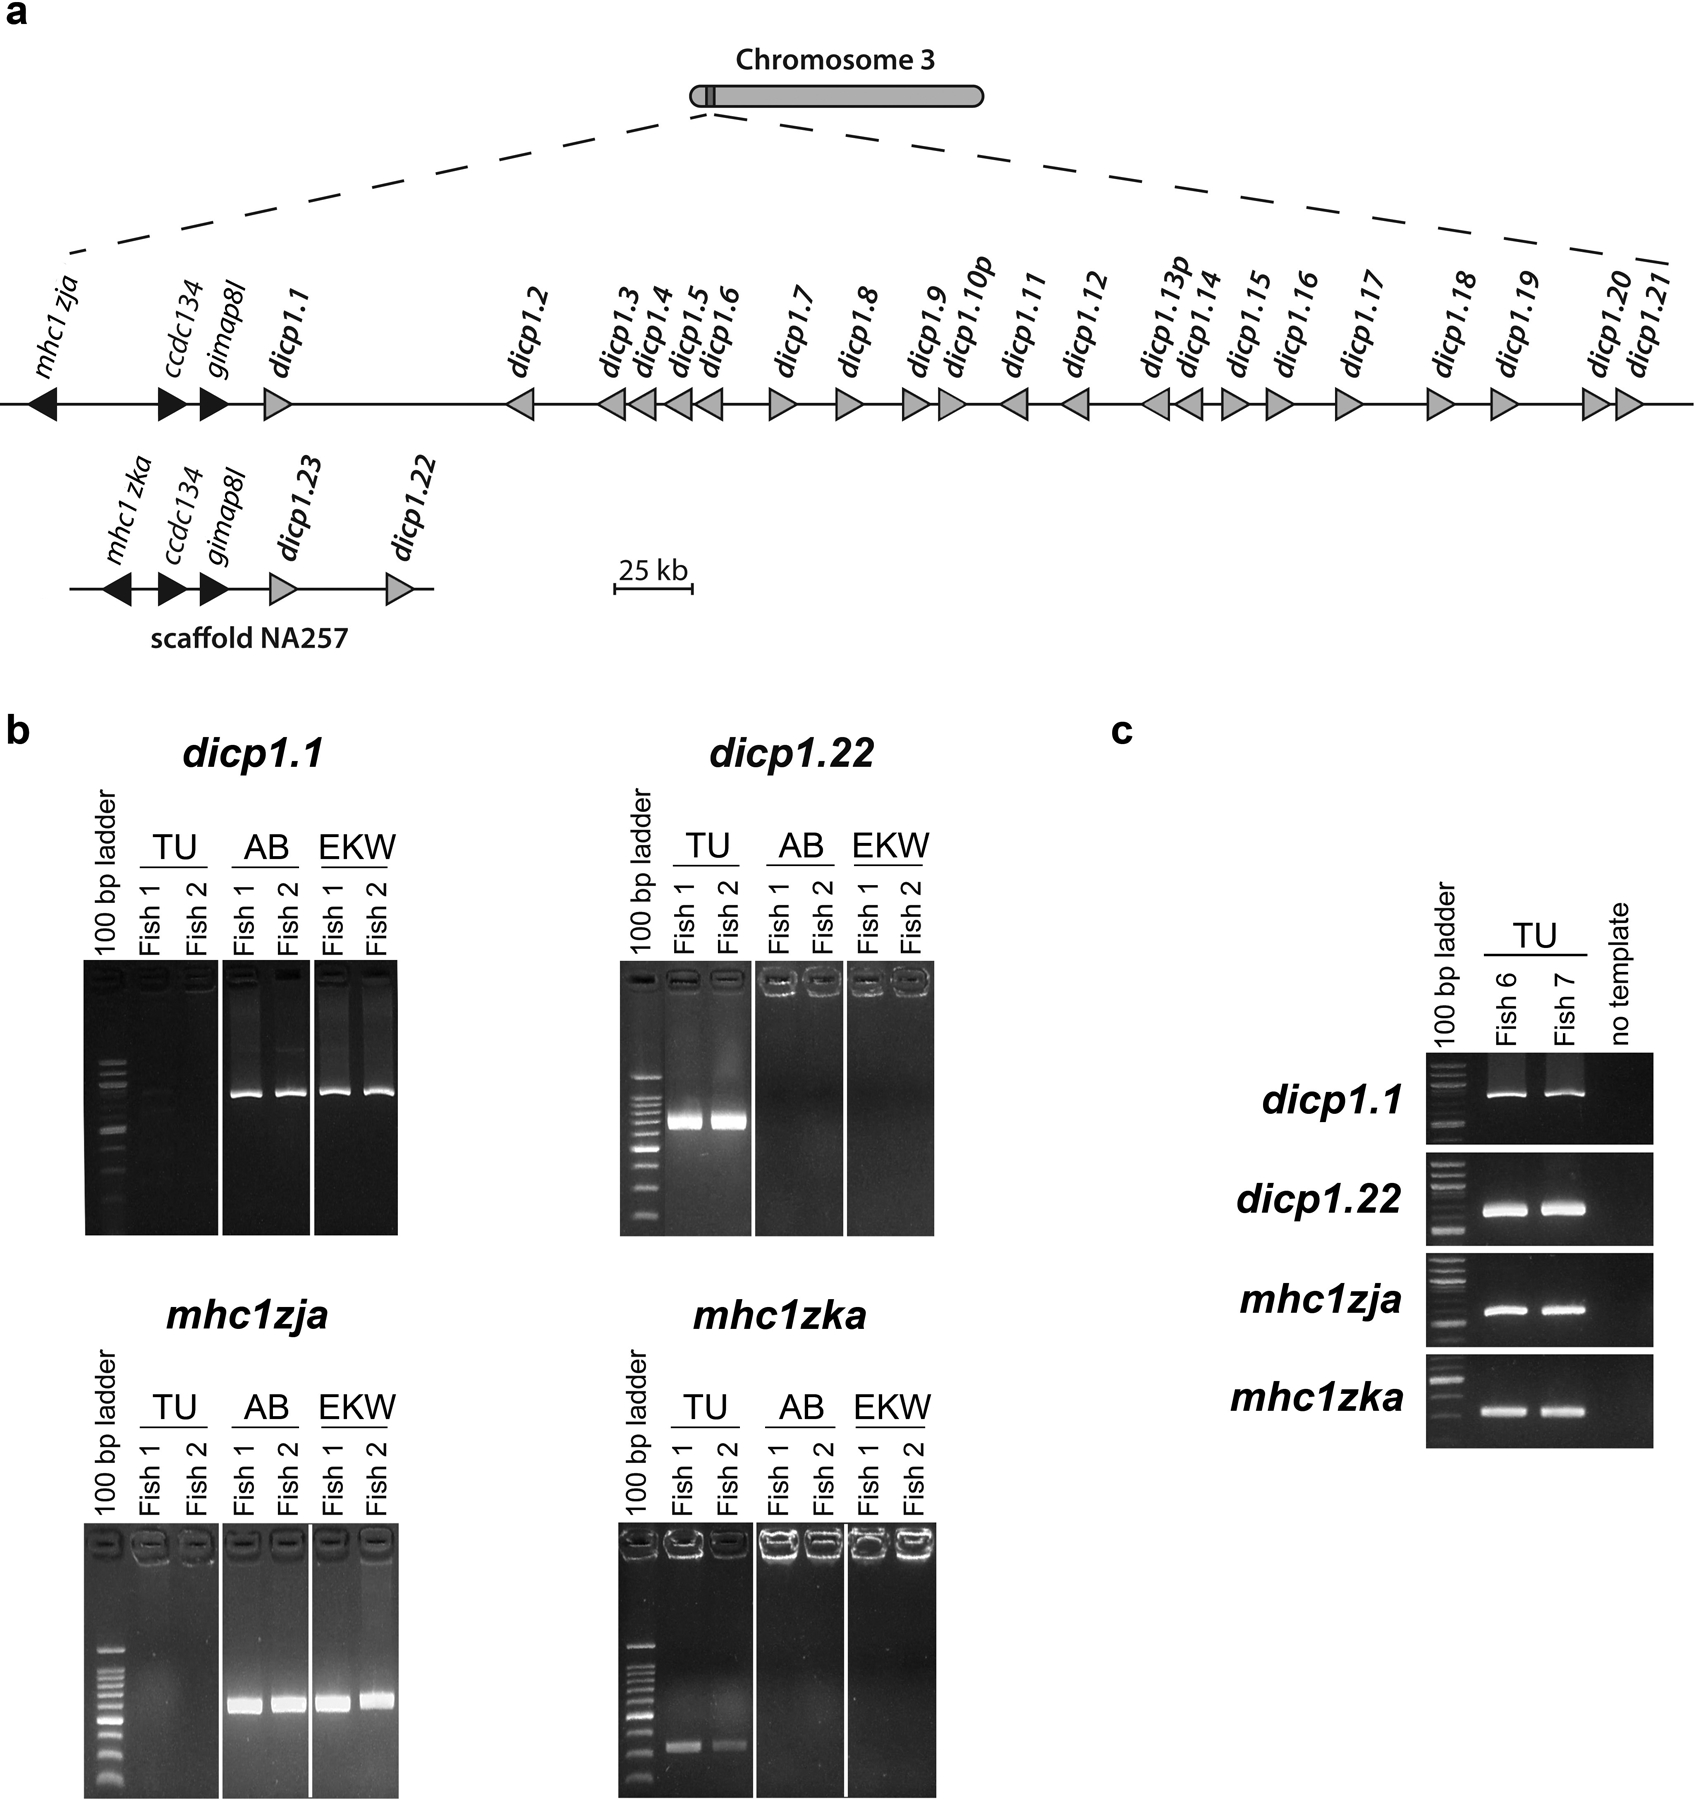
Bony fish encode multiple multi-gene families of membrane receptors that are comprised of immunoglobulin (Ig) domains and are predicted to function in innate immunity. One of these families, the diverse immunoglobulin (Ig) domain-containing protein (DICP) genes, maps to three chromosomal loci in zebrafish. Most DICPs possess one or two Ig ectodomains and include membrane-bound and secreted forms. Membrane-bound DICPs include putative inhibitory and activating receptors. Recombinant DICP Ig domains bind lipids with varying specificity, a characteristic shared with mammalian CD300 and TREM family members. Numerous DICP transcripts amplified from different lines of zebrafish did not match the zebrafish reference genome sequence suggesting polymorphic and haplotypic variation. The expression of DICPs in three different lines of zebrafish has been characterized employing PCR-based strategies. Certain DICPs exhibit restricted expression in adult tissues whereas others are expressed ubiquitously. Transcripts of a subset of DICPs can be detected during embryonic development suggesting roles in embryonic immunity or other developmental processes. Transcripts representing 11 previously uncharacterized DICP sequences were identified. The assignment of two of these sequences to an unplaced genomic scaffold resulted in the identification of an alternative DICP haplotype that is linked to a MHC class I Z lineage haplotype on zebrafish chromosome 3. The linkage of DICP and MHC class I genes also is observable in the genomes of the related grass carp (Ctenopharyngodon idellus) and common carp (Cyprinus carpio) suggesting that this is a shared character with the last common Cyprinidae ancestor.
Keywords: Haplotype; Immune receptor; Immunoglobulin domain; Innate immunity; Polymorphism.
Figures


Similar articles
-
A highly diverse set of novel immunoglobulin-like transcript (NILT) genes in zebrafish indicates a wide range of functions with complex relationships to mammalian receptors.Immunogenetics. 2023 Feb;75(1):53-69. doi: 10.1007/s00251-022-01270-9. Epub 2022 Jul 23. Immunogenetics. 2023. PMID: 35869336 Free PMC article.
-
Genomic and functional characterization of the diverse immunoglobulin domain-containing protein (DICP) family.Genomics. 2012 May;99(5):282-91. doi: 10.1016/j.ygeno.2012.02.004. Epub 2012 Feb 21. Genomics. 2012. PMID: 22386706 Free PMC article.
-
A novel functional class I lineage in zebrafish (Danio rerio), carp (Cyprinus carpio), and large barbus (Barbus intermedius) showing an unusual conservation of the peptide binding domains.J Immunol. 2002 Aug 15;169(4):1936-47. doi: 10.4049/jimmunol.169.4.1936. J Immunol. 2002. PMID: 12165519
-
Multigene families of immunoglobulin domain-containing innate immune receptors in zebrafish: deciphering the differences.Dev Comp Immunol. 2014 Sep;46(1):24-34. doi: 10.1016/j.dci.2014.02.004. Epub 2014 Feb 15. Dev Comp Immunol. 2014. PMID: 24548770 Free PMC article. Review.
-
The MHC class I genes of zebrafish.Dev Comp Immunol. 2014 Sep;46(1):11-23. doi: 10.1016/j.dci.2014.02.018. Epub 2014 Mar 11. Dev Comp Immunol. 2014. PMID: 24631581 Free PMC article. Review.
Cited by
-
Holosteans contextualize the role of the teleost genome duplication in promoting the rise of evolutionary novelties in the ray-finned fish innate immune system.Immunogenetics. 2021 Dec;73(6):479-497. doi: 10.1007/s00251-021-01225-6. Epub 2021 Sep 11. Immunogenetics. 2021. PMID: 34510270 Free PMC article.
-
Spotted Gar and the Evolution of Innate Immune Receptors.J Exp Zool B Mol Dev Evol. 2017 Nov;328(7):666-684. doi: 10.1002/jez.b.22738. Epub 2017 May 24. J Exp Zool B Mol Dev Evol. 2017. PMID: 28544607 Free PMC article.
-
A highly diverse set of novel immunoglobulin-like transcript (NILT) genes in zebrafish indicates a wide range of functions with complex relationships to mammalian receptors.Immunogenetics. 2023 Feb;75(1):53-69. doi: 10.1007/s00251-022-01270-9. Epub 2022 Jul 23. Immunogenetics. 2023. PMID: 35869336 Free PMC article.
-
Direct male development in chromosomally ZZ zebrafish.Front Cell Dev Biol. 2024 Mar 11;12:1362228. doi: 10.3389/fcell.2024.1362228. eCollection 2024. Front Cell Dev Biol. 2024. PMID: 38529407 Free PMC article.
References
Publication types
MeSH terms
Substances
Grants and funding
LinkOut - more resources
Full Text Sources
Other Literature Sources
Molecular Biology Databases
Research Materials
