. 2016 Apr;37(4):1321-34.
doi: 10.1002/hbm.23105. Epub 2016 Jan 23.

The superficial white matter in Alzheimer's disease

Affiliations

The superficial white matter in Alzheimer's disease

Owen R Phillips et al. Hum Brain Mapp. 2016 Apr.

Abstract

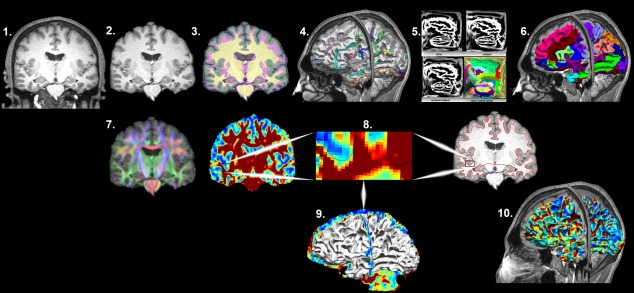
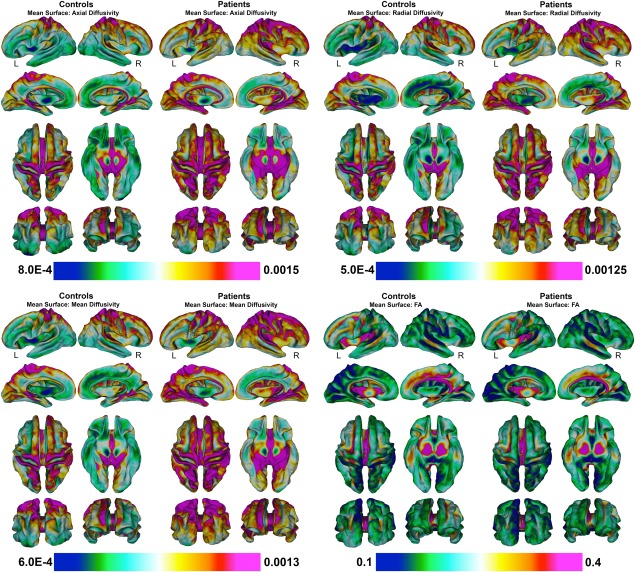
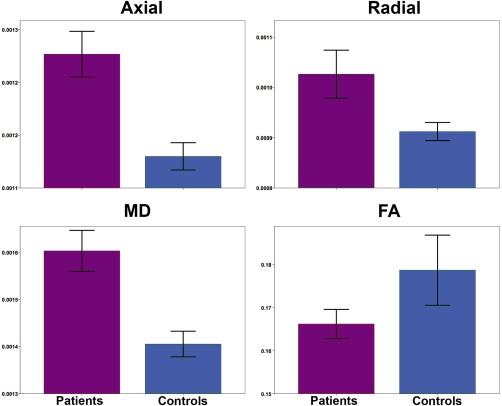
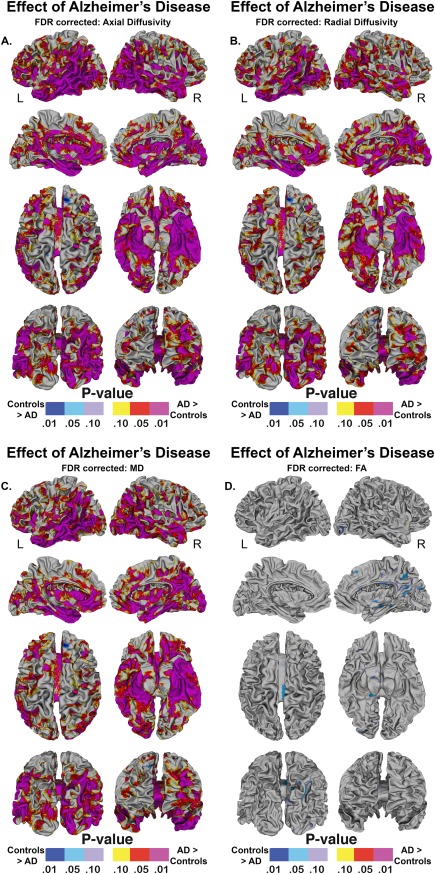
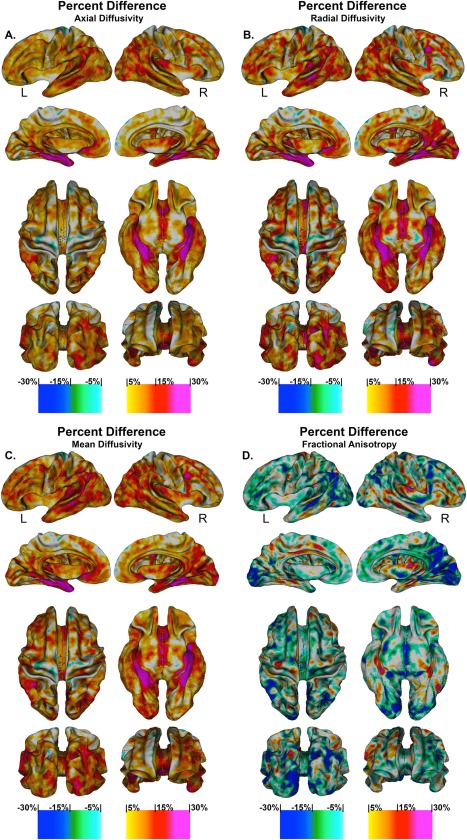
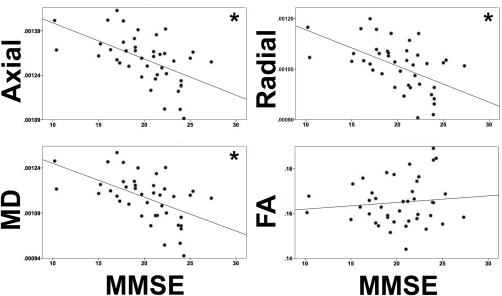
White matter abnormalities have been shown in the large deep fibers of Alzheimer's disease patients. However, the late myelinating superficial white matter comprised of intracortical myelin and short-range association fibers has not received much attention. To investigate this area, we extracted a surface corresponding to the superficial white matter beneath the cortex and then applied a cortical pattern-matching approach which allowed us to register and subsequently sample diffusivity along thousands of points at the interface between the gray matter and white matter in 44 patients with Alzheimer's disease (Age: 71.02 ± 5.84, 16M/28F) and 47 healthy controls (Age 69.23 ± 4.45, 19M/28F). In patients we found an overall increase in the axial and radial diffusivity across most of the superficial white matter (P < 0.001) with increases in diffusivity of more than 20% in the bilateral parahippocampal regions and the temporal and frontal lobes. Furthermore, diffusivity correlated with the cognitive deficits measured by the Mini-Mental State Examination scores (P < 0.001). The superficial white matter has a unique microstructure and is critical for the integration of multimodal information during brain maturation and aging. Here we show that there are major abnormalities in patients and the deterioration of these fibers relates to clinical symptoms in Alzheimer's disease.

Keywords: DTI; U-fibers; diffusion; interstitial neurons; intracortical myelin; neurodegeneration; oligodendrocytes; short-range association fibers; white matter.


Figures

Figure 1
Figure 1
Mapping the superficial white matter. Processing steps in order to map the superficial white matter. 1. Original T1 structural image. 2. Bias field correction and skull stripping. 3. Tissue classification. 4. Surface extraction and sulcal line drawing. 5. Spatial alignment to the atlas. 6. Region of Interest surface labeling. 7. Distortion correction and co‐registration of the diffusion image to the structural MRI image. 8. FA and T1 images with zoom to show the surface boundary. 9. Superficial white matter spatially aligned surface and the FA image allows sampling of diffusivity values at each vertex of the surface. 10. Superficial white matter spatially aligned surface with FA estimated at each vertex. FA = fractional anisotropy.
Figure 2
Figure 2
Mean superficial white matter for patients and controls mapped at high‐spatial resolution at thousands of homologous locations within the superficial white matter. Colorbars indicate the diffusivity value at each vertex of the superficial white matter. Red to purple color indicates higher diffusivity or FA while green to blue color indicates lower diffusivity or lower FA. Legend. MD = mean diffusivity; FA = fractional anisotropy. (Axial/Radial/MD Mean units: 10 − 3 mm2/s).
Figure 3
Figure 3
Bar graphs for average superficial white matter for patients and controls. Bar graphs show significant differences between averagel superficial white matter axial, radial, mean diffusivity and FA. The error bars represent the standard error mean (SEM). Legend. Axial = axial diffusivity; Radial = radial diffusivity; MD = mean diffusivity; FA = fractional anisotropy (Axial/Radial/MD Mean units: 10 − 3 mm2/s).
Figure 4
Figure 4
Vertex‐based superficial white matter findings. Probability maps showing effects of Alzheimer's disease on the superficial white matter controlling for age and gender, p values are FDR corrected. Legend. AD = Alzheimer's Disease. R = right. L = left. mapped at high‐spatial resolution at thousands of homologous locations within the superficial white matter. The direction of effects are indicated by the color bar. For (A–C), red indicates increased diffusivity with disease and blue indicates reduced diffusivity with disease. For (D), blue indicates lower fractional anisotropy with disease and red indicated higher fractional anisotropy with disease. p values are FDR corrected. Legend. AD = Alzheimer's disease. FDR = False Discovery Rate correction.
Figure 5
Figure 5
Percentage change in superficial white matter diffusivity. High‐resolution vertex based percentage change maps show the change between Controls and Alzheimer's disease patient's superficial white matter axial diffusivity at high spatial density. Red colours indicate the percentage diffusivity increased with disease while the blue colours indicated the percentage diffusivity decreased with disease. Legend. R = right. L = left.
Figure 6
Figure 6
MMSE and whole brain diffusivity correlations. Legend. MMSE = Mini Mental State Examination FA = Fractional Anisotropy; Axial = Axial Diffusivity; Radial = Radial Diffusivity. MD = Mean Diffusivity. (Axial/Radial/MD Mean units: 10 − 3 mm2/s) * Indicates a significant correlation between MMSE and diffusivity parameters.

Similar articles

Cited by

References

    1. Amlien IK, Fjell AM (2014): Diffusion tensor imaging of white matter degeneration in Alzheimer's disease and mild cognitive impairment. Neuroscience 276C:206–215. - PubMed
    1. Bartzokis G (2004): Age‐related myelin breakdown: A developmental model of cognitive decline and Alzheimer's disease. Neurobiol Aging 25:5–62. - PubMed
    1. Benner T, van der Kouwe AJW, Sorensen AG (2011): Diffusion imaging with prospective motion correction and reacquisition. Magn Reson Med 66:154–167. - PMC - PubMed
    1. Bhushan C, Haldar JP, Choi S, Joshi AA, Shattuck DW, Leahy RM (2015): Co‐registration and distortion correction of diffusion and anatomical images based on inverse contrast normalization. Neuroimage 115:269–280. - PMC - PubMed
    1. Braak H, Braak E (1990): Neurofibrillary changes confined to the entorhinal region and an abundance of cortical amyloid in cases of presenile and senile dementia. Acta Neuropathol 80:479–486. - PubMed

Publication types