. 2016 May;148(1):40-55.
doi: 10.1111/imm.12586. Epub 2016 Mar 8.

CTLA4Fcε, a novel soluble fusion protein that binds B7 molecules and the IgE receptors, and reduces human in vitro soluble CD23 production and lymphocyte proliferation

Affiliations

CTLA4Fcε, a novel soluble fusion protein that binds B7 molecules and the IgE receptors, and reduces human in vitro soluble CD23 production and lymphocyte proliferation

Daniel Perez-Witzke et al. Immunology. 2016 May.

Abstract

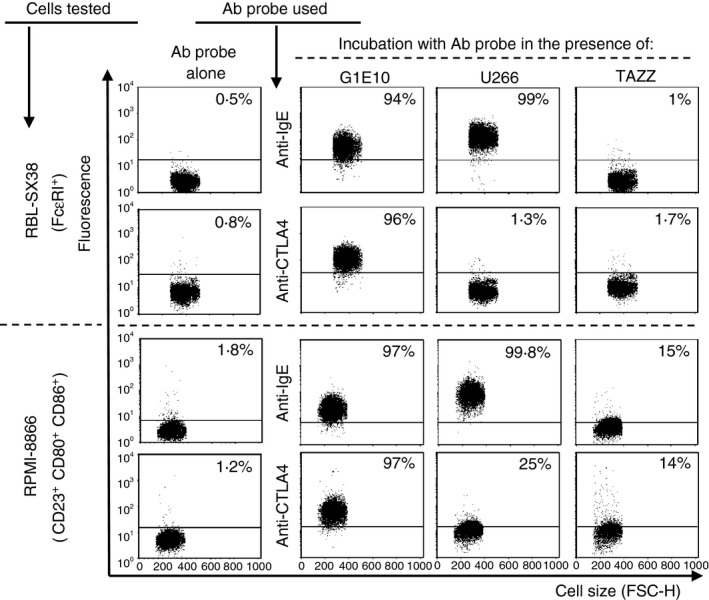
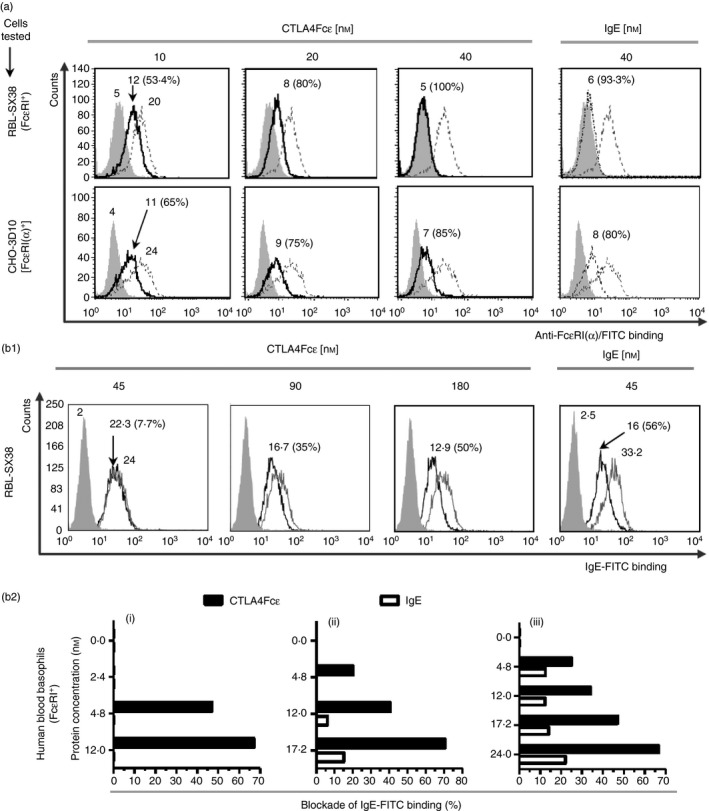
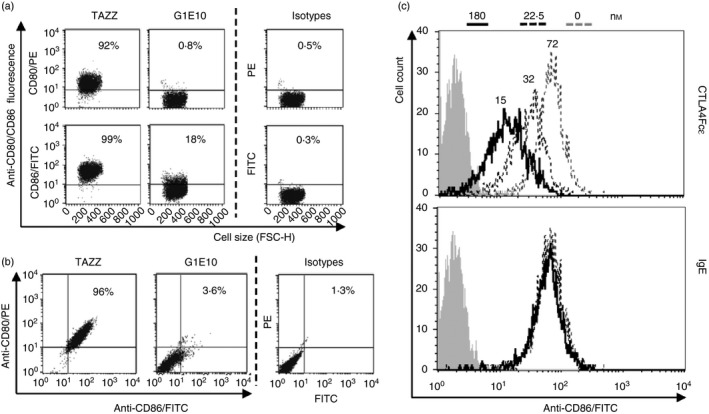
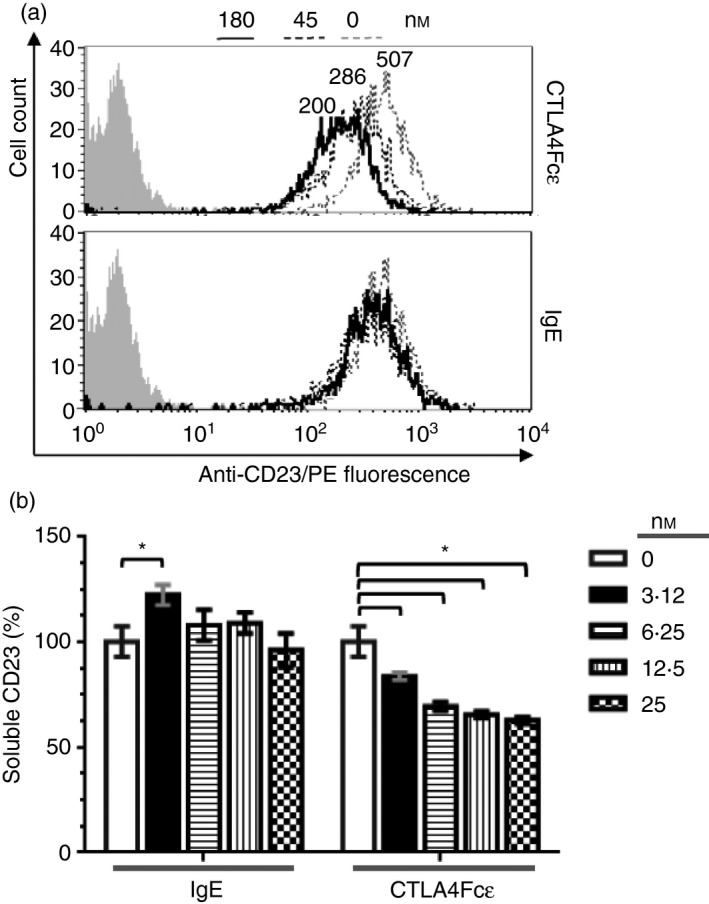
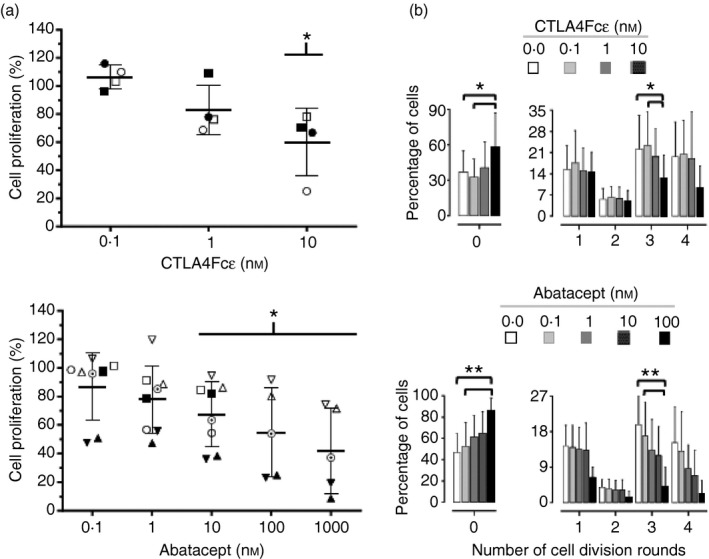
Immunoglobulin E-mediated allergy and certain autoimmune diseases are characterized by the presence of a T helper type 2 (Th2) immune response and allergen-specific or self-reactive IgE. Soluble CD23 (sCD23) is a B-cell factor that fosters IgE class-switching and synthesis, suggesting that sCD23 may be a therapeutic target for these pathologies. We produced a recombinant protein, CTLA4Fcε, by fusing the ectodomain of the immunoregulatory molecule cytotoxic T-lymphocyte antigen 4 (CTLA-4) with a fragment of the IgE H-chain constant region. In SDS-PAGE/inmunoblot analyses, CTLA4Fcε appeared as a 70,000 MW polypeptide that forms homodimers. Flow cytometry showed that CTLA4Fcε binds to IgE receptors FcεRI and FcεRII/CD23, as well as to CTLA-4 counter-receptors CD80 and CD86. Binding of CTLA4Fcε to FcεRII/CD23 appeared stronger than that of IgE. Since the cells used to study CD23 binding express CD80 and CD86, simultaneous binding of CTLA4Fcε to CD23 and CD80/CD86 seems to occur and would explain this difference. As measured by a human CD23-specific ELISA, CTLA4Fcε - but not IgE - induced a concentration-dependent reduction of sCD23 in culture supernatants of RPMI-8866 cells. Our results suggest that the simultaneous binding of CTLA4Fcɛ to CD23-CD80/CD86 may cause the formation of multi-molecular complexes that are either internalized or pose a steric hindrance to enzymatic proteolysis, so blocking sCD23 generation. CTLA4Fcε caused a concentration-dependent reduction of lymphocyte proliferation in human peripheral blood mononuclear cell samples stimulated in vitro with concanavalin A. The ability to bind IgE receptors on effector cells, to regulate the production of sCD23 and to inhibit lymphocyte proliferation suggests that CTLA4Fcɛ has immunomodulatory properties on human Th2 responses.

Keywords: CD23; CTLA-4; IgE; T helper type 2 response; fusion protein.


Figures

Figure 1
Figure 1
Recombinant CTLA4Fcε: DNA construction, expression, and protein structure characterization. (a) Cloning of the human immunoglobulin ε heavy (H) chain. Using total RNA from U266 cells, a ~1·3‐kb amplicon, putatively encoding the constant part (from Cε1 to Cε4) of the ε H chain, was cloned by RTPCR and identified by agarose gel electrophoresis and ethidium bromide staining (AGEEB). Subsequent DNA sequencing confirmed the amplicon identity as human Cε1–Cε4. (b) Using a recombinant PCR strategy, the DNA encoding the extracellular portion of mouse CTLA‐4 (EcCTLA4) was fused to the Cε2–Cε4 DNA through a pentapeptide linker‐coding sequence. The PCR product of the expected size (~1·47 kb) was identified by AGEEB. (c) The EcCTLA4Fcε DNA construct was inserted into an expression vector to generate the plasmid pAZ‐Ec‐CTLA4Fcε. The expected amino acid sequence at the CTLA4/Fcε junction is shown in one‐letter code. (d) After CTLA4Fcε expression, protein from a select transfectant (G1E10) was analysed by SDSPAGE/Coomassie blue staining under non‐reducing (NR) and reducing (R) conditions. (e, f) CTLA4Fcε identity was confirmed by Western blot analyses. In (e), culture supernatants from transfectoma G1E10 and myeloma U266 were probed with anti‐IgE. In (f), purified CTLA4Fcε was probed with anti‐IgE (left and centre) whereas purified IgG1, probed with anti‐IgG1 (right), was used as a control. MSM, molecular size marker; bp, base pair; Ampr, Ampicillin resistance gene; Zeor, Zeocin resistance gene; pCMV, cytomegalovirus enhancer/promoter region; BGHpA, bovine growth hormone poly‐adenylation signal; OMsp, Oncostatin M signal peptide sequence; XhoI and BamHI: endonuclease restriction enzyme sites used for EcCTLA4Fcε cloning.
Figure 2
Figure 2
CTLA4Fcε binds to cells displaying CTLA‐4 counter‐receptors and Fcε receptors. Human Fcε RI + RBLSX38 or CD23+ CD80+ CD86+ RPMI‐8866 cells were suspended in culture supernatant harvested from: (i) the cell line used for CTLA4Fcε DNA expression (TAZZ), (ii) the transfectoma producing CTLA4Fcε (G1E10), or (iii) a human IgE‐producing cell line (U266), in the presence of phycoerythrin (PE) ‐labelled anti‐human IgE or anti‐mouse CTLA‐4. Samples were analysed by flow cytometry and results are shown as representative dot plots of cell size (FCS‐H) versus signal in the relevant fluorescence channel. Binding of CTLA4Fcε (or IgE) was estimated as the change in fluorescence intensity (FI) of events analysed under each experimental condition compared with the basal FI value offered by a sample incubated with the antibody probe alone. This change was expressed as a percentage of positive events (inset values in each dot plot) defined as those found above an arbitrary cut‐off line. The results shown come from a single experiment and are representative of at least three independent experiments, each performed in duplicate.
Figure 3
Figure 3
CTLA4Fcε binds to Fcε RI. (a) Flow cytometric analysis of Fcε RI + RBLSX38 or Fcε RI α + CHO‐3D10 cells incubated with CTLA4Fcε or IgE at the indicated concentrations, and subsequently stained with an FITC‐labelled anti‐human Fcε RI α monoclonal antibody (mAb) (clone CRA2, which recognizes the IgE‐binding site of Fcε RI). Binding of CTLA4Fcε or IgE to Fcε RI was estimated as the reduction in the anti‐Fcε RI α‐related mean fluorescence intensity (MFI). Grey‐filled histograms show the fluorescence of the sample incubated with the antibody isotype; empty grey‐lined histograms, the fluorescence of the sample incubated with anti‐Fcε RI α/FITC; and empty black‐lined histograms, the fluorescence of the sample incubated with anti‐Fcε RI α/FITC in the presence of CTLA4Fcε or IgE. Inset numbers shown within select histograms are MFI values or percentage of inhibition. (b1) CTLA4Fcε blocks the binding of IgE to Fcε RI on RBLSX38 cells. Cells were incubated in culture media containing IgE/FITC at a fixed concentration (45 nm of IgE), mixed with either CTLA4Fcε at different concentrations or ‘cold’ IgE at a fixed concentration (45 nm). Samples were analysed by flow cytometry and a reduction of the IgE/FITC‐related MFI was assumed to be the result of the occupancy of Fcε RI sites by CTLA4Fcε or ‘cold IgE’. The percentage of inhibition was calculated. Grey‐filled histograms show the autofluorescence of the control sample; empty grey‐lined histograms, the fluorescence of the sample incubated with IgE/FITC; and empty black‐lined histograms, the fluorescence of the sample incubated with IgE/FITC in the presence of CTLA4Fcε or ‘cold’ IgE. Inset numbers represent the same values indicated in (a). The results shown in (a) and (b1) come from a single experiment and are representative of at least three independent experiments, each performed in duplicate. (b2) CTLA4Fcε blocks IgE binding to Fcε RI on human peripheral blood basophils. Blood samples (i, ii, iii) were processed to elute endogenous IgE and treated as outlined in (b1). Basophils present in these samples were hierarchically gated according to their relative size (FSC‐H) versus granularity (SSC‐H), followed by CD203c/Fcε RI expression. Then, they were analysed to determine the IgE/FITC‐related fluorescence, and the percentage of blockade was calculated.
Figure 4
Figure 4
Differential binding of CTLA4Fcε and IgE to RPMI‐8866 cells. (a) Left and middle column histogram series show representative flow cytometric analyses of RPMI‐8866 cells incubated with six different concentrations (from 1·4 to 45 nm) of IgE or CTLA4Fcε, respectively, and subsequently stained with phycoerythrin‐labelled anti‐human IgE (anti‐IgE/PE). The right column histogram series contains data from a similar experience in which RPMI‐8866 cells were pretreated with 200 nm CTLA4‐Ig (to block CD80 and CD86 sites), incubated with CTLA4Fcε, and finally stained with anti‐IgE/PE. Mean fluorescence intensity (MFI) values of the control condition (no protein) and of each protein concentration assayed are included for comparisons (inset numbers shown at the right upper corner of each histogram). Also included for comparisons are values that represent, for each protein concentration assayed, the number of times the CTLA4Fcε‐related MFI was higher than the IgE‐related MFI (inset underlined numbers shown below MFI values in the middle and right column histogram series) The results shown come from a single experiment and are representative of seven independent experiments, each performed in duplicate. (b) RPMI‐8866 cells were stained with fluorescent anti‐human CD80 and anti‐human CD86 in the presence of two different concentrations of CTLA4‐Ig and analysed by flow cytometry. The results shown come from a single experiment and are representative of at least two independent experiments, each performed in duplicate.
Figure 5
Figure 5
CTLA4Fcε binds to B7 molecules. (a) Aliquots of CD23+ CD80+ CD86+ RPMI‐8866 cells were incubated in mixes containing supernatant harvested from TAZZ or G1E10 cell cultures and fluorescent anti‐CD80 or anti‐CD86 blocking monoclonal antibodies (mAbs), and analysed by flow cytometry. Representative dot plots show that the vast majority of cells suspended in TAZZ supernatant were labelled with anti‐CD80 or anti‐CD86 (92% and 99% of the events analysed, respectively). Conversely, the samples suspended in G1E10 supernatant were only marginally labelled (anti‐CD80, 0·8%; anti‐CD86, 18%). (b) Aliquots of RPMI‐8866 cells were treated as indicated in (a), but adding both fluorescent anti‐CD80 and anti‐CD86 reagents to TAZZ and G1E10 supernatants. Samples were analysed by flow cytometry and results are shown in representative dot plots. Incubation of the cells under these conditions led to an almost complete reduction of the CD80‐ and CD86‐specific labelling in the case of the supernatant G1E10. (c) Overlaid histograms show representative flow cytometric analysis of samples of RPMI‐8866 cells incubated with anti‐human CD86/FITC mixed with two different concentrations (as indicated in the legend at the top of the figure) of purified CTLA4Fcε or IgE. CTLA4Fcε, but not IgE, was able to reduce anti‐CD86/FITC‐related fluorescence in a concentration‐dependent manner. Inset numbers in the top histogram are mean fluorescence intensity (MFI) values obtained for each condition tested. The results shown in (a) and (b) come from a single experiment and are representative of three independent experiments, each performed in duplicate.
Figure 6
Figure 6
CTLA4Fcε and IgE bind to CD23 differently and CTLA4Fcε reduces sCD23 release from the cell membrane. (a) Binding of CTLA4Fcε and IgE to CD23 was studied using the CD23+ CD80+ CD86+ human B‐lymphoblastoid cell line RPMI‐8866. A fluorescent anti‐CD23 probe [phycoerythrin‐labelled anti‐CD23 (anti‐CD23/PE] that binds to the IgE‐binding site of CD23 was used to stain aliquots of 5 × 10⁴ cells in the presence of CTLA4Fcε or IgE at the indicated concentrations. Samples were analysed by flow cytometry. Representative overlaid histograms show the binding of CTLA4Fcε (top) or IgE (bottom) to CD23, measured as the reduction in the anti‐CD23/PE‐related fluorescence. Inset numbers shown above the select histograms are mean fluorescence intensity (MFI) values. In contrast to the marginal influence of IgE, CTLA4Fcε exerted a clear inhibitory effect on anti‐CD23/PE binding to CD23. The results shown come from a single experiment and are representative of three independent experiments, each performed in duplicate. (b) RPMI‐8866 cells were cultured in the presence or absence of CTLA4Fcε or IgE, and the sCD23 content in supernatants was determined by a CD23‐specific ELISA (no IgE/CTLA4Fcɛ: 100%; IgE at 3·12 nm: 122·4 ± 4·8%; CTLA4Fcε at 3·12 nm: 83·7 ± 1·8%; CTLA4Fcε at 6·25 nm: 69·5 ± 2%; CTLA4Fcε at 12·5 nm: 65·5 ± 1·7%; CTLA4Fcε at 25 nm: 62·8 ± 1·7%). Results shown are the arithmetic means ± SD of duplicates combined from four independent experiments. *P < 0·001.
Figure 7
Figure 7
CTLA4Fcε inhibits concanavalin A (Con A) ‐induced human lymphocyte proliferation. Peripheral blood mononuclear cells (PBMCs) were isolated from human blood samples, labelled with CFDASE, and cultured for 5 days in the presence of Con A and the indicated concentrations of purified CTLA4Fcε or abatacept (CTLA4Ig). Afterwards, the cells were harvested and analysed by flow cytometry to estimate CFSE content per cell. (a) The percentage of proliferating cells was determined on the basis of the cellular CFSE content for each experimental condition tested. Results shown are the arithmetic means ± SD of the normalized values obtained from several independent experiments, which are also individually identified with symbols in the figure (CTLA4Fcε experiments: n = 4; abatacept experiments: n = 5 to n = 8). Statistically significant differences compared to the control condition (a sample in which no protein – CTLA4Fcε or abatacept – was added, 100% proliferation) were observed with CTLA4Fcε at 10 nm (60 ± 23·8%; P < 0·05) and with abatacept at 10 nm (67·5 ± 22·7%; P < 0·05), 100 nm (54·7 ± 31·2%; P < 0·05), and 1000 nm (42 ± 29·9%; P < 0·05). (b) The percent of cells experiencing zero, one, two, three or four rounds of cell division were defined according to the CFSE content as described in the Materials and methods section. Statistically significant differences were found for the CTLA4Fcε treatment in the group of non‐dividing cells (labelled as ‘0’) [0·0 nm (37·1 ± 17·7%) and 0·1 nm (32·5 ± 15·3%) versus 10 nm (58·4 ± 28·7%)], and in the group of cells experiencing three rounds of cell division [0·0 nm (22·2 ± 11·4%) and 0·1 nm (23·3 ± 11·2%) versus 10 nm (12·6 ± 7·5%)]. For the abatacept treatment, statistically significant differences were also found in the group of non‐dividing cells [0·0 nm (46·9 ± 17·7%) and 0·1 nm (52·6 ± 22·5%) versus 100 nm (85·8 ± 12·1%)], as well as in the group of cells experiencing three rounds of cell division [0·0 nm (19·7 ± 7·2%) and 0·1 nm (16·9 ± 8·6%) versus 100 nm (4·2 ± 4·8%)]. All of the CTLA4Fcε experiments – and abatacept experiments ■, ○, ▲, ▵, ʘ, and ▼ – shown in (a) were included for the analysis. *P < 0·05; **P < 0·1.

Similar articles

Cited by

References

    1. Forsthuber TG, Ji N. Quo vadis Th1 and Th2 cells in autoimmunity and infectious diseases: Th17 cells, the new kid on the block. Exp Rev Clin Immunol 2007; 3:251–4. - PubMed
    1. Charles N, Hardwick D, Daugas E, Illei GG, Rivera J. Basophils and the T helper 2 environment can promote the development of lupus nephritis. Nat Med 2010; 16:701–7. - PMC - PubMed
    1. Galli SJ, Tsai M. IgE and mast cells in allergic disease. Nat Med 2012; 18:693–704. - PMC - PubMed
    1. Holgate S, Casale T, Wenzel S, Bousquet J, Deniz Y, Reisner C. The anti‐inflammatory effects of omalizumab confirm the central role of IgE in allergic inflammation. J Allergy Clin Immunol 2005; 115:459–65. - PubMed
    1. Nagel A, Lang A, Engel D, Podstawa E, Hunzelmann N, de Pita O et al Clinical activity of pemphigus vulgaris relates to IgE autoantibodies against desmoglein 3. Clin Immunol 2010; 134:320–30. - PubMed

Publication types

LinkOut - more resources