. 2016 Feb 9;113(6):E782-90.
doi: 10.1073/pnas.1517141113. Epub 2016 Jan 22.

Metabolic stress is a barrier to Epstein-Barr virus-mediated B-cell immortalization

Affiliations

Metabolic stress is a barrier to Epstein-Barr virus-mediated B-cell immortalization

Karyn McFadden et al. Proc Natl Acad Sci U S A. .

Abstract

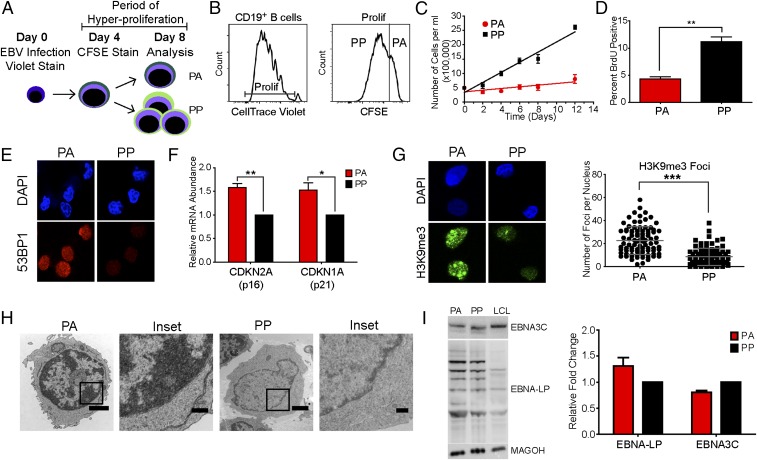
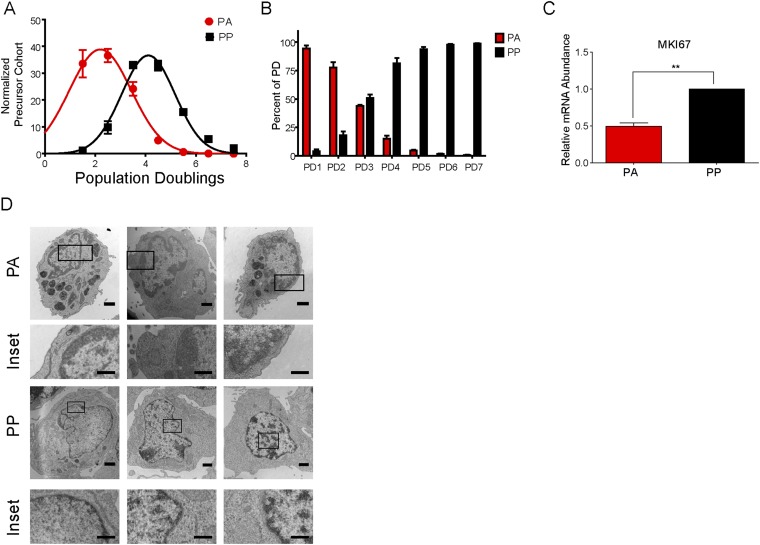
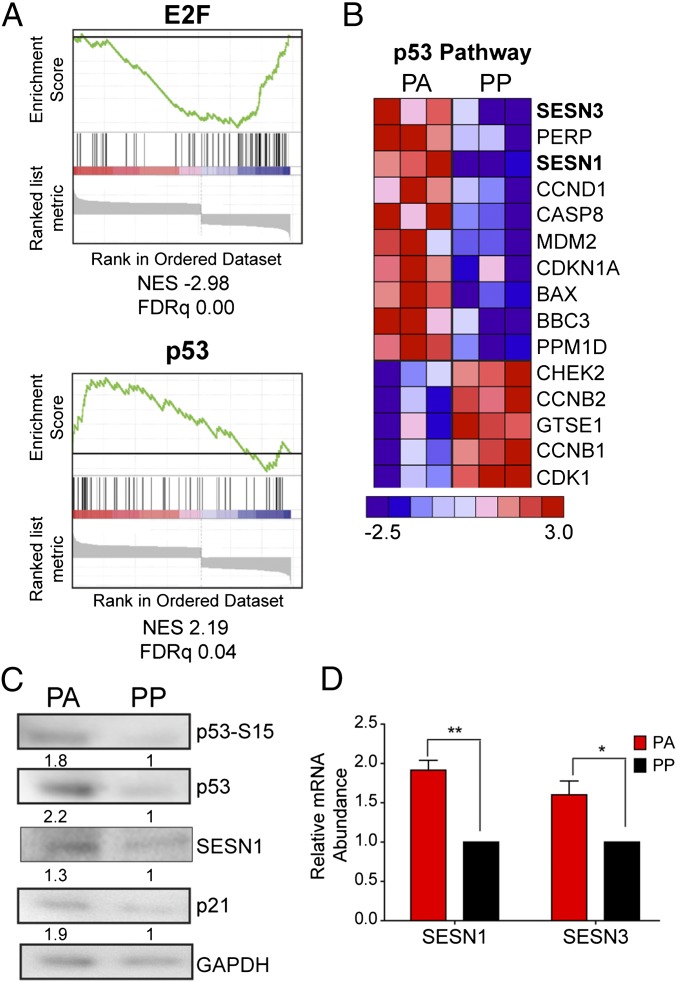
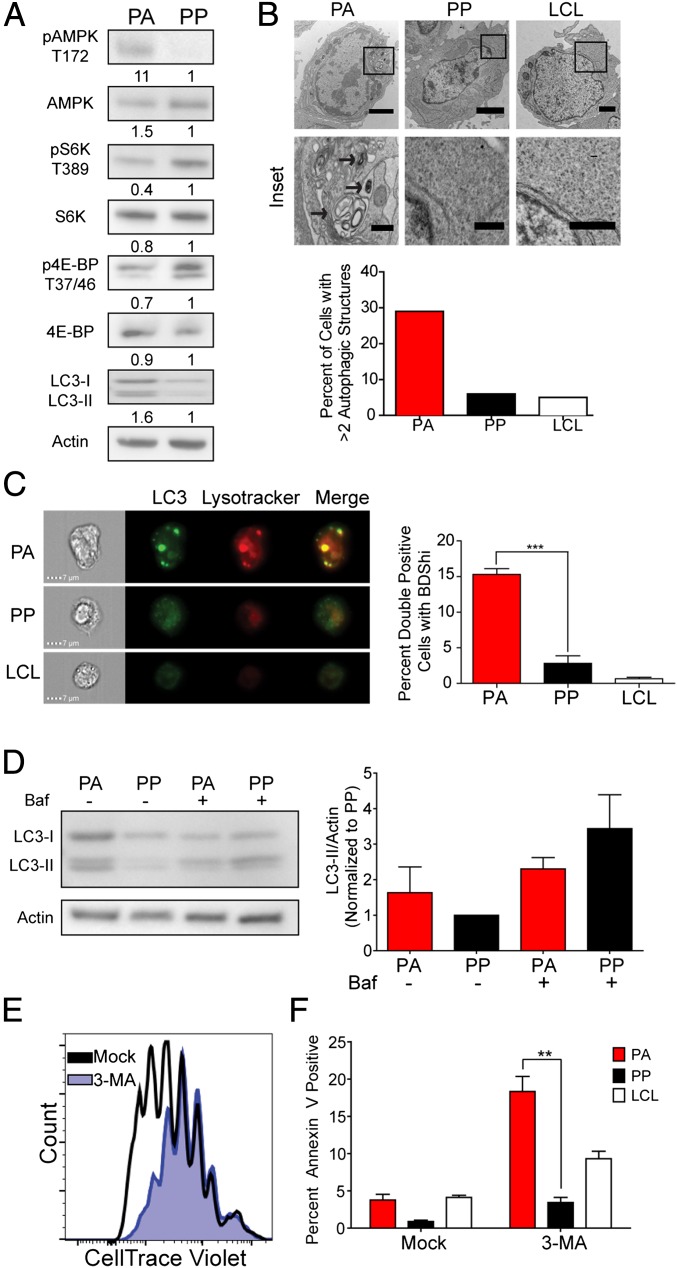
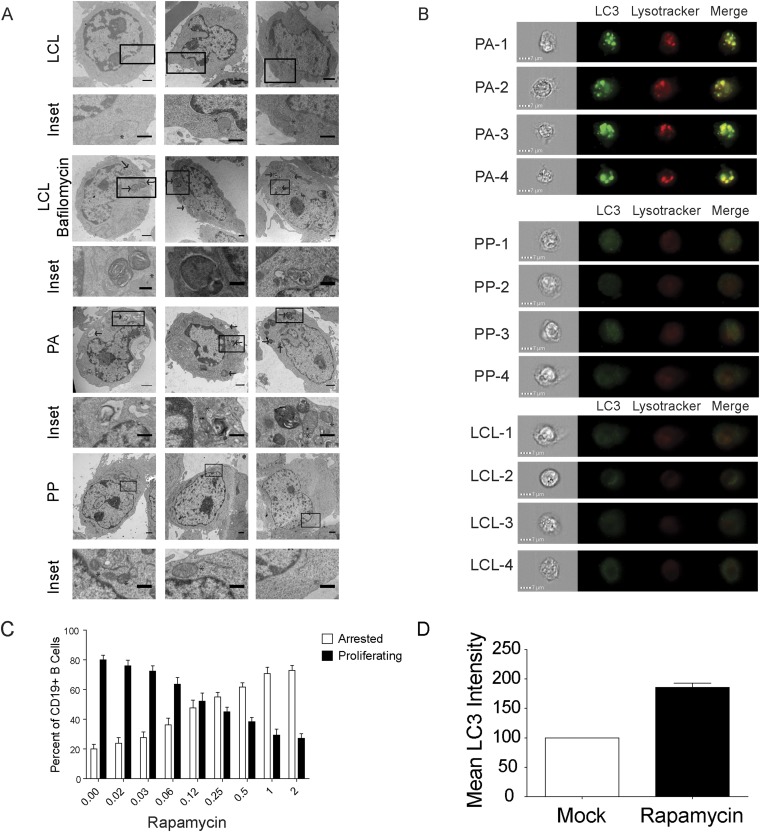
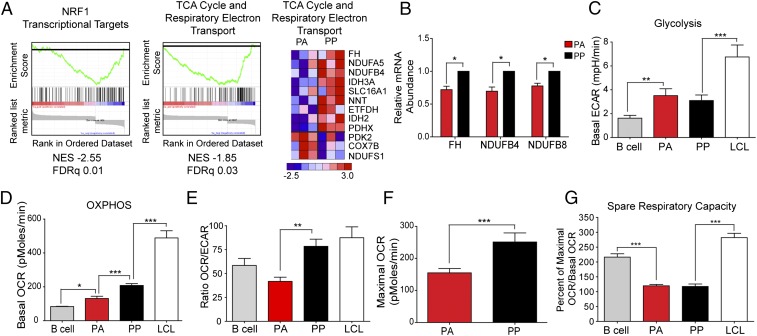
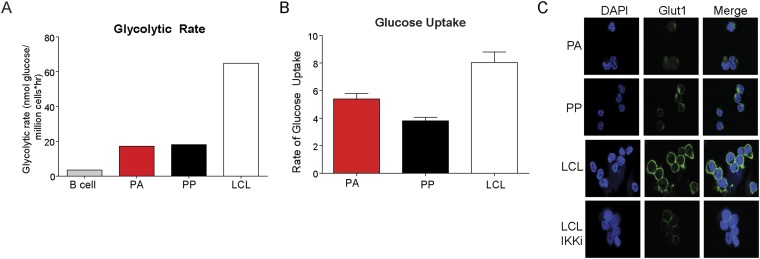
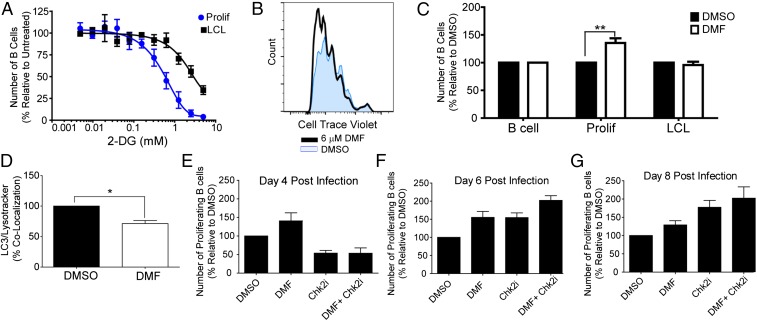
Epstein-Barr virus (EBV) is an oncogenic herpesvirus that has been causally linked to the development of B-cell and epithelial malignancies. Early after infection, EBV induces a transient period of hyperproliferation that is suppressed by the activation of the DNA damage response and a G1/S-phase growth arrest. This growth arrest prevents long-term outgrowth of the majority of infected cells. We developed a method to isolate and characterize infected cells that arrest after this early burst of proliferation and integrated gene expression and metabolic profiling to gain a better understanding of the pathways that attenuate immortalization. We found that the arrested cells have a reduced level of mitochondrial respiration and a decrease in the expression of genes involved in the TCA cycle and oxidative phosphorylation. Indeed, the growth arrest in early infected cells could be rescued by supplementing the TCA cycle. Arrested cells were characterized by an increase in the expression of p53 pathway gene targets, including sestrins leading to activation of AMPK, a reduction in mTOR signaling, and, consequently, elevated autophagy that was important for cell survival. Autophagy was also critical to maintain early hyperproliferation during metabolic stress. Finally, in assessing the metabolic changes from early infection to long-term outgrowth, we found concomitant increases in glucose import and surface glucose transporter 1 (GLUT1) levels, leading to elevated glycolysis, oxidative phosphorylation, and suppression of basal autophagy. Our study demonstrates that oncogene-induced senescence triggered by a combination of metabolic and genotoxic stress acts as an intrinsic barrier to EBV-mediated transformation.

Keywords: B cell; Epstein–Barr virus; autophagy; metabolism; oncogene-induced senescence.


Conflict of interest statement

The authors declare no conflict of interest.

Figures

Fig. 1.
Fig. 1.
A subset of EBV-induced hyperproliferating cells exhibit characteristics of OIS. (A) Schematic representing the experimental protocol. (B) Histograms showing CD19+ B-cell division measured at 8 d after infection. (B, Left) Proliferation of CD19+ B cells was determined through the dilution of the CellTrace Violet stain. (B, Right) The cells labeled “Prolif” were further analyzed for dilution of the CFSE stain. Cells that dilute the CellTrace Violet stain, but not the CFSE stain, are considered arrested. (C) EBV-infected CD19+ B cells were sorted into PA and PP populations and recultured in fresh medium. Samples were counted by trypan blue exclusion every 48 h (n = 3). (D) The percent of BrdU incorporation in PA or PP cells at day 8 after infection. (E) IF of DAPI (blue) or 53BP1 (red) measured from sorted PA and PP cells (n = 3). (F) The expression level of CDKN2A and CDKN1A mRNA was measured from sorted PA and PP cells. Relative mRNA abundance was normalized to SETDB1. Data are represented as fold change relative to the PP cells (n = 5). (G, Left) IF of DAPI (blue) or H3K9me3 (green) measured from sorted PA and PP cells (n = 3). (G, Right) Quantification of IF. (H) Representative TEM images of sorted PA or PP cells (n = 2). (Magnification: PA, 3,300×; PP, 4,400×.) (Scale bars: 1 µm.) Insets show heterochromatic DNA. (Scale bar: 0.5 µm.) Error bars represent SEM. (I, Left) Representative immunoblot of sorted PA and PP cells or LCLs stained with the indicated antibody (n = 3). (I, Right) Quantitation of immunoblot normalized to MAGOH loading control (n = 3). Error bars represent SEM. *P < 0.05; **P < 0.01; ***P < 0.001 as determined by a paired t test. n, the number of independent donors tested.
Fig. S1.
Fig. S1.
A subset of EBV-induced hyperproliferating cells exhibit characteristics of OIS. EBV-infected B cells were stained as described in Fig. 1A and analyzed at day 8 after infection. (A) The number of cells within each CellTrace Violet PD was determined for the PA and PP cells. The data were then precursor cohort normalized and plotted against PDs (n = 3). (B) The number of cells within each CellTrace Violet PD was further analyzed to determine the percentage that arrest (PA) vs. continue to proliferate (PP; n = 3). (C) The expression level of MKI67 mRNA was measured from sorted PA and PP cells. Relative mRNA abundance was normalized to SETDB1. (D) Representative TEM images of sorted PA or PP cells (n = 2). Inset shows heterochromatic DNA. (Magnification ranges from 5,600× to 7,100×.) (Scale bar: 1 μm; Inset, 0.5 μm.) Data are represented as fold change relative to the PP cells (n = 3). Error bars represent SEM. **P < 0.01 as determined by a paired t test. n, the number of independent donors tested.
Fig. 2.
Fig. 2.
Transcriptomic changes between PA and PP cells indicate reduced cell-cycle progression and increased p53 activation in PA cells. EBV-infected B cells were stained as described in Fig. 1A and sorted at day 8 after infection. (A) GSEA of transcription factor use (MSigDB c3) in genes that exhibited significant change (two-way ANOVA, P < 0.05). Enrichment plots for E2F and p53 are shown. Normalized enrichment scores (NES) and false discovery rate q values (FDRq) are shown below each plot. (B) Heat map representing genes enriched in p53 Downstream Pathway (PID) obtained from GSEA. Genes exhibiting significant changes (two-way ANOVA, P < 0.05) were analyzed. The heat map shows genes that were changed at least 1.2-fold (n = 3). (C) Representative immunoblot of sorted PA and PP cells stained with the indicated antibody. Quantitation represents staining from three independent donors normalized to GAPDH. (D) The expression level of SESN1 and SESN3 mRNA was measured from sorted PA and PP cells (n = 3). Relative mRNA abundance was normalized to SETDB1. Data are represented as fold change relative to the PP cells. Error bars represent SEM; *P < 0.05; **P < 0.01 as determined by a paired t test. n, the number of independent donors tested.
Fig. 3.
Fig. 3.
The PA cells exhibit suppression of the mTOR pathway and increased autophagy. EBV-infected B cells were stained as described in Fig. 1A and analyzed at day 8 after infection. (A) Representative immunoblot of sorted PA and PP cells stained with the indicated antibody (n = 3). Quantitation was done on three independent donors and normalized to actin. (B, Upper) Representative TEM image of sorted PA and PP cells as well as LCLs. Arrows indicate autolysosomes (n = 2). (Magnification: PA, 7,100×; PP, 8,800×; LCL, 4,400×.) (Scale bars: 2 µm; Inset, 0.5 µm.) (B, Lower) Quantitation of TEM data. The graph represents the percent of cells with greater than two autophagic structures. (C, Left) Imagestream analysis of PA, PP, and LCLs that were stained with Lysotracker and anti-LC3 (n = 3). (C, Right) Quantitation of cells showing high colocalization of Lysotracker with LC3 in double-positive cells. The data are represented as a measure of bright detail similarity as determined by IDEAS software (Version 3.0). (D, Left) Representative immunoblot of sorted PA and PP cells that were treated with Bafilomycin A or mock treated. (D, Right) Quantitation of LC3-II staining after normalization to the actin loading control (n = 3). (E) Histograms showing CD19+ B-cell division measured at 8 d after infection after treatment with 5 mM 3-MA for 48 h. (F) Percentage of Annexin positive PA or PP cells after treatment as in E. Error bars represent SEM. **P < 0.01; ***P < 0.001 as determined by a paired t test.
Fig. S2.
Fig. S2.
The PA cells exhibit suppression of the mTOR pathway and increased autophagy. (A) Representative TEM images of sorted PA and PP cells as well as negative control LCLs and positive control serum starved and bafilomycin-treated LCLs. Arrows indicate autolysosomes and/or phagosomes (n = 2). (Magnification ranges from 3,400× to 11,500×.) (Scale bar: 1 μm; Inset, 0.5 μm.) (B) Imagestream analysis of PA, PP, and LCLs that were stained with Lysotracker and anti-LC3. (C) Percent of cells that arrest after treatment with the indicated dose of Rapamycin (n = 3). (D) Relative increase in LC3 mean fluorescence intensity in cells treated with 2 nM rapamycin or mock treated (n = 2). n, the number of independent donors tested.
Fig. 4.
Fig. 4.
Integration of transcriptomic and metabolic profiling reveals key differences between uninfected B cells, PA, PP, and LCLs. (A, Left and Center) Enrichment plot of transcriptional targets of NRF1 (Left) or genes enriched in “TCA Cycle and Respiratory Electron Transport” pathway (Center) obtained from GSEA. (A, Right) Heat map representing genes enriched in TCA Cycle and Respiratory Electron Transport. Genes exhibiting significant changes (two-way ANOVA, P < 0.05) are represented (n = 3). (B) The expression levels of the indicated mRNAs were measured from sorted PA and PP cells. Relative mRNA abundance was normalized to SETDB1. Data are represented as fold change relative to the PP cells. (CG) Metabolic analysis was performed on uninfected B cells; sorted PA and PP cells; or LCLs by using a Seahorse XF to measure ECAR (C), OCR (D), the ratio of OCR to ECAR (E), Maximal OCR (F), or the Spare Respiratory Capacity (G). Error bars represent SEM. *P < 0.05; **P < 0.01; ***P < 0.001 as determined by a paired t test. All analysis was performed on three independent donors.
Fig. S3.
Fig. S3.
Metabolic profile reveals differences between uninfected B cells, PA, PP, or LCLs. (A) Glycolytic rate of uninfected B cells; CD19+, EBV-infected, sorted PA and PP cells, or LCLs. (B) Glucose uptake in PA, PP, or LCLs. Cells were starved in glucose-free medium for 1 h and then supplemented with 2-NBDG, a fluorescent glucose analog. (C) IF of DAPI (blue) or GLUT1 (green).
Fig. 5.
Fig. 5.
2-DG preferentially inhibits and DMF increases early EBV-infected B-cell proliferation in a manner distinct from Chk2i treatment. (A) EBV-infected cells were treated with the indicated concentration of 2-DG at day 4 after infection, and the number of proliferating CD19+ B cells was determined by FACS on day 8. LCLs were treated for an identical time period (n = 3). (B) Representative histogram showing CD19+ B cells proliferation at day 8 after infection. The cells were treated with either DMSO or 6 µM DMF at the time of infection. (C) The number of proliferating uninfected, CD19+ B cells (B cell); EBV-infected, CD19+ B cells that diluted CTV (Prolif) or LCLs was determined by FACS and graphed as a percentage of the DMSO-treated control. Prolif cells were treated with DMSO or 6 µM DMF at the time of infection and analyzed at day 8 after infection (n = 3). (D) EBV-infected B cells were treated with DMF as in B and analyzed for colocalization of LC3 with Lysotracker by Imagestream analysis. (EG) The number of proliferating CD19+ B cells was determined for cells that were treated with DMSO, 6 µM DMF, 5 µM Chk2i, or a combination of Chk2i and DMF at the time of infection. The data were analyzed by FACS at day 4 (E), day 6 (F), or day 8 (G) after infection and are presented as a percentage of the DMSO-treated control. A minimum of three independent donors were analyzed for each time point. Error bars represent SEM. *P < 0.05; **P < 0.01 as determined by a paired t test. n, the number of independent donors tested.

Similar articles

Cited by

References

    1. Rickinson A, Kieff E. In: Epstein-Barr Virus Fields Virology. 5th Ed. Knipe DM, Howley PM, editors. Lippincott, Williams, and Wilkins; Philadelphia: 2007. pp. 2603–2654.
    1. Sinclair AJ, Palmero I, Peters G, Farrell PJ. EBNA-2 and EBNA-LP cooperate to cause G0 to G1 transition during immortalization of resting human B lymphocytes by Epstein-Barr virus. EMBO J. 1994;13(14):3321–3328. - PMC - PubMed
    1. Wang F, Kikutani H, Tsang SF, Kishimoto T, Kieff E. Epstein-Barr virus nuclear protein 2 transactivates a cis-acting CD23 DNA element. J Virol. 1991;65(8):4101–4106. - PMC - PubMed
    1. Alfieri C, Birkenbach M, Kieff E. Early events in Epstein-Barr virus infection of human B lymphocytes. Virology. 1991;181(2):595–608. - PubMed
    1. Nikitin PA, et al. An ATM/Chk2-mediated DNA damage-responsive signaling pathway suppresses Epstein-Barr virus transformation of primary human B cells. Cell Host Microbe. 2010;8(6):510–522. - PMC - PubMed

Publication types

MeSH terms