. 2016 Aug;27(8):2422-35.
doi: 10.1681/ASN.2015091048. Epub 2016 Jan 22.

Nephrin Tyrosine Phosphorylation Is Required to Stabilize and Restore Podocyte Foot Process Architecture

Affiliations

Nephrin Tyrosine Phosphorylation Is Required to Stabilize and Restore Podocyte Foot Process Architecture

Laura A New et al. J Am Soc Nephrol. 2016 Aug.

Abstract

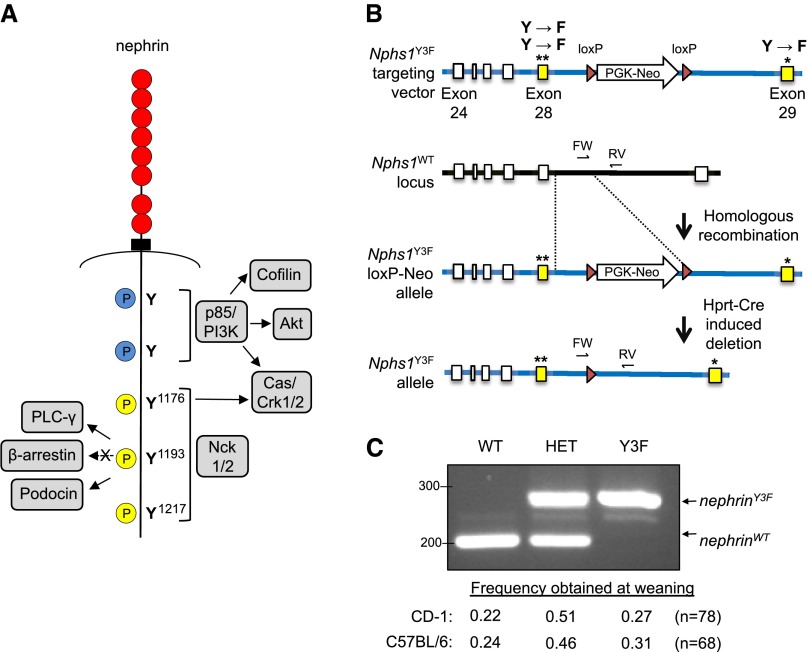
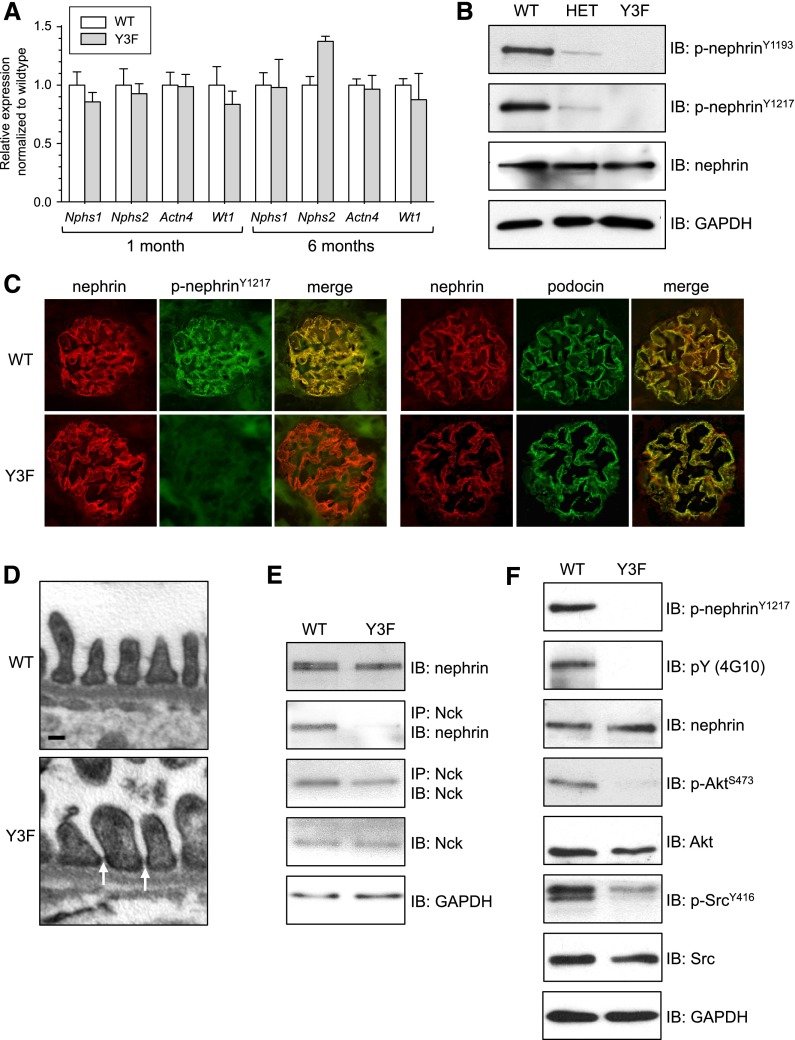
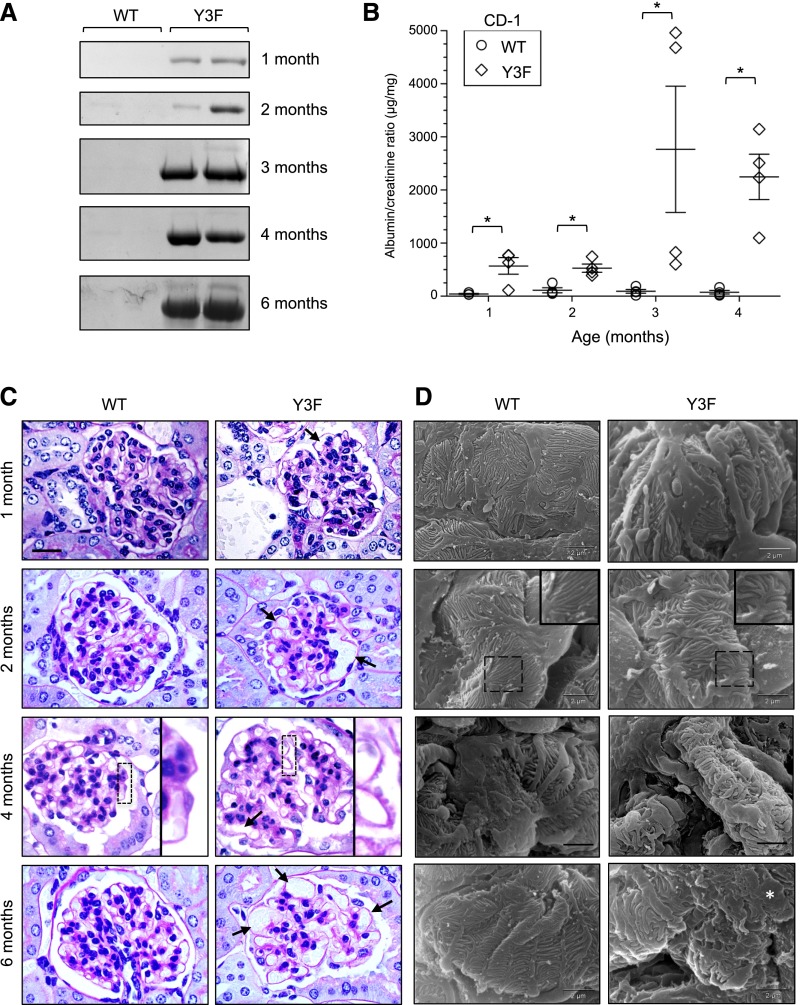
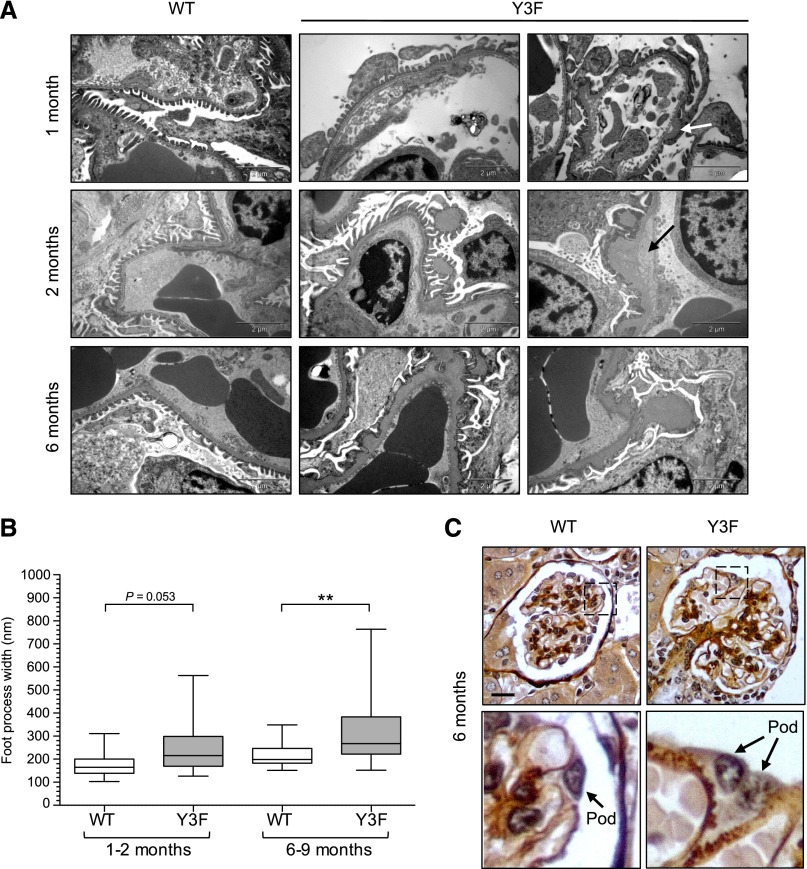
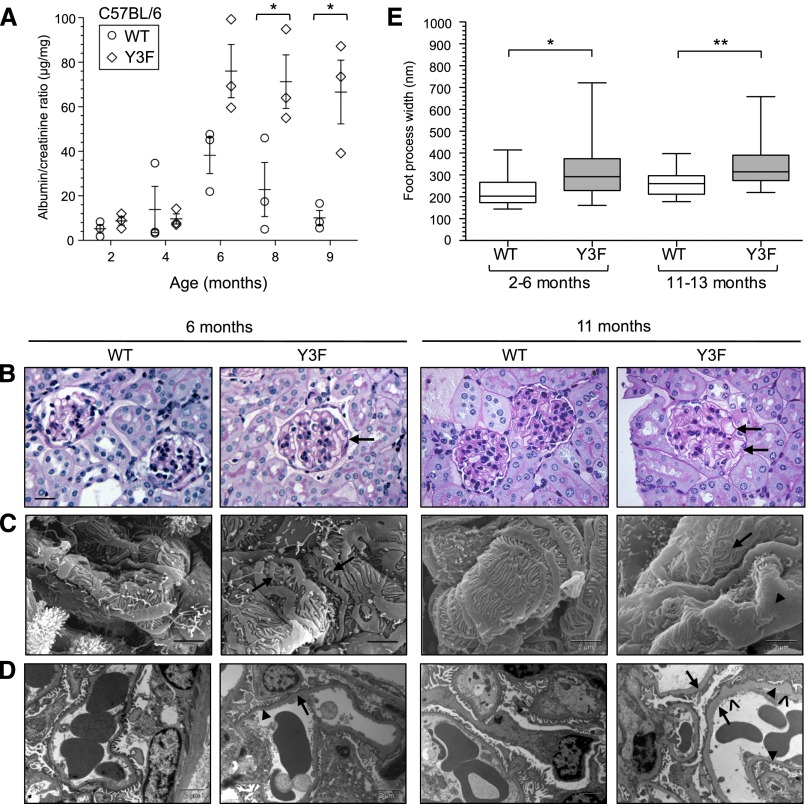
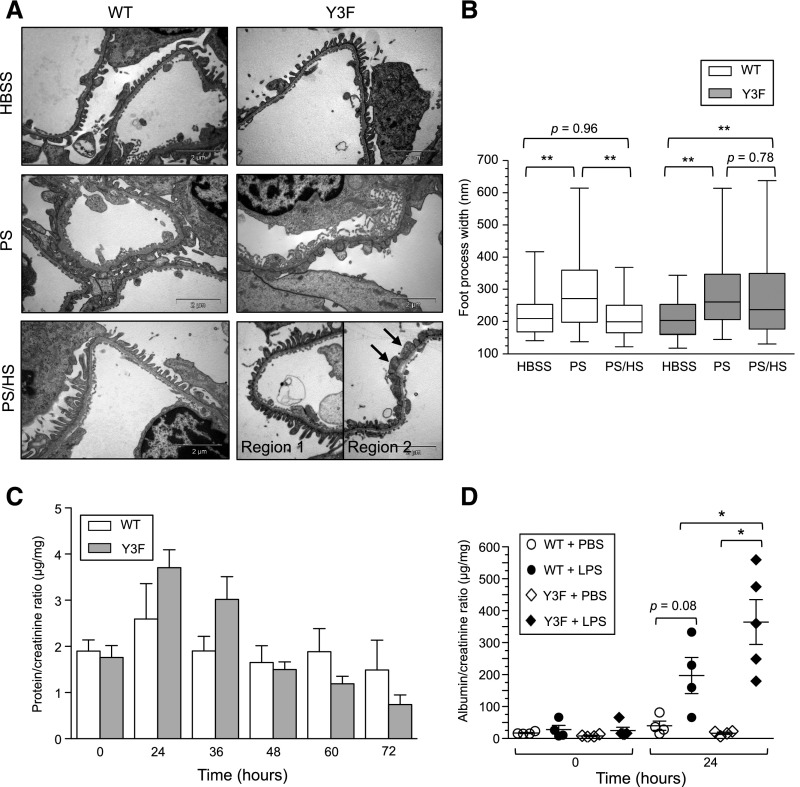
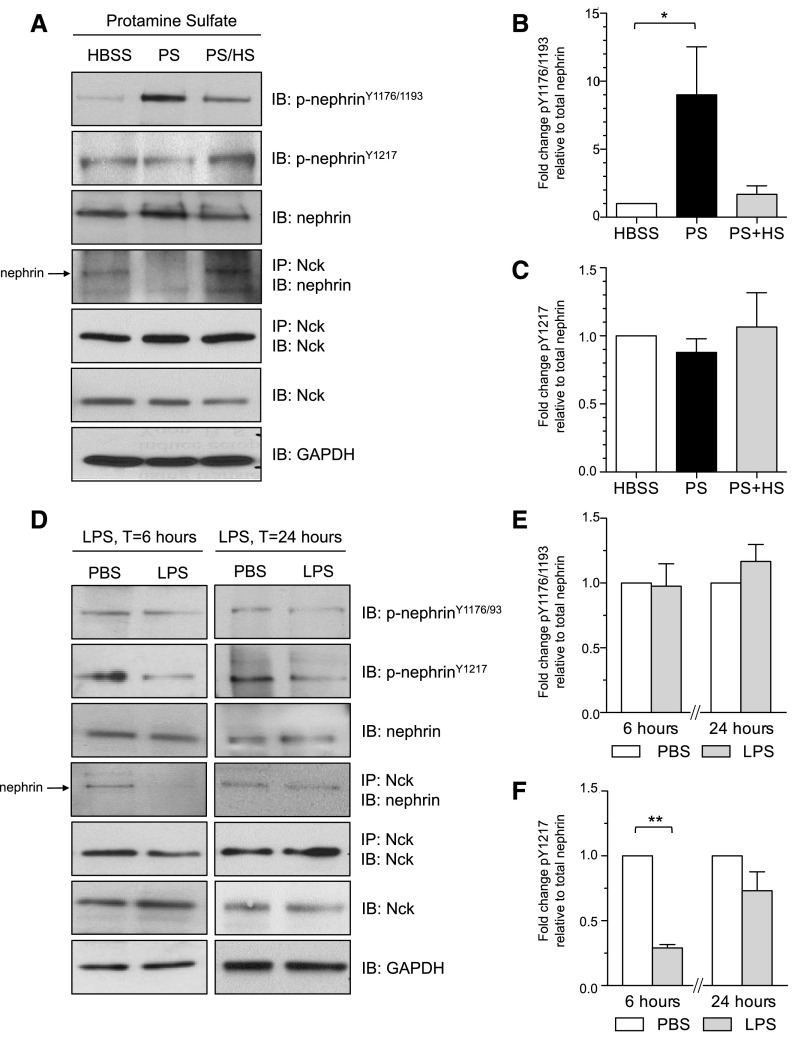
Podocytes are specialized epithelial cells of the kidney blood filtration barrier that contribute to permselectivity via a series of interdigitating actin-rich foot processes. Positioned between adjacent projections is a unique cell junction known as the slit diaphragm, which is physically connected to the actin cytoskeleton via the transmembrane protein nephrin. Evidence indicates that tyrosine phosphorylation of the intracellular tail of nephrin initiates signaling events, including recruitment of cytoplasmic adaptor proteins Nck1 and Nck2 that regulate actin cytoskeletal dynamics. Nephrin tyrosine phosphorylation is altered in human and experimental renal diseases characterized by pathologic foot process remodeling, prompting the hypothesis that phosphonephrin signaling directly influences podocyte morphology. To explore this possibility, we generated and analyzed knockin mice with mutations that disrupt nephrin tyrosine phosphorylation and Nck1/2 binding (nephrin(Y3F/Y3F) mice). Homozygous nephrin(Y3F/Y3F) mice developed progressive proteinuria accompanied by structural changes in the filtration barrier, including podocyte foot process effacement, irregular thickening of the glomerular basement membrane, and dilated capillary loops, with a similar but later onset phenotype in heterozygous animals. Furthermore, compared with wild-type mice, nephrin(Y3F/Y3F) mice displayed delayed recovery in podocyte injury models. Profiling of nephrin tyrosine phosphorylation dynamics in wild-type mice subjected to podocyte injury indicated site-specific differences in phosphorylation at baseline, injury, and recovery, which correlated with loss of nephrin-Nck1/2 association during foot process effacement. Our results define an essential requirement for nephrin tyrosine phosphorylation in stabilizing podocyte morphology and suggest a model in which dynamic changes in phosphotyrosine-based signaling confer plasticity to the podocyte actin cytoskeleton.

Keywords: cell biology and structure; cell signaling; cytoskeleton; glomerular disease; nephrin; podocyte.


Figures

Figure 1.
Figure 1.
Generation of nephrin-Y3F mice. (A) Diagram of human nephrin protein indicating the positions of phosphorylated (P) tyrosine (Y) residues within the cytoplasmic tail of nephrin with several binding partners as indicated. The three mouse nephrin tyrosines corresponding to human Y1176, Y1193, and Y1217 (yellow) were mutated to phenylalanine (F) to create nephrin-Y3F. (B) Schematic of the Y3F targeting vector used to introduce the modified exons (28 and 29; yellow) into the WT murine Nphs1 locus by homologous recombination. A loxP-flanked PGK-Neo selection cassette was later removed via Hprt-Cre. (C) PCR analysis of the Nphs1WT and Nphs1Y3F alleles using FW and RV primers (as in B) on genomic DNA samples from representative nephrinWT/WT, nephrinWT/Y3F (HET), and nephrinY3F/Y3F animals. All genotypes on both CD-1 and C57Bl/6 genetic backgrounds are obtained with normal Mendelian frequency. *, **Indicate presence of Y to F mutations.
Figure 2.
Figure 2.
Validation of expression and function of Nphs1Y3F mutant allele. (A) Real–time PCR analysis of mRNA levels in glomeruli isolated from 1- and 6-month-old nephrinWT/WT and nephrinY3F/Y3F animals for Nphs1 and podocyte markers Nphs2, Actn4, and Wt1. For each gene, expression in WT animals was adjusted to 1.0. (B) Nephrin protein expression and phosphorylation was evaluated using immunoblotting (IB) for the indicated antibodies on glomeruli isolated from nephrinWT/WT, nephrinWT/Y3F (HET), and nephrinY3F/Y3F mice. (C) Dual-immunofluorescence staining for total nephrin (red) and phosphonephrin (Y1217; green) or total nephrin (red) and podocin (green) on kidney sections of 1-month-old WT and Y3F animals. (D) Transmission EM of 1-month-old WT and Y3F animals showing slit diaphragms (arrows). Scale bar, 100 nm. (E) IB for nephrin and Nck in anti-Nck immunoprecipitates (IPs) from WT and Y3F glomerular lysates showing disruption of nephrin-Nck interaction in Y3F mice. (F) IB of glomerular lysates (10 μg) from WT and Y3F mice showing altered nephrin phosphosignaling to Akt and Src. Similar results were obtained in CD-1 and C57BL/6 mice. All results shown are from CD-1 mice, except in E, which is from C57BL/6 mice.
Figure 3.
Figure 3.
CD-1 nephrinY3F/Y3F mice develop proteinuria, GBM alterations, and foot process effacement. (A) Coomassie-stained gels of consecutive urine samples from nephrinWT/WT and nephrinY3F/Y3F animals. (B) Quantification using ACR (n=4 per genotype). *P<0.05 by ANOVA. (C) Light microscopy analysis of periodic acid–Schiff-stained sections of WT and Y3F animals. Y3F animals show capillary loop dilation (arrows in 1, 2 and 6 months) and GBM spikes (inset in 4 months). (D) Scanning EM analysis of podocyte morphology in WT and Y3F animals. Y3F animals begin to show branched and disorganized foot processes (inset in 2 months), which progress to severe foot process disorganization and effacement (asterisk at 6 months). Scale bars, 20 μm in C; 2 μm in D.
Figure 4.
Figure 4.
Progressive GBM abnormalities in CD-1 nephrinY3F/Y3F mice. (A) Transmission EM depicting changes in basement membrane morphology in nephrinY3F/Y3F animals compared with nephrinWT/WT animals. At 1 and 2 months of age, there are focal regions of thickened GBM and evidence of splitting (arrows) in Y3F animals, and at 6 months, numerous subepithelial humps associated with extensive regions of effacement can be seen. (B) Box and whisker (5%–95%) plots of individual foot process widths measured via transmission EM (n=2–3 mice analyzed per group with a minimum of 50 measurements per mouse). **P<0.01 by ANOVA. (C) Light microscopy analysis of silver-stained sections from 6-month-old WT and Y3F mice. Diffuse light brown staining highlights the expanded GBM and membrane humps in Y3F mice (lower panel). Scale bars, 2 μm in A; 20 μm in C.
Figure 5.
Figure 5.
C57BL/6 nephrinY3F/Y3F mice develop mild proteinuria and delayed glomerular phenotype. (A) Quantification of urine samples from male nephrinWT/WT and nephrinY3F/Y3F animals using ACR (n=3 per genotype). *P<0.05 by ANOVA. (B) Light microscopy analysis of periodic acid–Schiff-stained WT and Y3F animals at 6 and 11 months of age highlighting the presence of dilated capillary loops (arrows). (C). Scanning EMs depicting abnormal appearance of podocytes in Y3F animals, wherein foot processes appear short, broad, and curved (arrows) with significant regions of effacement at 11 months (arrowhead). (D) Transmission EM analysis of GBM morphology in WT and Y3F animals showing progressive segmental changes with regions of foot process preservation (arrowheads) adjacent to effacement (arrows) in addition to increased matrix deposition resulting in spike-like protrusions on the epithelial face of the GBM (^). (E) Box and whisker (5%–95%) plots of individual foot process widths measured via transmission EM of mice within the indicated age groups (n=2–4 mice analyzed per group with a minimum of 50 measurements per mouse). Scale bars, 20 μm in B; 2 μm in C and D. *P<0.05 by ANOVA; **P<0.01 by ANOVA.
Figure 6.
Figure 6.
C57BL/6 nephrinY3F/Y3F mice display delayed recovery in podocyte injury models. (A) Transmission EM of foot processes in nephrinWT/WT and nephrinY3F/Y3F mice perfused with HBSS, protamine sulfate (PS), or protamine sulfate followed by heparin sulfate (PS/HS). PS induces foot process spreading in both genotypes. A proportion of foot processes is restored with HS in Y3F mice (region 1), although the majority remains spread (region 2, arrows). Images are representative of two mice of each genotype per condition. Scale bar, 2 μm. (B) Box and whisker (5%–95%) plots of individual foot process widths measured via transmission EM (n=2 kidneys analyzed per treatment with a minimum of 60 measurements per mouse). Comparisons were made between treatments as indicated. (C) Quantification of total urinary protein normalized to urine creatinine shows that Y3F mice have an enhanced response to LPS–induced podocyte injury at 24 and 36 hours compared with control (Y3F: n=8–13 per time point; WT: n=4–6 per time point except at 60 hours, where n=3). (D) Quantification using ACR at 0 and 24 hours (n=4–5 per genotype). *P<0.05 by ANOVA; **P<0.01 by ANOVA.
Figure 7.
Figure 7.
Immunoblot (IB) analysis of nephrin tyrosine phosphorylation and Nck binding in glomeruli isolated from WT mice exposed to podocyte injury. (A) Nephrin tyrosine phosphorylation and nephrin/Nck coimmunoprecipitation (IP) after injection with HBSS, protamine sulfate (PS), or protamine sulfate followed by heparin sulfate (PS/HS). Interaction of nephrin with Nck is decreased on PS perfusion. (B and C) Densitometric quantitation of results in A shows a significant increase in nephrin tyrosine phosphorylation on Y1176/1193 but not Y1217 in PS-treated samples. (D) Nephrin tyrosine phosphorylation and nephrin/Nck IP 6 and 24 hours after injection with PBS or LPS. Interaction of nephrin with Nck is decreased at 6 hours after LPS injection. (E and F) Densitometric quantitation of results in D shows a significant decrease in nephrin tyrosine phosphorylation on Y1217 but not Y1176/1193 at 6 hours after LPS injection. The fold change in nephrin phosphorylation was normalized to control samples (i.e., HBSS or PBS). Mice were analyzed individually, and results are representative of three to five mice per treatment. *P<0.05; **P<0.01.

References

    1. Greka A, Mundel P: Cell biology and pathology of podocytes. Annu Rev Physiol 74: 299–323, 2012 - PMC - PubMed
    1. Scott RP, Quaggin SE: Review series: The cell biology of renal filtration. J Cell Biol 209: 199–210, 2015 - PMC - PubMed
    1. Kerjaschki D: Caught flat-footed: Podocyte damage and the molecular bases of focal glomerulosclerosis. J Clin Invest 108: 1583–1587, 2001 - PMC - PubMed
    1. Grahammer F, Schell C, Huber TB: The podocyte slit diaphragm--from a thin grey line to a complex signalling hub. Nat Rev Nephrol 9: 587–598, 2013 - PubMed
    1. Welsh GI, Saleem MA: Nephrin-signature molecule of the glomerular podocyte? J Pathol 220: 328–337, 2010 - PubMed

Publication types

LinkOut - more resources