Review
. 2016 May;33(5):1147-57.
doi: 10.1093/molbev/msw015. Epub 2016 Jan 22.

The Diversity and Molecular Evolution of B-Cell Receptors during Infection

Affiliations
Review

The Diversity and Molecular Evolution of B-Cell Receptors during Infection

Kenneth B Hoehn et al. Mol Biol Evol. 2016 May.

Abstract

B-cell receptors (BCRs) are membrane-bound immunoglobulins that recognize and bind foreign proteins (antigens). BCRs are formed through random somatic changes of germline DNA, creating a vast repertoire of unique sequences that enable individuals to recognize a diverse range of antigens. After encountering antigen for the first time, BCRs undergo a process of affinity maturation, whereby cycles of rapid somatic mutation and selection lead to improved antigen binding. This constitutes an accelerated evolutionary process that takes place over days or weeks. Next-generation sequencing of the gene regions that determine BCR binding has begun to reveal the diversity and dynamics of BCR repertoires in unprecedented detail. Although this new type of sequence data has the potential to revolutionize our understanding of infection dynamics, quantitative analysis is complicated by the unique biology and high diversity of BCR sequences. Models and concepts from molecular evolution and phylogenetics that have been applied successfully to rapidly evolving pathogen populations are increasingly being adopted to study BCR diversity and divergence within individuals. However, BCR dynamics may violate key assumptions of many standard evolutionary methods, as they do not descend from a single ancestor, and experience biased mutation. Here, we review the application of evolutionary models to BCR repertoires and discuss the issues we believe need be addressed for this interdisciplinary field to flourish.

Keywords: B-cell receptor; diversity; immunoglobulin; infection.; molecular evolution.


Figures

F<sc>ig</sc>. 1
Fig. 1
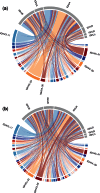
Chord diagrams showing the pairing of V and J segments within (a) productive and (b) nonproductive IgM sequences from a single healthy individual. Chord widths represent the proportion of sequences with a given V (colored) and J (gray) segment pairing. The five most common V segments in productive rearrangements (and all J segments) are labelled. Note that IGHV3-23/IGHJ4 was significantly more common in productive versus nonproductive rearrangements, which may indicate functional bias of that pairing. The figure was generated from data in Elhanati et al. (2015), which was aligned to the IMGT reference (Lefranc et al. 2009) using IgBLAST (Ye et al. 2013). Productive rearrangements were subsampled to the same read depth as nonproductive rearrangements (∼2 × 10⁵ reads); the values displayed in (a) are means of 100 subsampling repetitions.
F<sc>ig</sc>. 2
Fig. 2
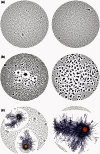
Network diagrams that visualize the diversity and clonal structure of BCR sequences. BCR sequences were obtained from (a) two healthy people, (b) two individuals infected with HIV-1, sampled during early infection, and (c) two patients with chronic lymphocytic leukemia, a B-cell cancer. Each point/circle represents a unique BCR sequence, the size of which is proportional to how common that sequence is. Edges are drawn between pairs of sequences that differ by exactly one nucleotide change. Note that samples do differ by read depth (approximately 3.4 × 10⁴ and 3.6 × 10⁴ for part [a], 9.2 × 10⁴ and 3.6 × 10⁵ for part [b], 5.1 × 10⁴ and 2.6 × 10⁴ for part [c]). Parts (a) and (c) are reproduced with permission from Bashford-Rogers et al. (2013) and part (b) from Hoehn et al. (2015).
F<sc>ig</sc>. 3
Fig. 3
Maximum-likelihood phylogenetic tree of the VRC01 BNAb lineage sampled at ten time points over 15 years of diversification within a single individual infected with HIV-1. Each tip represents a BCR heavy chain sequence; terminal branches are colored by time point of sampling (see key). The red circle at the root represents the germline sequence (IGHV1-2*02 and IGHJ1*01, D region left unassigned). Note the general, but not complete, trend of increasing genetic divergence from the root with sampling time. Late-sampled sequences near the root indicate very high rate heterogeneity among lineages; these sequences might represent inactive memory B cells. BNAb sequences were obtained through cell sorting (Wu et al. 2010) followed by high-throughput sequencing data to identify related BCRs (Zhou et al. 2013). See Wu et al. (2015) for full experimental details. Sequences for this tree were obtained from GenBank (Wu et al. 2015) and aligned using MUSCLE (Edgar 2004). A maximum-likelihood phylogeny was estimated using the GTRGAMMA substitution model in RAxML (Stamatakis 2014), and rerooted to position the germline sequence at the root with a divergence of zero. Scale bar represents genetic distance (expected changes per nucleotide site).
F<sc>ig</sc>. 4
Fig. 4
Observed mutation (sequence difference from germline) frequency among productive heavy chain immunoglobulin sequences across the V-gene sequence (horizontal axis, IMGT unique numbering). The distribution of mutations across the region is strongly nonuniform, with mutations more likely to occur at certain positions. The CDR2 region (middle shaded box) has a high rate of observed mutations and is thought to be more important in antigen binding than the surrounding framework regions (FWR2 and FWR3). This figure was generated from the same data set as figure 1.

References

    1. Ademokun A, Wu Y-C, Martin V, Mitra R, Sack U, Baxendale H, Kipling D, Dunn-Walters DK. 2011. Vaccination-induced changes in human B-cell repertoire and pneumococcal IgM and IgA antibody at different ages. Aging Cell 10:922–930. - PMC - PubMed
    1. Alamyar E, Duroux P, Lefranc M-P, Giudicelli V. 2012. IMGT® tools for the nucleotide analysis of immunoglobulin (IG) and T cell receptor (TR) V-(D)-J repertoires, polymorphisms, and IG mutations: IMGT/V-QUEST and IMGT/HighV-QUEST for NGS. Methods Mol Biol. 882:569–604. - PubMed
    1. Bashford-Rogers RJM, Palser AL, Huntly BJ, Rance R, Vassiliou GS, Follows GA, Kellam P. 2013. Network properties derived from deep sequencing of human B-cell receptor repertoires delineate B-cell populations. Genome Res. 23:1874–1884. - PMC - PubMed
    1. Benichou J, Ben-Hamo R, Louzoun Y, Efroni S. 2012. Rep-Seq: uncovering the immunological repertoire through next-generation sequencing. Immunology 135:183–191. - PMC - PubMed
    1. Bercovici N, Duffour M-T, Agrawal S, Salcedo M, Abastado J-P. 2000. New methods for assessing T-cell responses. Clin Diagn Lab Immunol. 7:859–864. - PMC - PubMed

MeSH terms