Mycobacteria infect different cell types in the human lung and cause species dependent cellular changes in infected cells
- PMID: 26803467
- PMCID: PMC4724406
- DOI: 10.1186/s12890-016-0185-5
Mycobacteria infect different cell types in the human lung and cause species dependent cellular changes in infected cells
Abstract
Background: Mycobacterial infections remain a significant cause of morbidity and mortality worldwide. Due to limitations of the currently available model systems, there are still comparably large gaps in the knowledge about the pathogenesis of these chronic inflammatory diseases in particular with regard to the human host. Therefore, we aimed to characterize the initial phase of mycobacterial infections utilizing a human ex vivo lung tissue culture model designated STST (Short-Term Stimulation of Tissues).
Methods: Human lung tissues from 65 donors with a size of 0.5-1 cm(3) were infected each with two strains of three different mycobacterial species (M. tuberculosis, M. avium, and M. abscessus), respectively. In order to preserve both morphology and nucleic acids, the HOPE® fixation technique was used. The infected tissues were analyzed using histo- and molecular-pathological methods. Immunohistochemistry was applied to identify the infected cell types.
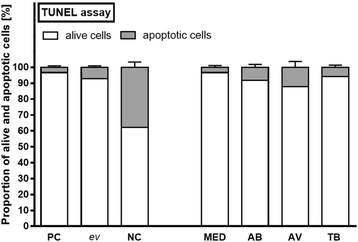
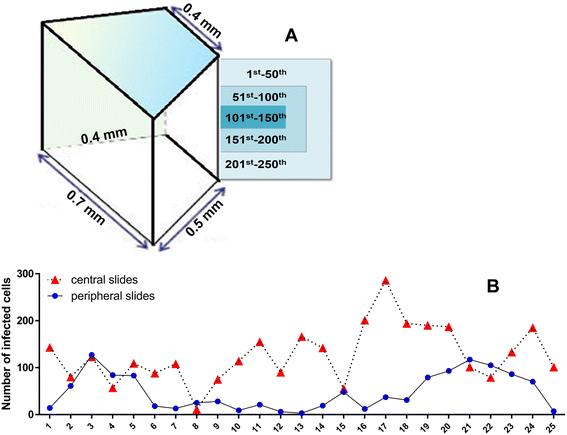
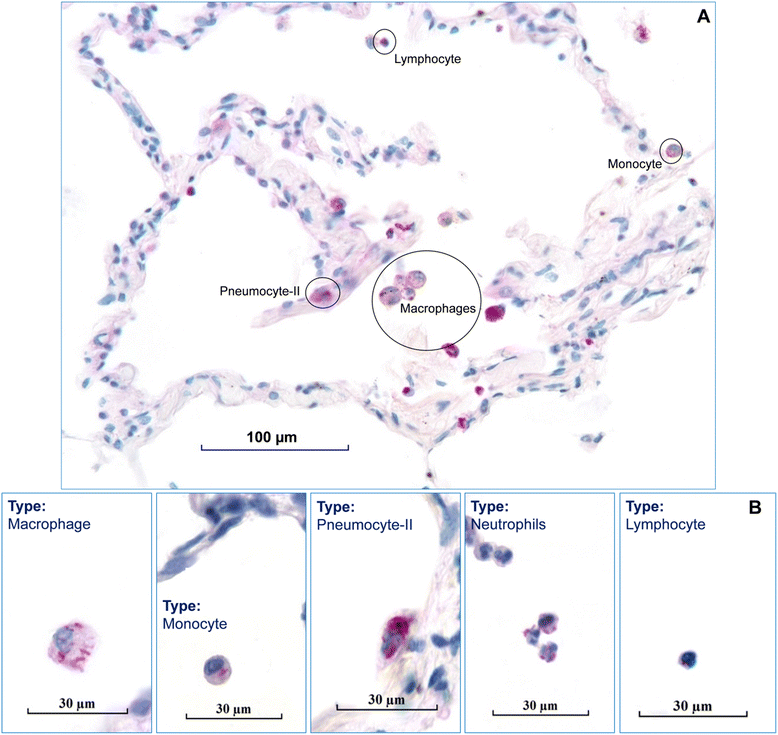
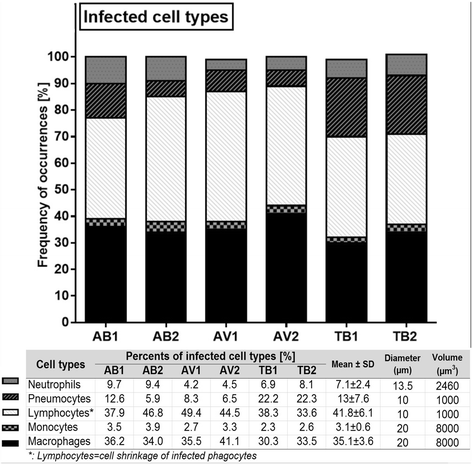
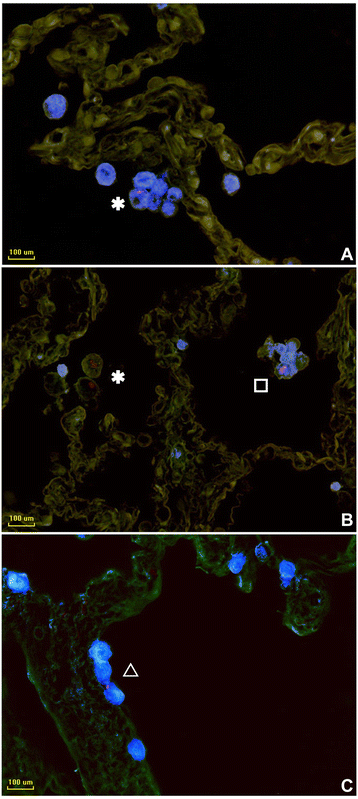
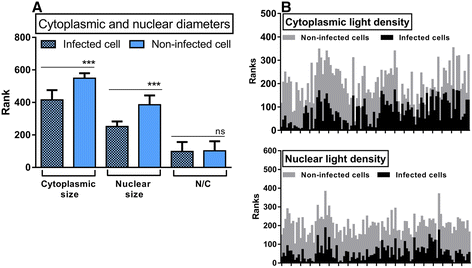
Results: Morphologic comparisons between ex vivo incubated and non-incubated lung specimens revealed no noticeable differences. Viability of ex vivo stimulated tissues demonstrated by TUNEL-assay was acceptable. Serial sections verified sufficient diffusion of the infectious agents deep into the tissues. Infection was confirmed by Ziel Neelsen-staining and PCR to detect mycobacterial DNA. We observed the infection of different cell types, including macrophages, neutrophils, monocytes, and pneumocytes-II, which were critically dependent on the mycobacterial species used. Furthermore, different forms of nuclear alterations (karyopyknosis, karyorrhexis, karyolysis) resulting in cell death were detected in the infected cells, again with characteristic species-dependent differences.
Conclusion: We show the application of a human ex vivo tissue culture model for mycobacterial infections. The immediate primary infection of a set of different cell types and the characteristic morphologic changes observed in these infected human tissues significantly adds to the current understanding of the initial phase of human pulmonary tuberculosis. Further studies are ongoing to elucidate the molecular mechanisms involved in the early onset of mycobacterial infections in the human lung.
Figures



Similar articles
-
Mediator responses of alveolar macrophages and kinetics of mononuclear phagocyte subset recruitment during acute primary and secondary mycobacterial infections in the lungs of mice.Cell Microbiol. 2007 Mar;9(3):738-52. doi: 10.1111/j.1462-5822.2006.00824.x. Epub 2006 Oct 18. Cell Microbiol. 2007. PMID: 17054437
-
[Frontier of mycobacterium research--host vs. mycobacterium].Kekkaku. 2005 Sep;80(9):613-29. Kekkaku. 2005. PMID: 16245793 Japanese.
-
Assessment of mycobacterial DNA in cells and tissues of mycobacterial and sarcoid lesions.Am J Respir Crit Care Med. 1996 Jan;153(1):375-80. doi: 10.1164/ajrccm.153.1.8542146. Am J Respir Crit Care Med. 1996. PMID: 8542146
-
Pathology of pulmonary tuberculosis and non-tuberculous mycobacterial lung disease: Facts, misconceptions, and practical tips for pathologists.Semin Diagn Pathol. 2017 Nov;34(6):518-529. doi: 10.1053/j.semdp.2017.06.003. Epub 2017 Jun 7. Semin Diagn Pathol. 2017. PMID: 28693908 Review.
-
[Development of antituberculous drugs: current status and future prospects].Kekkaku. 2006 Dec;81(12):753-74. Kekkaku. 2006. PMID: 17240921 Review. Japanese.
Cited by
-
Updated Review on the Mechanisms of Pathogenicity in Mycobacterium abscessus, a Rapidly Growing Emerging Pathogen.Microorganisms. 2022 Dec 29;11(1):90. doi: 10.3390/microorganisms11010090. Microorganisms. 2022. PMID: 36677382 Free PMC article. Review.
-
Ex vivo infection model for Francisella using human lung tissue.Front Cell Infect Microbiol. 2023 Jul 10;13:1224356. doi: 10.3389/fcimb.2023.1224356. eCollection 2023. Front Cell Infect Microbiol. 2023. PMID: 37492528 Free PMC article.
-
Antimicrobial Activity of Neutrophils Against Mycobacteria.Front Immunol. 2021 Dec 23;12:782495. doi: 10.3389/fimmu.2021.782495. eCollection 2021. Front Immunol. 2021. PMID: 35003097 Free PMC article. Review.
-
Human lung ex vivo infection models.Cell Tissue Res. 2017 Mar;367(3):511-524. doi: 10.1007/s00441-016-2546-z. Epub 2016 Dec 20. Cell Tissue Res. 2017. PMID: 27999962 Free PMC article. Review.
-
Ex vivo infection of murine precision-cut lung tissue slices with Mycobacterium abscessus: a model to study antimycobacterial agents.Ann Clin Microbiol Antimicrob. 2020 Nov 22;19(1):52. doi: 10.1186/s12941-020-00399-3. Ann Clin Microbiol Antimicrob. 2020. PMID: 33222688 Free PMC article.
References
-
- Organization WH: Global Tuberculosis Report 2014. World Health Organization; 2015.
Publication types
MeSH terms
LinkOut - more resources
Full Text Sources
Other Literature Sources
Medical

