. 2016 Feb 2;14(4):896-906.
doi: 10.1016/j.celrep.2015.12.083. Epub 2016 Jan 21.

Extremely Long-Range Chromatin Loops Link Topological Domains to Facilitate a Diverse Antibody Repertoire

Affiliations

Extremely Long-Range Chromatin Loops Link Topological Domains to Facilitate a Diverse Antibody Repertoire

Lindsey Montefiori et al. Cell Rep. .

Abstract

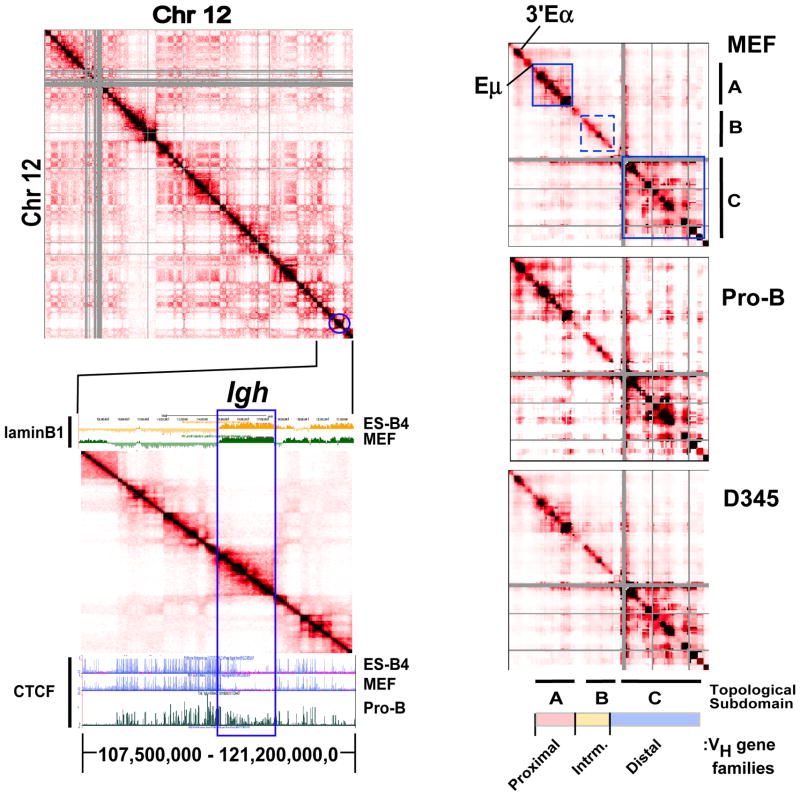
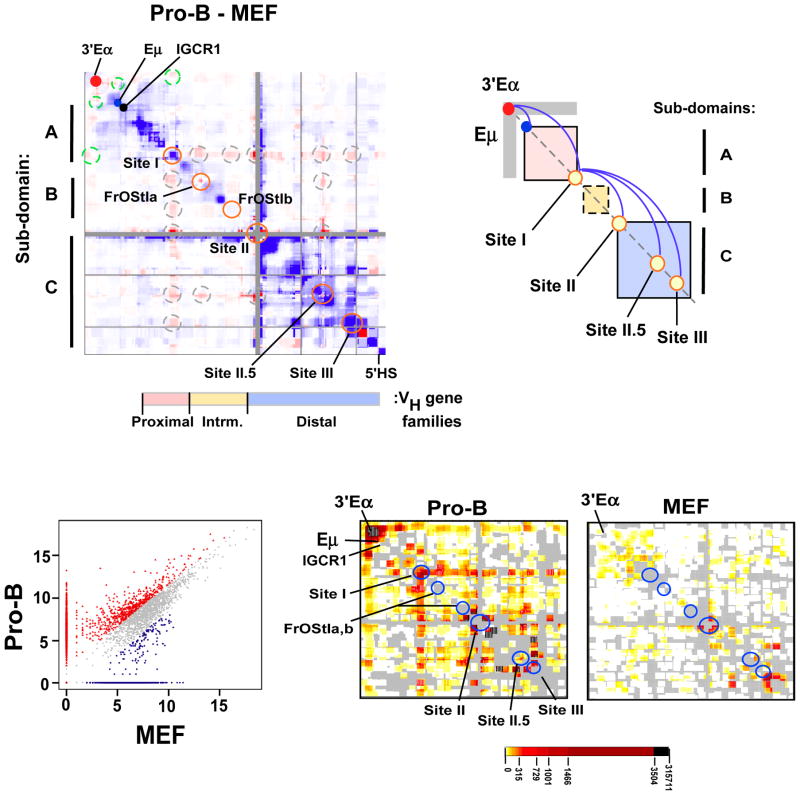
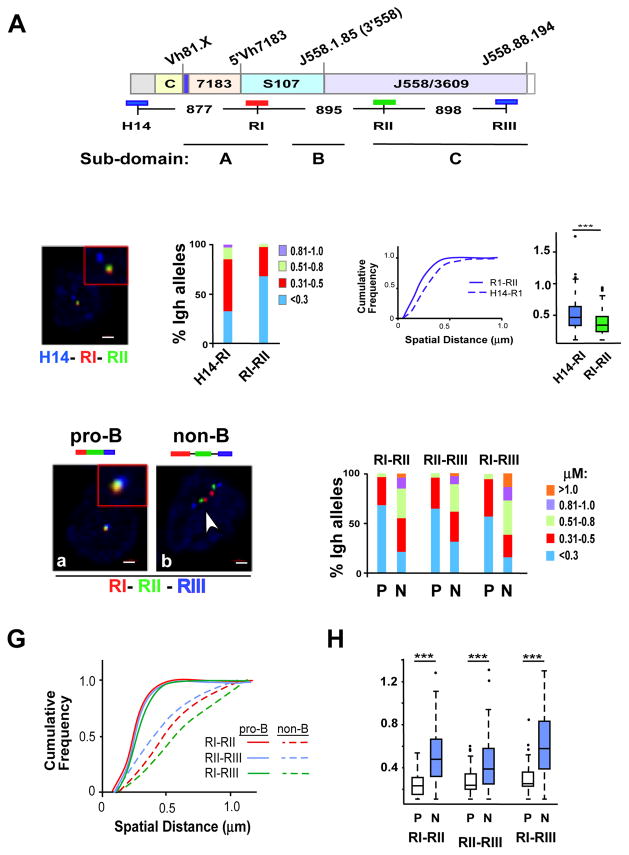
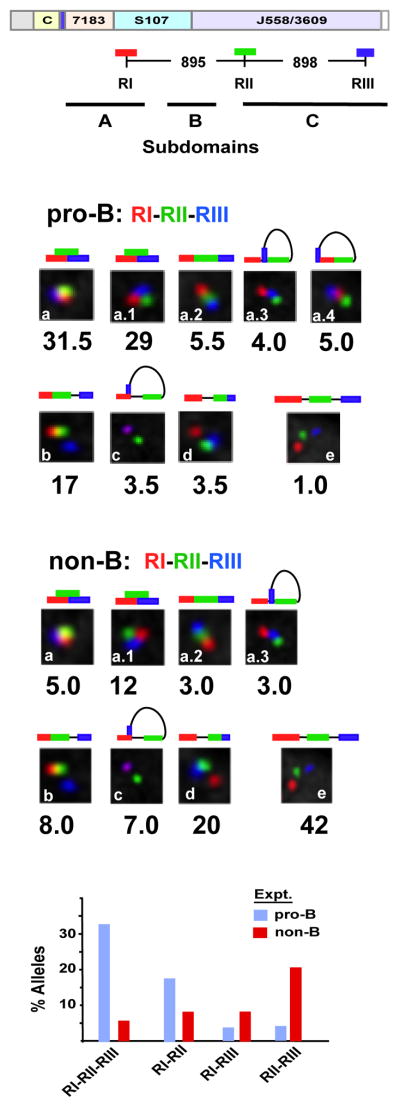
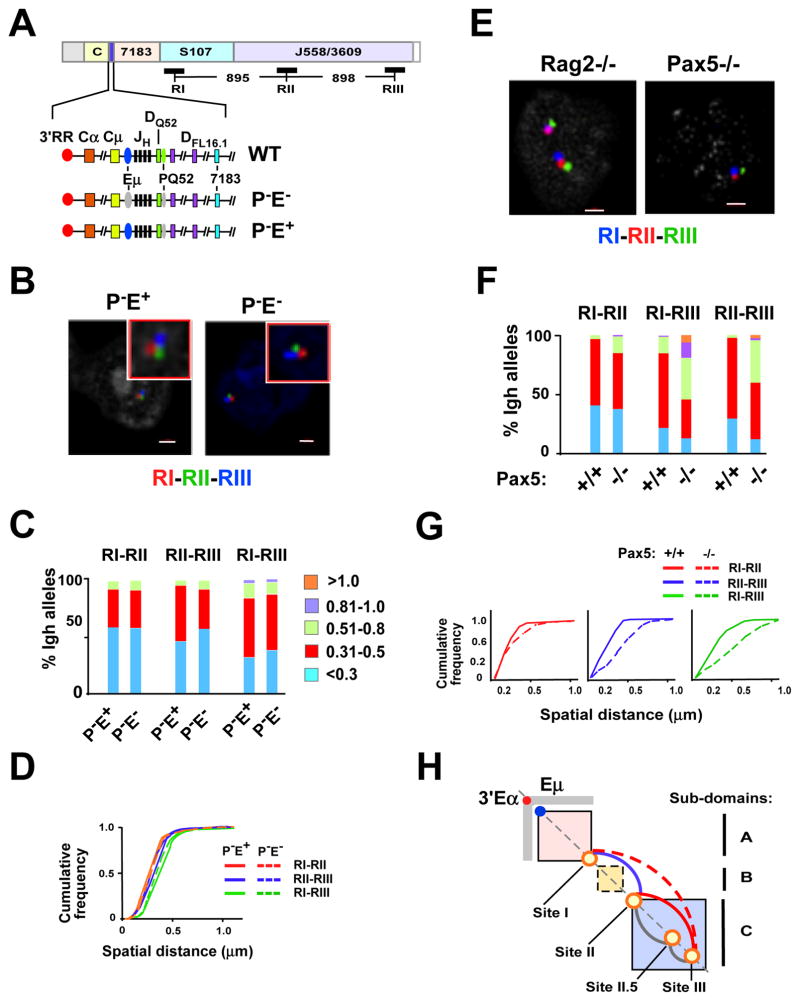
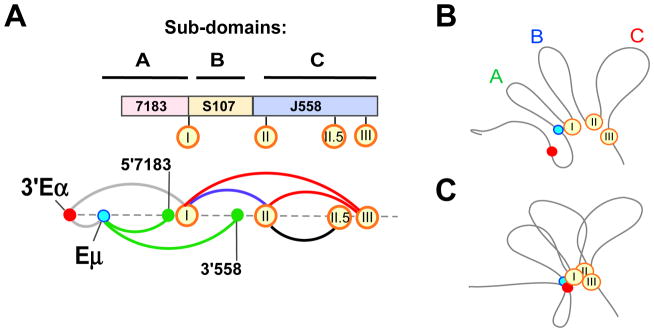
Early B cell development is characterized by large-scale Igh locus contraction prior to V(D)J recombination to facilitate a highly diverse Ig repertoire. However, an understanding of the molecular architecture that mediates locus contraction remains unclear. We have combined high-resolution chromosome conformation capture (3C) techniques with 3D DNA FISH to identify three conserved topological subdomains. Each of these topological folds encompasses a major VH gene family that become juxtaposed in pro-B cells via megabase-scale chromatin looping. The transcription factor Pax5 organizes the subdomain that spans the VHJ558 gene family. In its absence, the J558 VH genes fail to associate with the proximal VH genes, thereby providing a plausible explanation for reduced VHJ558 gene rearrangements in Pax5-deficient pro-B cells. We propose that Igh locus contraction is the cumulative effect of several independently controlled chromatin subdomains that provide the structural infrastructure to coordinate optimal antigen receptor assembly.


Conflict of interest statement

The authors declare that they have no competing financial interests.

Figures

Figure 1
Figure 1. The Igh locus partitions into a 2.9 Mb TAD and conserved topological sub-domains
A) (Upper panel) Normalized HiC interaction frequencies from an AMuLV pro-B cell line (adapted from Zhang et al 2012 (Zhang et al., 2012)) representing chromosome 12 is displayed as a 2D heatmap binned at 100 kb resolution. HiC sequencing reads are indicated by the color (red) intensity from interacting pairs of Hind III fragments. Gray pixels indicate areas of low uniquely mapped reads or regions with many large restriction fragments (>100 kb). (Lower panel) HiC data from chromosome 12 (107,500,000–121,200,000,0; mm9) is shown aligned to a UCSC Genome Browser snap-shot showing ChIP-seq for CTCF (Lin et al., 2012) and Dam-ID lamin B1 data (Peric-Hupkes et al., 2010) in the indicated cell types. B) 5C analyses of the 2.9 Mb Igh locus in MEF, Rag deficient pro-B cells and the AMuLV pro-B cell line, D345. Normalized 5C data underwent binning analysis (bin size, 150,000 kb; step size,15 kb). Topological sub-domains A, and C are indicated by the solid blue outline and B by dashed blue lines). The heat maps are scaled as follows: MEF 37–1840, Rag2−/− pro B cells: 19–1254, D345: 89–6355.
Figure 2
Figure 2. Developmentally programmed reorganization of the Igh locus chromatin architecture in pro-B cells
A) A difference plot (pro-B cells minus MEF) was calculated using normalized 5C signals (150 kb bins, 15 kb step). Elevated 5C reads in pro-B (red intensities), or MEF (blue intensities) or constitutive (white). Dots are: 3′Eα (red), Eμ (blue) and IGCR1 (black). Looping interactions associated with 3′Eα (dashed green circles). Sites I (115,100,000–115,239,000; 139kb), II (115,949,000–116,069,000; 120kb), II.5 (116,665,000–116,770,000; 105kb), III (116,784,000–116,874,000; 90kb) and FrOStIa (115,411,000–115,451,000; 40kb), FrOStIb (115,819,000–115,859,000; 40kb) are indicated along the diagonal (orange circles) and looping interactions off the diagonal are shown (dashed gray circles). Genomic coordinates are chr12, mm9. VH gene families and topological sub-domains A–C are indicated. B) A diagram of topological sub-domains A (pink), B (yellow), C (blue) boxes with Eμ and 3′Eα, as indicated. Sites I–III are shown (yellow circles). Gray rectangular arms extending from 3′Eα indicate increased interactions in pro-B cells. The pro-B cell specific loops (blue arches). C) Scatterplot of 5C interactions (colored dots) (constitutive, gray; pro-B cell, red; MEF, blue). Cell type specific interactions were >3-fold above the constitutive frequency (see Suppl. Methods). D) The pro-B and MEF specific 5C interactions defined in (B) are plotted as 2D heatmaps (100 kb bins, 10kb step). The frequency of 5C reads is indicated by the color key and gray indicates the absence of interactions.
Figure 3
Figure 3. Sites I, II and III are loop attachment sites in pro-B cells
A) Diagram of the C57Bl/6 Igh locus is shown with genomic distances (Johnston et al., 2006). The BAC probes used in FISH studies are indicated by the blue, red and green lines below the Igh locus. Topological sub-domains A (114,665,117–115,239,000), B (115,239,000–115,949,000), and C (116,069,000–116,874,000) and all genomic coordinates are chr12, mm9. The Igh locus contains approximately 100 VH gene segments that span 2.4 Mb. The interspersed distal VH segments at the 5′-end of the locus are comprised of the J558 and 3609 families. The 7183 family is located at the proximal end of the locus. The intermediate VH segments are comprised of the S107 family along with 9 smaller VH families. Representative VH gene segments are positioned above the locus, Vh81.X (Vh7183.2.3; 114816717–114817010), 5’7183 (Vh7183.20.37; 115097360–115097653), 3’558 (VhJ558.1.85; 115707286–115707582), (VhJ558.88.194; 117238239–117238532). The vertical blue bar on the locus located between the constant region genes (CH) and 7183 VH segments contains the joining (JH) and diversity (DH) gene segments. The CH genes encode Igh isotypes and span an additional 220kb. Not shown: Eμ is located between the JH and CH gene segments and 3′Eα an enhancer at the 3′-end of the locus. B) Three color FISH using purified bone marrow Rag2 deficient pro-B cells. BAC probes are indicated in (A), and color-coded as indicated. A representative nucleus is shown. Probes labeled with Alexa Fluor 594 (red), 488 (green) and Alexa Fluor 697 (blue) were hybridized to fixed pro-B cells. Probe signals were from epifluorescence microscopy and the distances between probes were computed as described (Jhunjhunwala et al., 2008). Probes combinations were red and green (RI–RII), red and blue (H14-RI). C) Quantitation of FISH data. The distance between the red, green and blue FISH signals shown in (B) for 100–300 alleles were divided into 4 categories: <0.3, 0.31–0.5, 0.51–0.8, 0.81–1.0 μm. The percentage of Igh alleles in each category was determined (y axis) for each probe combination and is represented in different colors. Probe combinations are indicated on the x-axis below the histograms. Purified pro-B cells from at least three mice were used for each experiment. D) (Left panel) Cumulative frequency analyses are for each probe combination. (Right panel) Boxplots indicate the first and third quartiles and the band inside the box is the median distance between the probes. The whiskers indicate the 9th and 91st percentiles for probe distances and outliers are indicated by the dots. P values were calculated using the Mann-Whitney U test. *** indicates p < 0.0001. E) Three color FISH using purified BM pro-B and non-B cells on the Rag2 deficient background. Cells are from at least three mice. BAC probes are shown in (A). Probes combinations were red and green (RI–RII), red and blue (RI–RIII) and green and blue (RII–RIII). F) Quantitation of FISH data. 3D FISH signals shown in (E) for ~100–300 alleles were quantitated as described in (C). Probe combinations are shown above the histograms. G,H) P values are calculated in Kolmogorov-Smirnov and the Wilcoxon tests (see Table S6). Cumulative frequency analyses (G) and boxplots (H) are shown for each probe combination in each cell type.
Figure 4
Figure 4. Sites I-II-III are selectively superimposed in pro-B cells
Three color FISH data for ~200 nuclei for each probe set. Allele configurations and probe distances are defined in Figure S6. Purified pro-B cells from at least three mice for each of two experiments. P values are derived in Kolmogorov-Smirnov and the Wilcoxon tests (see Table S6). A) A schematic of the WT Igh locus with genomic distances between BAC probes. The probes combinations are RI (red), RII (green) and RIII (blue). The topological sub-domains A, B and C that are derived from the 5C studies shown in Figure 2 are arrayed at bottom. B,C) BAC probes RI, RII and RIII, labeled as indicated, were hybridized simultaneously to Rag2-deficient pro-B cells (B) or non-B cells (C) from bone marrow of Rag2-deficient mice. The percentage of Igh alleles in various spatial configurations as schematized above each inset is indicated. D) Histograms summarizing the three color FISH results shown in (b) and (c) using the probe combinations RI, RII and RIII for pro-B cells (blue bars) and non-B lineage cells (red bars) (x-axis). The percentage of alleles in which two- or three-probes are superimposed or in very close contact are indicated (y axis).
Figure 5
Figure 5. Locus contraction mediated by Sites I-II-III is Eμ independent but requires Pax5
A) A diagram of the Igh locus indicates the location and distances between the three FISH probes RI, RII and RIII. The lower three lines show an expanded section of the Igh locus from 3′RR through the DH cluster and ending with the proximal VH gene segment, 7183. Eμ (blue oval) is a transcription enhancer located in the JH-Cμ intron and PQ52 (green oval) is a promoter associated with the 3′ most DH gene segment, DQ52. Deletions of PQ52 (P−) and/or Eμ (E−) are indicated (gray ovals). B) Three color FISH using purified Rag deficient pro-B cells that are deleted for PQ52 (P-E+) and for both PQ52 and Eμ (PE−). BAC probes are RI (red), RII (green) and RIII (blue). A representative nucleus is shown for each genotype. Probes contacts were red and green (RI–RII), red and blue (RI–RIII) and green and blue (RII–RIII). C) Quantitation of FISH data. The distance between the red, green and blue FISH signals shown in (B) for ~200 nuclei were divided into 5 categories: <0.3, 0.31–0.5, 0.51–0.8, 0.81–1.0, >1.0 μm. The percentage of Igh alleles in each category (y axis) for each Igh genotype (x-axis) is represented in different colors. Probe combinations are shown above the histograms. Purified pro-B cells from at least three mice were used for each experiment. Data are from at least two independent experiments. D) Cumulative frequency analyses are shown for each probe combination and the genotypes are indicated. P values are defined by Kolmogorov-Smirnov and Wilcoxon tests (see Table S6). E) Three color FISH using Rag2−/− or Pax5−/− pro-B cells and BAC probes are as in (A) and were labeled as follows: RI (blue), RII (red) and RIII (green). Representative nuclei from each genotype are shown. F) Distances between the probe signals were analyzed in ~100 nuclei. G) Cumulative frequency analyses are shown. P values are summarized in Table S6. H) A diagram of Igh topological subdomains A (pink box), B (yellow box) and C (blue box). Eμ (blue dot), 3′Eα (red dot) and Sites I, II, II.5 and III (orange circles) are located along the diagonal. The gray rectangular arms extending from 3′Eα indicate increased 5C interactions in pro-B cells. Loops that anchored at Sites I, II, II.5 and III and that are Pax5-dependent (red, dashed red), Pax5-independent (blue), and not tested (gray).
Figure 6
Figure 6. Site I coordinates VH locus contraction
A) (Top) Topological sub-domains A–C and VH gene families are drawn approximately to scale. Sites I, II, II.5 and III (orange circles) are aligned with their positions in topological subdomains and with respect to VH gene families. (Bottom) Meta-looping interactions anchored at Sites I, II, II.5 and III (orange circles) are Pax5-dependent (red arc), independent (blue arc) and not tested (black arc). Eμ-dependent loops (green arcs) (Guo et al., 2011a). 3′Eα loops (gray arc) with Eμ (Kumar et al., 2013) and Site I. B,C) Diagrams of sub-domain A, B and C. Sites I, II, and III (orange circles). Dots indicate 3′Eα (red), Eμ (teal). B) Non-B cells: topological sub-domains A, B and C are in an extended configuration. C) In pro-B cells, Site I loops with Sites II and III and with Eμ and 3′Eα to contract the locus.

Comment in

  • The Ties that Bind (the Igh Locus).
    Krangel MS. Krangel MS. Trends Genet. 2016 May;32(5):253-255. doi: 10.1016/j.tig.2016.03.003. Epub 2016 Mar 21. Trends Genet. 2016. PMID: 27012539 Free PMC article.

Similar articles

Cited by

References

    1. Afshar R, Pierce S, Bolland DJ, Corcoran A, Oltz EM. Regulation of IgH gene assembly: role of the intronic enhancer and 5′DQ52 region in targeting DHJH recombination. J Immunol. 2006;176:2439–2447. - PubMed
    1. Belmont AS. Large-scale chromatin organization: the good, the surprising, and the still perplexing. Curr Opin Cell Biol. 2014;26:69–78. - PMC - PubMed
    1. Bickmore WA, van Steensel B. Genome architecture: domain organization of interphase chromosomes. Cell. 2013;152:1270–1284. - PubMed
    1. Bredemeyer AL, Sharma GG, Huang CY, Helmink BA, Walker LM, Khor KC, Nuskey B, Sullivan KE, Pandita TK, Bassing CH, Sleckman BP. ATM stabilizes DNA double-strand-break complexes during V(D)J recombination. Nature. 2006;442:466–470. - PubMed
    1. Cuddapah S, Jothi R, Schones DE, Roh TY, Cui K, Zhao K. Global analysis of the insulator binding protein CTCF in chromatin barrier regions reveals demarcation of active and repressive domains. Genome Res. 2009;19:24–32. - PMC - PubMed

Publication types