. 2016 Jan 28;164(3):538-49.
doi: 10.1016/j.cell.2015.12.050. Epub 2016 Jan 21.

Mutational Strand Asymmetries in Cancer Genomes Reveal Mechanisms of DNA Damage and Repair

Affiliations

Mutational Strand Asymmetries in Cancer Genomes Reveal Mechanisms of DNA Damage and Repair

Nicholas J Haradhvala et al. Cell. .

Abstract

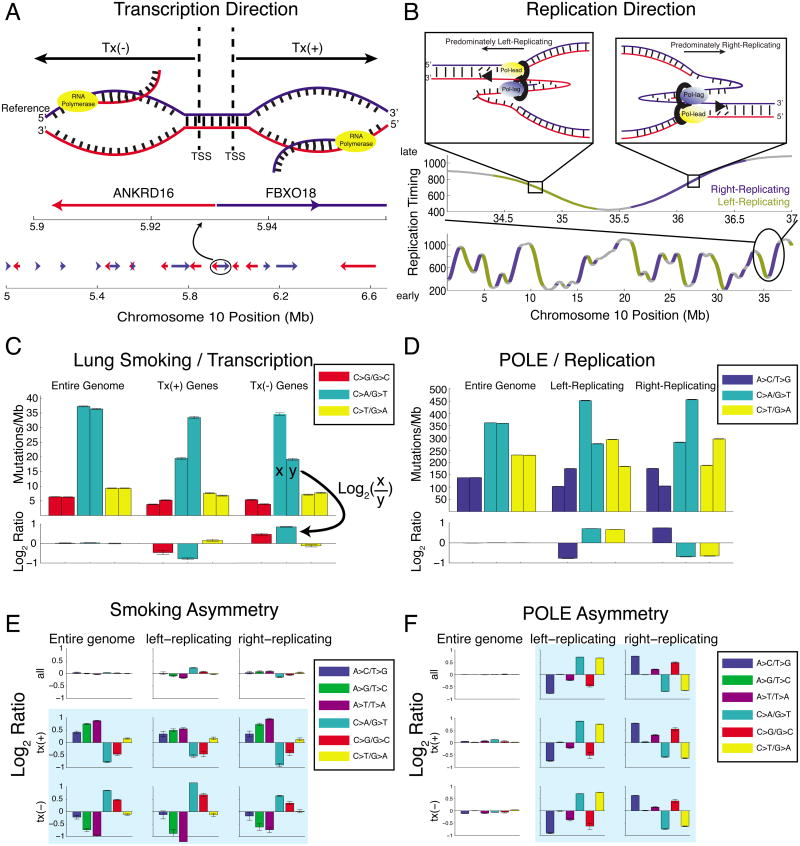
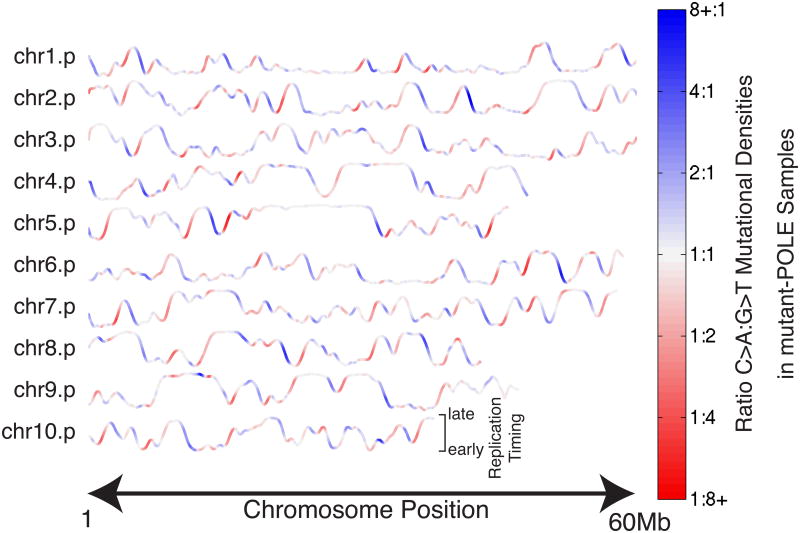
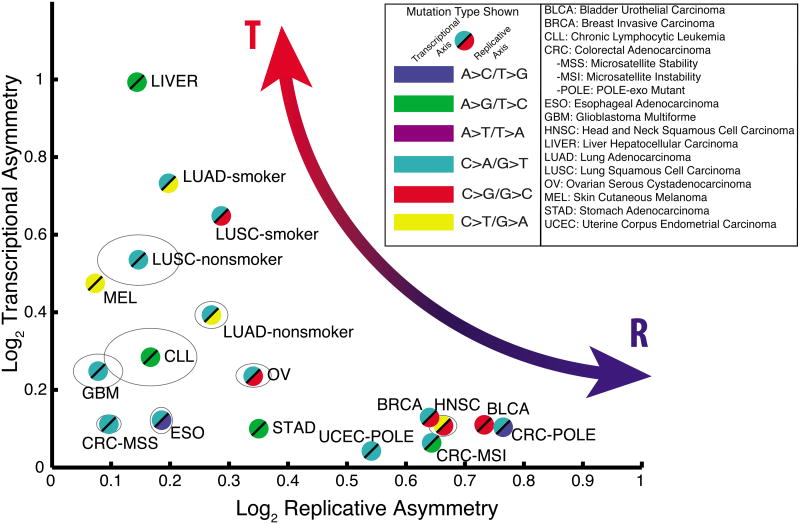
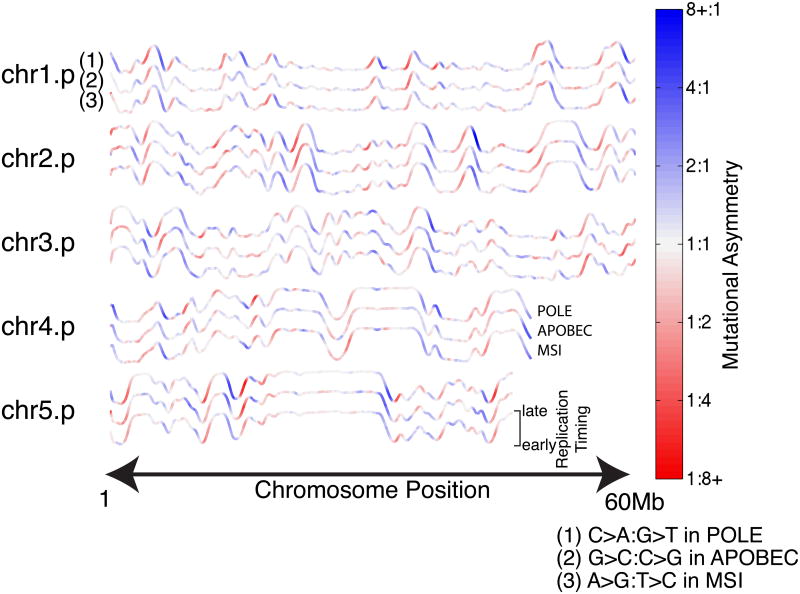
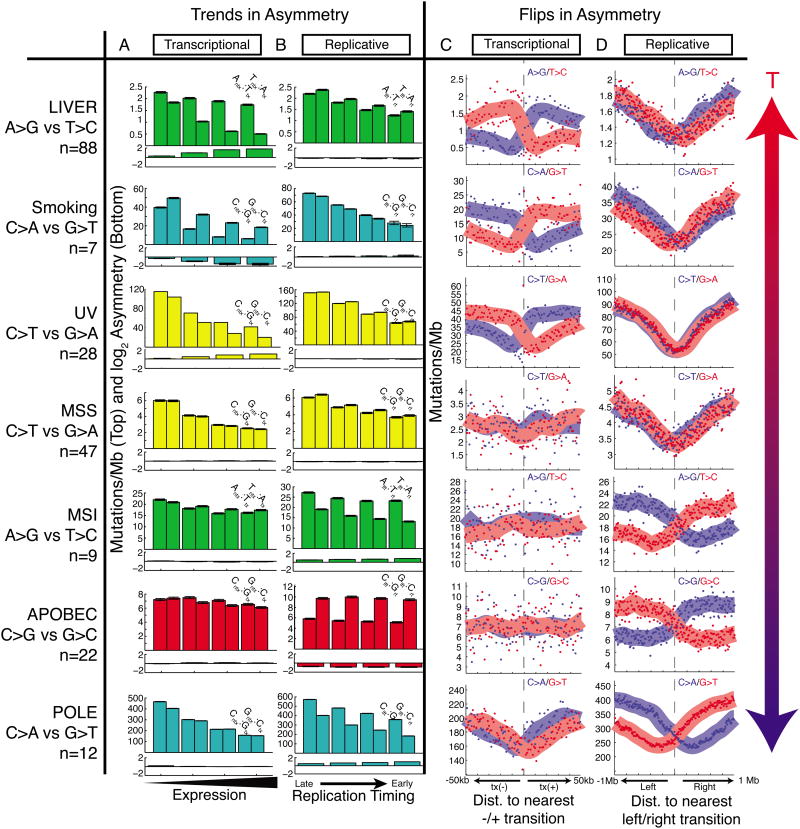
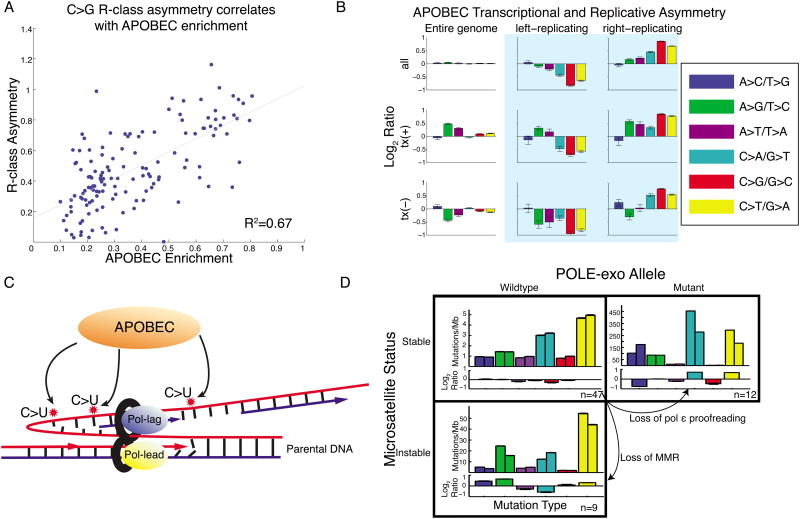
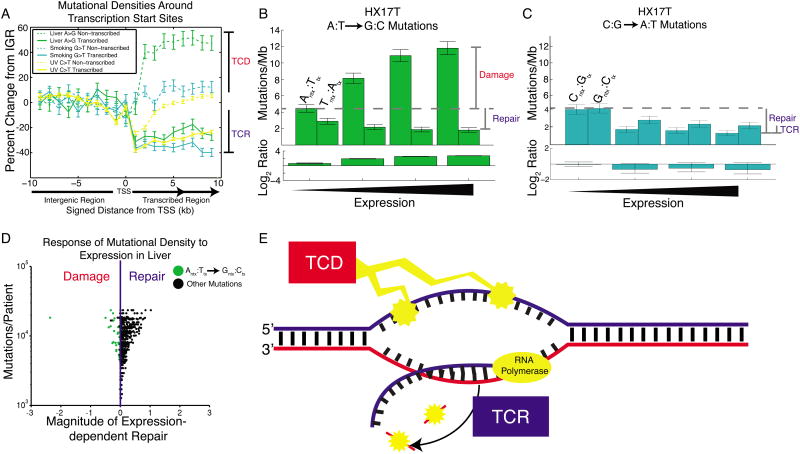
Mutational processes constantly shape the somatic genome, leading to immunity, aging, cancer, and other diseases. When cancer is the outcome, we are afforded a glimpse into these processes by the clonal expansion of the malignant cell. Here, we characterize a less explored layer of the mutational landscape of cancer: mutational asymmetries between the two DNA strands. Analyzing whole-genome sequences of 590 tumors from 14 different cancer types, we reveal widespread asymmetries across mutagenic processes, with transcriptional ("T-class") asymmetry dominating UV-, smoking-, and liver-cancer-associated mutations and replicative ("R-class") asymmetry dominating POLE-, APOBEC-, and MSI-associated mutations. We report a striking phenomenon of transcription-coupled damage (TCD) on the non-transcribed DNA strand and provide evidence that APOBEC mutagenesis occurs on the lagging-strand template during DNA replication. As more genomes are sequenced, studying and classifying their asymmetries will illuminate the underlying biological mechanisms of DNA damage and repair.


Figures

Figure 1
Figure 1. Mutational strand asymmetry associated with transcription (left) and replication (right)
(A) Transcription direction: Tx(+) regions carry the coding sequence of a gene on the genomic reference strand, and Tx(-) regions on the genomic complement strand. (B) Replication direction: positive slope in replication-timing data indicates general rightward movement of the replication complex (“right-replicating”), while negative slope indicates left-replicating. (C) Lung cancers show strong transcriptional (“T-class”) asymmetry. Each pair of bars (upper axis) shows the density of mutations at C:G (left bar) and G:C (right bar) base pairs. When summing across the entire genome, base-pair orientation does not affect mutational densities. In tx(+) regions, G:C base pairs show a higher density of G→T transversions than C:G base pairs; the opposite is true in tx(-) regions. Lower axis shows the log2 ratio of each pair of bars. (D) POLE-mutant cancers (colorectal and endometrial) show strong replicative (“R-class”) asymmetry. Left-replicating regions show a higher density of mutations at C:G base pairs, and right-replicating regions at G:C. (E) Lung cancers show strong T-class asymmetry but little R-class. (F) POLE-mutant cancers show strong R-class strand asymmetry but little T-class.
Figure 2
Figure 2. Strand asymmetry in POLE-mutant cancers reflects directionality of DNA replication timing-transition regions (TTRs)
Replication timing profiles are shown for the p-arms (up to 60Mb) of the first ten chromosomes. Profiles are colored by the local ratio of C→A to G→T mutations in a cohort of 12 mutant-POLE genomes (colorectal and endometrial). Strikingly, late-to-early TTRs (where slope is negative) frequently have a strong bias towards C→A mutations (blue), consistent with leading-strand synthesis using the reference strand as template. Conversely, early-to-late TTRs (positive slopes) show bias towards G→T mutations (red), consistent with lagging-strand synthesis using the reference strand as template(Shinbrot et al., 2014).
Figure 3
Figure 3. Cancer cohorts vary widely across the asymmetry map
For each cohort listed, the maximal replicative asymmetry (x-axis) and the maximal transcriptional asymmetry (y-axis) were measured and plotted. Grey ellipses denote 95% confidence intervals for cohorts in which these extend beyond the bounds of the plot symbols.
Figure 4
Figure 4. Replicative asymmetry is concordant across three distinct R-class mutational processes
Color representing mutational asymmetry is overlaid on replication timing profiles as in Fig. 2. Profiles are shown in triplets colored by: (1) C→A:G→T asymmetry in 12 mutant-POLE colorectal and endometrial genomes; (2) G→C:C→G asymmetry in 22 APOBEC-enriched bladder, breast, and head-and-neck genomes; and (3) A→G:T→C asymmetry in 9 MSI-associated colon genomes.
Figure 5
Figure 5. Trends and flips in asymmetry
(A) Transcriptional strand asymmetry measured across four quartiles of expression levels. Total mutation density tends to decrease with expression level, and T-class asymmetry (liver, smoking, UV) is maximal at highest expression. (B) Replicative strand asymmetry measured across four quartiles of replication timing. Total mutational density tends to decrease with earlier replication, and R-class asymmetry (MSI, APOBEC, POLE) is maximal at earliest replication. (C) Strand-specific mutational density measured in the vicinity of bidirectional promoters. T-class asymmetry flips at transitions from tx(-) to tx(+) regions. (D) Strand-specific mutational density measured in the vicinity of replication timing minima. R-class asymmetry flips at these left-to right transitions.
Figure 6
Figure 6. R-class asymmetries associated with APOBEC and MSI
(A) Bladder, breast, and head-and-neck cohorts. Samples with highest enrichment of APOBEC signature show highest replicative asymmetry of C→G mutations. (B) APOBEC-enriched samples are dominated by replicative asymmetry (as Fig. 1E,F) (C) Proposed model: APOBEC deaminates cytosine to uracil on the ssDNA of the lagging-strand template during DNA replication. (D) R-class asymmetry in MSS, MSI, and POLE-mutant cohorts. MSS samples have little asymmetry. Loss of MMR or pol ε proofreading leads to imbalance in mutations between the leading and lagging strands.
Figure 7
Figure 7. Transcription-coupled damage in liver cancer
(A) Mutational densities in the vicinity of promoters. When crossing from non-transcribed regions (IGR) to transcribed regions, mutational densities on the transcribed strand fall, reflecting transcription-coupled repair (TCR). On the non-transcribed strand there is usually little change from IGR levels, with the notable exception of liver cancer, where mutational densities increase from IGR levels, consistent with transcription-coupled damage (TCD). (B) Liver cancer patient HX17T shows a dramatic expression-dependent increase in A→G mutational densities on the non-transcribed strand only. (C) In the same patient, G→T mutational densities show only the usual expression-dependent decrease, on both strands. (D) Most liver patients show dominant TCR. However, for A→G mutations on the non-transcribed strand (green dots), some show the opposite trend, reflecting dominant TCD. The leftmost dot is patient HX17T. (E) TCD damages the non-transcribed strand, exposed as ssDNA during transcription. TCR repairs the transcribed strand. Both of these processes contribute to T-class asymmetry.

References

    1. Alexandrov LB, Nik-Zainal S, Wedge DC, Aparicio SA, Behjati S, Biankin AV, Bignell GR, Bolli N, Borg A, Borresen-Dale AL, et al. Signatures of mutational processes in human cancer. Nature. 2013;500:415–421. - PMC - PubMed
    1. Bass AJ, Lawrence MS, Brace LE, Ramos AH, Drier Y, Cibulskis K, Sougnez C, Voet D, Saksena G, Sivachenko A, et al. Genomic sequencing of colorectal adenocarcinomas identifies a recurrent VTI1A-TCF7L2 fusion. Nat Genet. 2011;43:964–968. - PMC - PubMed
    1. Bhagwat AS, Hao W, Townes JP, Lee H, Tang H, Foster PL. Strand-biased Cytosine deamination at the Replication Fork causes Cytosine to Thymine Mutations in Escherichia coli (PNAS) 2016 - PMC - PubMed
    1. Carreras Puigvert J, Sanjiv K, Helleday T. Targeting DNA repair, DNA metabolism and replication stress as anti-cancer strategies. FEBS J 2015 - PubMed
    1. Chapman MA, Lawrence MS, Keats JJ, Cibulskis K, Sougnez C, Schinzel AC, Harview CL, Brunet JP, Ahmann GJ, Adli M, et al. Initial genome sequencing and analysis of multiple myeloma. Nature. 2011;471:467–472. - PMC - PubMed

Publication types