. 2016 Jan 28;164(3):365-77.
doi: 10.1016/j.cell.2016.01.002. Epub 2016 Jan 21.

Cancer Immunosurveillance by Tissue-Resident Innate Lymphoid Cells and Innate-like T Cells

Affiliations

Cancer Immunosurveillance by Tissue-Resident Innate Lymphoid Cells and Innate-like T Cells

Saïda Dadi et al. Cell. .

Abstract

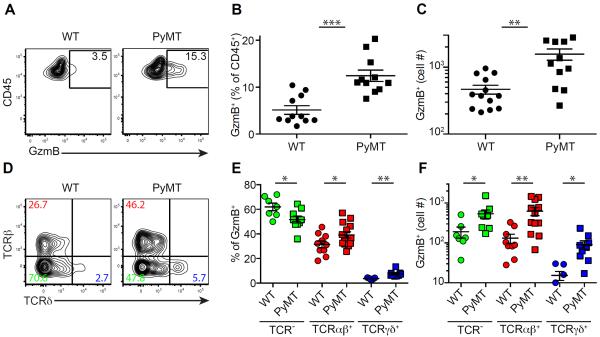
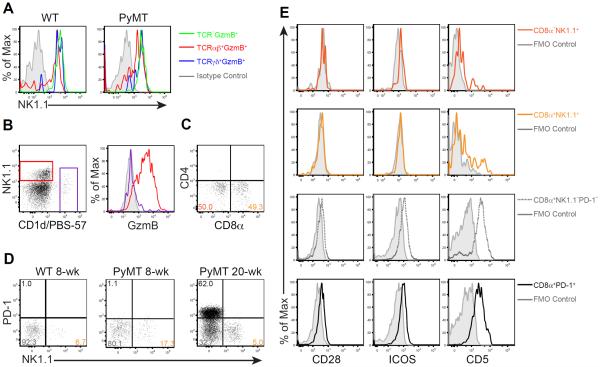
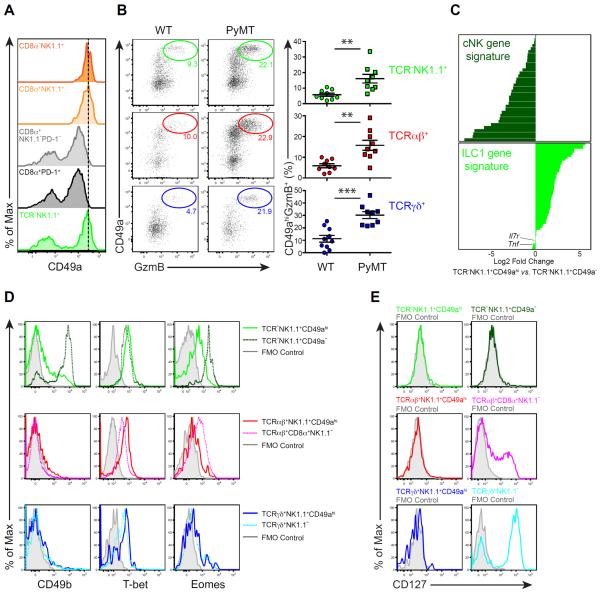
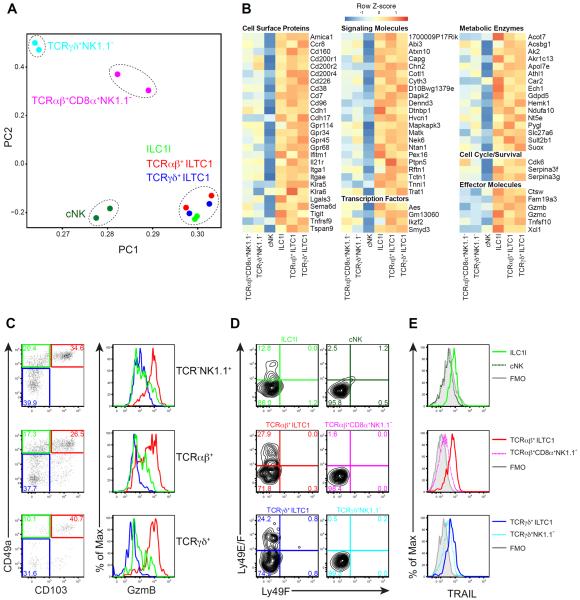
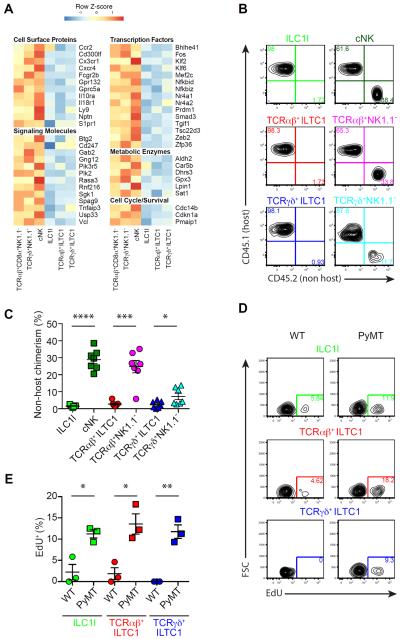
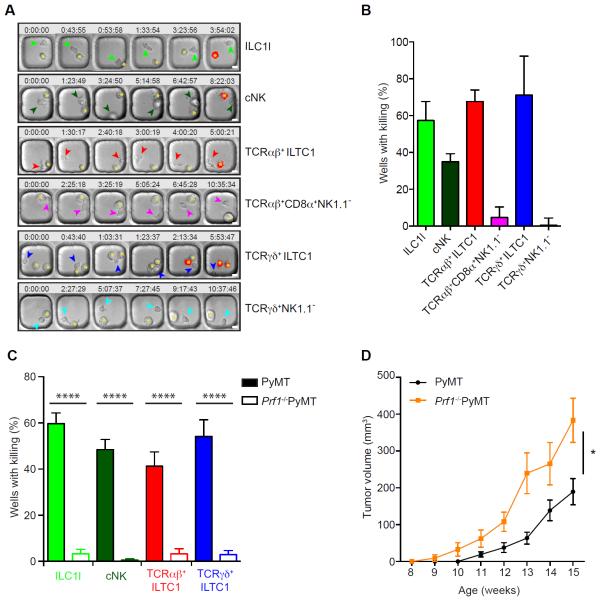
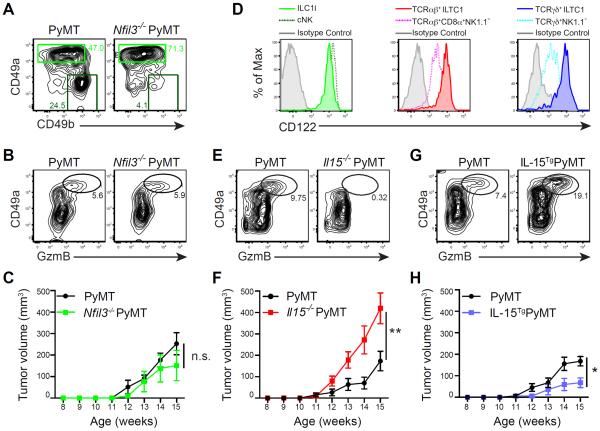
Malignancy can be suppressed by the immune system in a process termed immunosurveillance. However, to what extent immunosurveillance occurs in spontaneous cancers and the composition of participating cell types remains obscure. Here, we show that cell transformation triggers a tissue-resident lymphocyte response in oncogene-induced murine cancer models. Non-circulating cytotoxic lymphocytes, derived from innate, T cell receptor (TCR)αβ, and TCRγδ lineages, expand in early tumors. Characterized by high expression of NK1.1, CD49a, and CD103, these cells share a gene-expression signature distinct from those of conventional NK cells, T cells, and invariant NKT cells. Generation of these lymphocytes is dependent on the cytokine IL-15, but not the transcription factor Nfil3 that is required for the differentiation of tumor-infiltrating NK cells, and IL-15 deficiency, but not Nfil3 deficiency, results in accelerated tumor growth. These findings reveal a tumor-elicited immunosurveillance mechanism that engages unconventional type-1-like innate lymphoid cells and type 1 innate-like T cells.


Figures

Figure 1
Figure 1. Precancerous lesions elicit an immune response characterized by GzmB B expression
(A–C) Flow cytometric analysis of granzyme B (GzmB) expression in CD45+ leukocytes from pooled mammary glands of wild-type (WT) and 8-week-old PyMT mice with percentage (A–B) and absolute number (C) of CD45+GzmB+ cells. Data are representative of ten independent experiments. (D–F) Flow cytometric analysis of TCRβ and TCRδ expression in CD45+GzmB+ subsets isolated from pooled mammary glands of WT and 8-week-old PyMT mice with percentage (D–E) and absolute number (F) of GzmB+ cells that are TCR (green), TCRβ+ (red) or TCRδ+ (blue). Data are representative of five independent experiments. Each symbol denotes an individual mouse. Error bars represent the mean ± SEM. Two-tailed unpaired t-test was used for statistical analysis. *P<0.05, **P<0.01, ***P<0.001. See also Figure S1.
Figure 2
Figure 2. Tumor-associated GzmB-expressing T cells are unconventional
(A) Flow cytometric analysis of NK1.1 expression in TCRGzmB+ (green), TCRβ+GzmB+ (red) and TCRδ+GzmB+ (blue) cells in wild-type (WT) and 8-week-old PyMT mice. (B) Flow cytometric analysis of NK1.1 expression and CD1d/PBS-57 tetramer reactivity in TCRβ+ lymphocytes (left), and GzmB expression in TCRβ+NK1.1+CD1d/PBS-57 cells (red) and TCRβ+CD1d/PBS-57+ cells (purple) from pooled mammary glands of 8-week-old PyMT mice. Grey histogram indicates fluorescence minus one (FMO) control. (C) Flow cytometric analysis of CD4 and CD8α expression in TCRβ+NK1.1+CD1d/PBS-57 lymphocytes from pooled mammary glands of 8-week-old PyMT mice. Numbers in quadrants indicate percentage of cells. (D) Flow cytometric analysis of PD-1 and NK1.1 expression in TCRβ+CD8α+ cells from pooled mammary glands of WT, 8- and 20-week-old PyMT mice. Numbers in quadrants indicate percentage of cells. (E) Flow cytometric analysis of CD28, ICOS and CD5 expression among CD8αNK1.1+ (dark orange), CD8α+NK1.1+ (light orange), CD8α+NK1.1PD-1 (dotted grey) and CD8α+PD-1+ (black) T cell populations from pooled tumors of 20- to 24-week-old PyMT mice. Solid grey line in histograms indicates fluorescence minus one (FMO) control for each population. See also Figure S2.
Figure 3
Figure 3. Tumor-associated GzmB-expressing innate lymphocytes are type 1-like ILCs (ILC1ls)
(A) Flow cytometric analysis of CD49a expression in the indicated cell populations isolated from pooled tumors of 20- to 24-week-old PyMT mice. CD8αNK1.1+, CD8α+NK1.1+, CD8α+NK1.1PD-1 and CD8α+PD-1+ cell subsets were gated among TCRβ+ cells. Data are representative of ten independent experiments. (B) Left panel: flow cytometric analysis of CD49a and GzmB expression in the indicated subsets isolated from pooled mammary glands of wild-type (WT) and 8-week-old PyMT mice. Data are representative of five independent experiments. Right panel: percentages of CD49ahiGzmB+ cells in the indicated subsets (determined by flow cytometric analysis as in the left panel). Each symbol denotes an individual mouse. Data are pooled from five independent experiments. Error bars represent the mean ± SEM. Two-tailed unpaired t-test was used for statistical analysis. **P<0.01, ***P<0.001. (C) Log2 mean fold change of TCRNK1.1+CD49ahi vs. TCRNK1.1+CD49a gene expression corresponding to the cNK and ILC1 core gene signatures. See also Table S2. (D–E) Flow cytometric analysis of CD49b, T-bet and Eomes (D) as well as CD127 (E) expression in the indicated cell populations isolated from pooled tumors of 20- to 24-week-old PyMT mice. Grey histogram indicates fluorescence minus one (FMO) control. Data are representative of three independent experiments. See also Figure S3.
Figure 4
Figure 4. CD49ahiGzmB+ lymphocytes constitute a related group of cells distinct from conventional NK and T cells
(A) Principal component analysis of gene expression in the indicated cell populations sorted from pooled tumors of 20- to 24-week-old PyMT mice. Expression data are biological replicates from two independent experiments. (B) Gene expression signature of the indicated cell populations sorted from pooled tumors of 20- to 24-week-old PyMT mice. Genes were manually selected from those in cluster 3 (identified by hierarchical clustering shown in Figure S4B and Table S3). Heat map shows data pooled from two biological replicates. (C) Flow cytometric analysis of CD49a and CD103 expression in the indicated cell populations isolated from pooled mammary glands of 8-week-old PyMT mice. For each population, the level of GzmB expression is shown in the histogram as follows: CD49ahiCD103+ (red), CD49a+CD103 (green), CD49aCD103 (blue). Data are representative of four independent experiments. (D–E) Flow cytometric analysis of Ly49E and Ly49F (D) or TRAIL (E) expression in the indicated cell populations isolated from pooled tumors of 20- to 24-week-old PyMT mice. Data are representative of two to three independent experiments. Grey histogram indicates fluorescence minus one (FMO) control. See also Figure S4 and Figure S5.
Figure 5
Figure 5. Tissue-resident ILC1ls and ILTC1s expand in precancerous lesions
(A) Gene expression signature of the indicated cell populations sorted from pooled tumors of 20- to 24-week-old PyMT mice. Genes were manually selected from those in cluster 2 (identified by hierarchical clustering shown in Figure S4B and Table S3). Heat map shows data pooled from two biological replicates. (B–C) Flow cytometric analysis of CD45.1 (host) and CD45.2 (non-host) expression in the indicated cell populations isolated from the parabiotic PyMT mice 2 weeks after surgery (connected at 6 weeks of age). Data are representative of three independent experiments (B), and percentage of non-host chimerism was compiled from three independent experiments (C). (D–E) Flow cytometric analysis of EdU incorporation in the indicated cell populations isolated from pooled mammary glands of 8-week-old wild-type (WT) and PyMT mice. Cells were first gated on CD49ahiGzmB+ cells, and then on TCR (ILC1l), TCRβ+ (TCRαβ+ ILTC1) and TCRδ+ (TCRγδ+ ILTC1). Data are representative of two independent experiments (D). Percentage of EdU+ cells was compiled from two independent experiments (E). (C–E) Each symbol denotes an individual mouse and error bars represent the mean ± SEM. Two-tailed unpaired t-test was used for statistical analysis. *P<0.05, **P<0.01, ***P<0.001, ****P<0.0001. See also Figure S6.
Figure 6
Figure 6. ILC1ls and ILTC1s exhibit potent cytotoxic activities against tumor cells
(A–C) Lymphocyte populations were purified and cultured from pooled tumors of 20- to 24-week-old PyMT (A–C) and Prf1−/−PyMT mice (C), incubated at a 1:1 ratio with AT-3 tumor cells and imaged in polydimethylsiloxane wells in the presence of propidium iodide (PI). (A) Time-lapse montage showing the killing (marked by the red signal indicative of PI staining) of AT3 target cells (indicated by an asterisk) by ILC1l, TCRαβ+ ILTC1, TCRγδ+ ILTC1, cNK, TCRαβ+CD8α+NK1.1 and TCRγδ+NK1.1 cells (shown by arrowheads). Time (hours:minutes:seconds) is shown at the top of each image with the their initial co-appearance of target and effector cells in the well set at 0. Scale bar = 10 μm. (B–C) Quantification of killing efficiency defined by number of wells with PI signal over total number of wells with background cell death subtracted. Wells containing one effector lymphocyte were included for quantification and only a single killing event per well was counted (n = 20–100). Filled and open bars represent killing efficiency of cells sorted from wild-type PyMT and Prf1−/−PyMT mice, respectively (C). Data are pooled from two to three independent experiments. Error bars represent the mean ± SEM. Oneway ANOVA was used for statistical analysis. ****P<0.0001. (D) Total tumor burden of Prf1−/− PyMT and wild-type PyMT mice monitored between 8 and 15 weeks of age (n = 7–11). Error bars represent the mean ± SEM. Two-way ANOVA was used for statistical analysis. *P<0.05. See also Figure S7, Movie S1, Movie S2, Movie S3, Movie S4, Movie S5 and Movie S6.
Figure 7
Figure 7. IL-15 regulates ILC1l and ILTC1 generation impacting on tumor growth
(A) Flow cytometric analyses of CD49a and CD49b expression in TCRNK1.1+ cells from pooled tumors of Nfil3−/− PyMT and wild-type PyMT mice. Numbers in plots indicate percentage of CD49ahiCD49b (ILC1l) and CD49aCD49b+ (cNK) cells in their respective gates. Data are representative of three independent experiments. (B) Flow cytometric analysis of CD49a and GzmB expression in CD45+ leukocytes from pooled tumors of Nfil3−/− PyMT and wild-type PyMT mice. Numbers in plots indicate percentage of CD49ahiGzmB+ cells. Data are representative of three independent experiments. (C) Total tumor burden of Nfil3−/− PyMT and wild-type PyMT mice monitored between 8 and 15 weeks of age (n = 3–6). (D) Flow cytometric analysis of CD122 expression in the indicated cell populations isolated from pooled mammary glands of 8-week-old PyMT mice. Data are representative of five independent experiments. (E) Flow cytometric analysis of CD49a and GzmB expression in CD45+ leukocytes isolated from pooled mammary glands of 8-week-old Il15−/− PyMT and wild-type PyMT mice. Numbers in plots indicate percentage of CD49ahiGzmB+ cells. (F) Total tumor burden of Il15−/− PyMT and wild-type PyMT mice monitored between 8 and 15 weeks of age (n = 14–17). (G) Flow cytometric analysis of CD49a and GzmB expression in CD45+ leukocytes isolated from pooled mammary glands of 8-week-old IL-15TgPyMT and wild-type PyMT mice. Numbers in plots indicate percentage of CD49ahiGzmB+ cells. (H) Total tumor burden of IL-15TgPyMT and wild-type PyMT mice monitored between 8 and 15 weeks of age (n = 11–15). (C, F, H) Error bars represent the mean ± SEM. Two-way ANOVA was used for statistical analysis. n.s. = not significant, *P<0.05, **P<0.01. See also Figure S7.

Comment in

References

    1. Artis D, Spits H. The biology of innate lymphoid cells. Nature. 2015;517:293–301. - PubMed
    1. Bernink JH, Krabbendam L, Germar K, de Jong E, Gronke K, Kofoed-Nielsen M, Munneke JM, Hazenberg MD, Villaudy J, Buskens CJ, et al. Interleukin-12 and -23 Control Plasticity of CD127(+) Group 1 and Group 3 Innate Lymphoid Cells in the Intestinal Lamina Propria. Immunity. 2015;43:146–160. - PubMed
    1. Bernink JH, Peters CP, Munneke M, te Velde AA, Meijer SL, Weijer K, Hreggvidsdottir HS, Heinsbroek SE, Legrand N, Buskens CJ, et al. Human type 1 innate lymphoid cells accumulate in inflamed mucosal tissues. Nature immunology. 2013;14:221–229. - PubMed
    1. Burkett PR, Koka R, Chien M, Chai S, Boone DL, Ma A. Coordinate expression and trans presentation of interleukin (IL)-15Ralpha and IL-15 supports natural killer cell and memory CD8+ T cell homeostasis. The Journal of experimental medicine. 2004;200:825–834. - PMC - PubMed
    1. Burnet M. Cancer: a biological approach. III. Viruses associated with neoplastic conditions. IV. Practical applications. British medical journal. 1957;1:841–847. - PMC - PubMed

Publication types

MeSH terms

Substances