Review
. 2016 Feb;89(2):303-316.
doi: 10.1016/j.kint.2015.12.019.

The molecular mechanisms of hemodialysis vascular access failure

Affiliations
Review

The molecular mechanisms of hemodialysis vascular access failure

Akshaar Brahmbhatt et al. Kidney Int. 2016 Feb.

Abstract

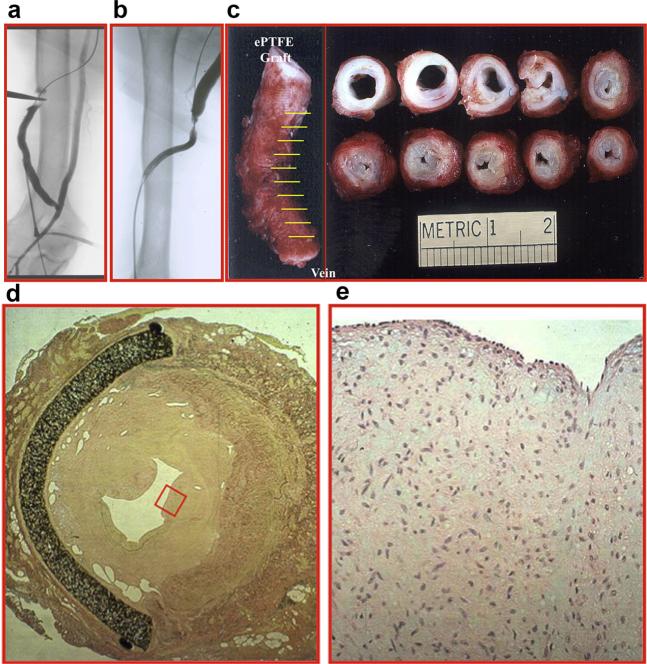
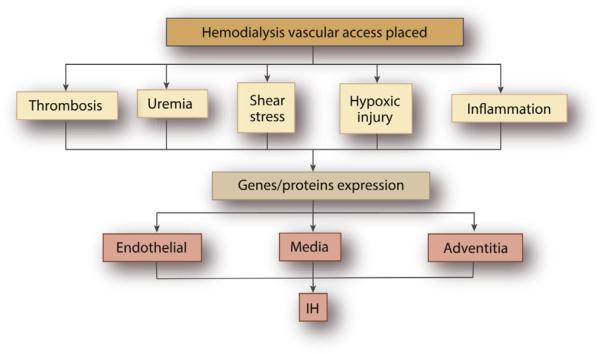
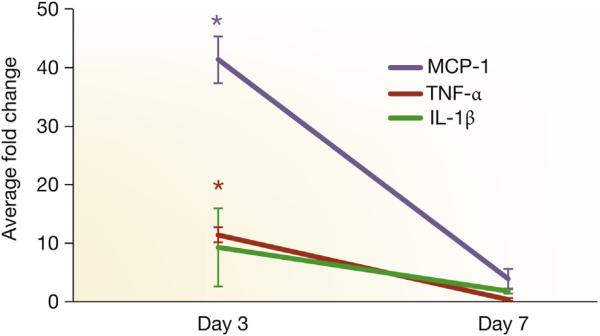
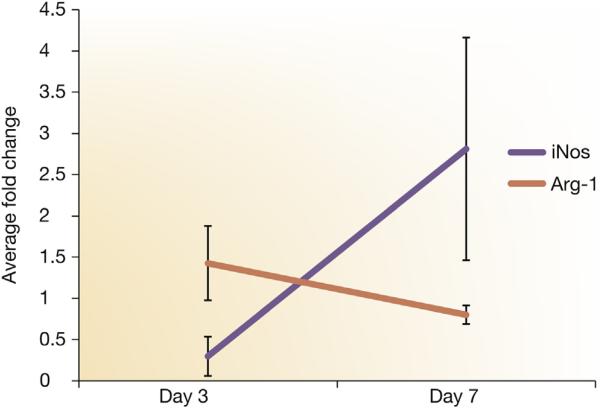
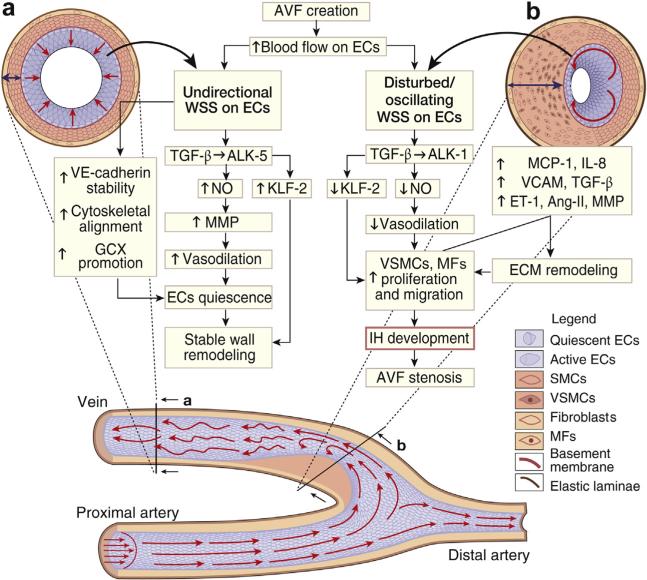
The arteriovenous fistula has been used for more than 50 years to provide vascular access for patients undergoing hemodialysis. More than 1.5 million patients worldwide have end stage renal disease and this population will continue to grow. The arteriovenous fistula is the preferred vascular access for patients, but its patency rate at 1 year is only 60%. The majority of arteriovenous fistulas fail because of intimal hyperplasia. In recent years, there have been many studies investigating the molecular mechanisms responsible for intimal hyperplasia and subsequent thrombosis. These studies have identified common pathways including inflammation, uremia, hypoxia, sheer stress, and increased thrombogenicity. These cellular mechanisms lead to increased proliferation, migration, and eventually stenosis. These pathways work synergistically through shared molecular messengers. In this review, we will examine the literature concerning the molecular basis of hemodialysis vascular access malfunction.

Keywords: arteriovenous fistula; murine model; restenosis; vascular biology; venous neointimal hyperplasia.


Figures

Figure 1
Figure 1
(a, b) Fistulograms showing a stenosis at the polytetrafluoroethylene graft anastomosis to the basilic vein. (c) A gross specimen from a different patient showing thickening of the vein to graft anastomosis. Hematoxylin and eosin stain (d) at 10× magnification demonstrating a thickened neointima and (e) at 40× magnification (red box in d) showing increased cellular proliferation. ePTFE, expanded polytetrafluoro-ethylene.
Figure 2
Figure 2. Schematic of vascular injuries contributing to stenosis formation in hemodialysis vascular access
IH, intimal hyperplasia.
Figure 3
Figure 3. TNF-α, MCP-1, and IL-1β expression by qRT-PCR
Tissue necrosis factor-alpha (TNF-α), monocyte chemoattractant protein-1 (MCP-1), and interlukin-1 beta (IL-1β) expression by quantitative reverse transcriptase polymerase chain reaction (qRT-PCR) in graft veins and control veins at 3 and 7 days after arteriovenous fistula placement in mice with established chronic kidney disease. There is a significant increase in the mean TNF-α, MCP-1, and IL-1β expression at 3 days in graft veins when compared with control veins (P < 0.05). Each bar shows the mean ± SEM of 3 samples per group. Two-way analysis of variance with Student t test with post hoc Bonferroni correction was performed. *P < 0.05.
Figure 4
Figure 4. iNOS and Arg-1 expression using qRT-PCR
Inducible nitric oxide synthase (iNOS) and arginase-1 (Arg-1) expression using quantitative reverse transcriptase polymerase chain reaction (qRT-PCR) in graft veins and control veins at 3 and 7 days after arteriovenous fistula placement in mice with established chronic kidney disease. There is a significant increase in the mean Arg-1 expression with a decrease in iNOS between day 3 and 7. Each bar shows the mean ± SEM of 3 samples per group. Two-way analysis of variance with Student t test with post hoc Bonferroni correction was performed. P < 0.05.
Figure 5
Figure 5. Flow cytometry for bone marrow Ly-6C Hi and Ly-6C Lo cells and splenic F4/80(+) cells from animals treated with CLO and PBS at day 14
(a) Representative flow diagram from a clodronate (CLO)-treated animal. (b) Representative flow diagram from a control–phosphate-buffered saline (PBS)-treated–animal. (c) Pooled data from 2 PBS-treated animals and 3 CLO-treated animals at day 14. Each bar shows the mean ± SEM of 2 to 3 samples per group. Two-way analysis of variance with Student t test with post hoc Bonferroni correction was performed. *P < 0.05.
Figure 6
Figure 6. H&E staining of outflow veins removed from animals treated with PBS and CLO at day 14
Hematoxylin and eosin (H&E) staining of outflow veins removed from PBS-treated and CLO-treated animals at day 14 after arteriovenous fistula placement. There is a reduction in the neointima (n) of the CLO-treated animals when compared with PBS control animals. Asterisk (*) shows the lumen of the vessel. Scale bars = 50 μM. CLO, clodronate; m + a, media/adventitia; PBS, phosphate-buffered saline.
Figure 7
Figure 7. Inflammatory cytokines in A-treated versus control animals
Inflammatory cytokines are elevated in Avastin (A)-treated vessels when compared with control animals (IgG) at days 7 and 14 after arteriovenous fistula placement. Vascular endothelial growth factor-A (VEGF-A), MCP-1, TNF-α, and IL-1β expression by qRT-PCR in graft veins and control veins at 7 and 14 days after arteriovenous fistula placement in mice with established chronic kidney disease. Each bar shows the mean ± SEM of 4 to 6 samples per group. Two-way analysis of variance with Student t test with post hoc Bonferroni correction was performed. *P < 0.05. IL-1β, interlukin-1 beta; MCP-1, monocyte chemoattractant protein-1; qRT-PCR, reverse transcriptase polymerase chain reaction; TNF-α, tissue necrosis factor-alpha.
Figure 8
Figure 8. Schematic representation of molecular mechanism of IH development in native AVF
Section of a side-to-end arteriovenous fistula (AVF). Laminar blood flow coming from the proximal artery stimulates the endothelial cells (ECs) with unidirectional wall shear stress (WSS) until the anastomosis level where the blood flow splits in 2 directions. At the vein curvature, the blood flow becomes unstable with disturbed and oscillating WSS and reverse flows at the inner curvature of the anastomosis. After the curvature, blood flow oscillations decrease and WSS returns to almost unidirectional. The different WSS patterns generated on the endothelium lead wall remodeling. At (a), the unidirectional WSS maintains vessel patency while at (b) oscillating and reversing WSS impair ECs quiescence leading to intimal hyperplasia (IH). ALK-5, activin receptor-like kinases 1/5; Ang-II, angiotensin II; ECM, extracellular matrix; ET-1, endothelin 1; GCX, glycocalyx; IL-8, interleukin 8; KLF-2, Krüppel-like factor 2; MCP-1 monocytes chemoattractant protein 1; MFs, myofibroblasts; MMP, metalloproteinase; NO, nitric oxide; SMCs, smooth muscle cells; TGF-β, transforming growth factor β; VCAM, vascular cell adhesion protein; VE, vascular endothelial; VSMC, vascular smooth muscle cells.

References

    1. Sands JJ. Increasing AV fistulas: revisiting a time-tested solution. Semin Dial. 2000;13:351–353. - PubMed
    1. Roy-Chaudhury P, Lee TC. Vascular stenosis: biology and interventions. Curr Opin Nephrol Hypertens. 2007;16:516–522. - PubMed
    1. Schinstock CA, Albright RC, Williams AW, et al. Outcomes of arteriovenous fistula creation after the Fistula First Initiative. Clin J Am Soc Nephrol. 2011;6:1996–2002. - PMC - PubMed
    1. Rayner HC, Besarab A, Brown WW, et al. Vascular access results from the Dialysis Outcomes and Practice Patterns Study (DOPPS): performance against Kidney Disease Outcomes Quality Initiative (K/DOQI) Clinical Practice Guidelines. Am J Kidney Dis. 2004;44(suppl 2):22–26. - PubMed
    1. Vassalotti JA, Jennings WC, Beathard GA, et al. for the Fistula First Breakthrough Initiative Community Education Committee Fistula first breakthrough initiative: targeting catheter last in fistula first. Semin Dial. 2012;25:303–310. - PubMed

Publication types