. 2016 Jan 22:9:4.
doi: 10.1186/s13040-016-0086-4. eCollection 2016.

Prediction of donor splice sites using random forest with a new sequence encoding approach

Affiliations

Prediction of donor splice sites using random forest with a new sequence encoding approach

Prabina Kumar Meher et al. BioData Min. .

Abstract

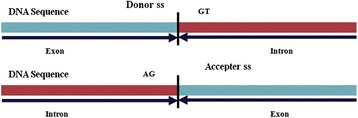
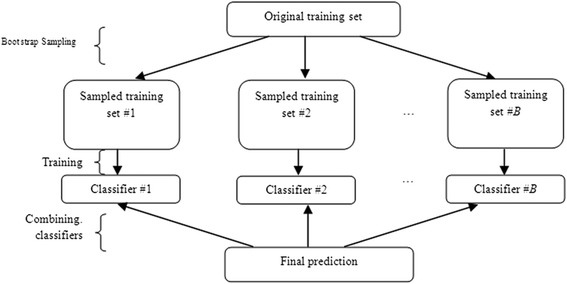
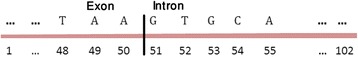
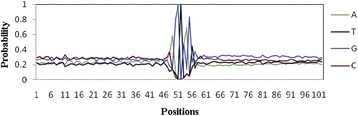
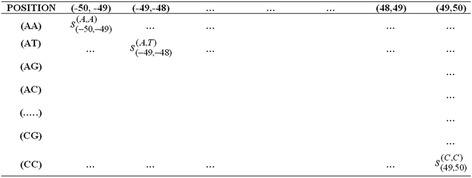
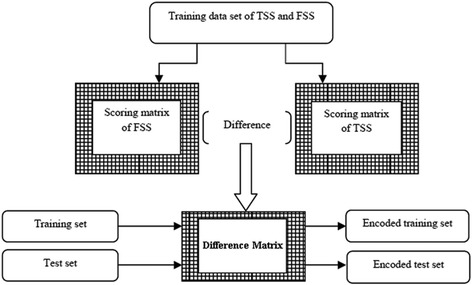
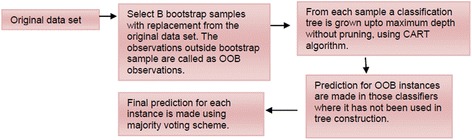
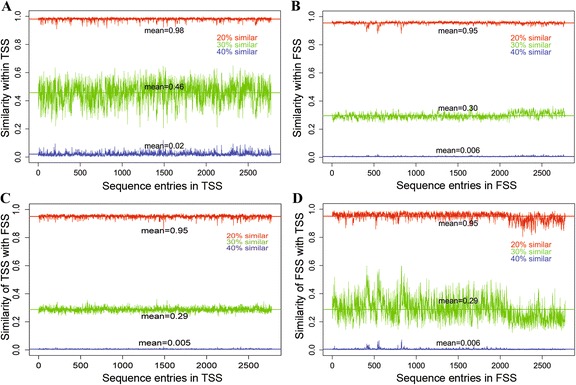
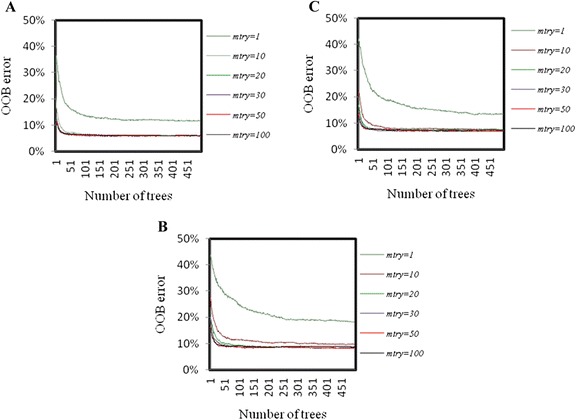
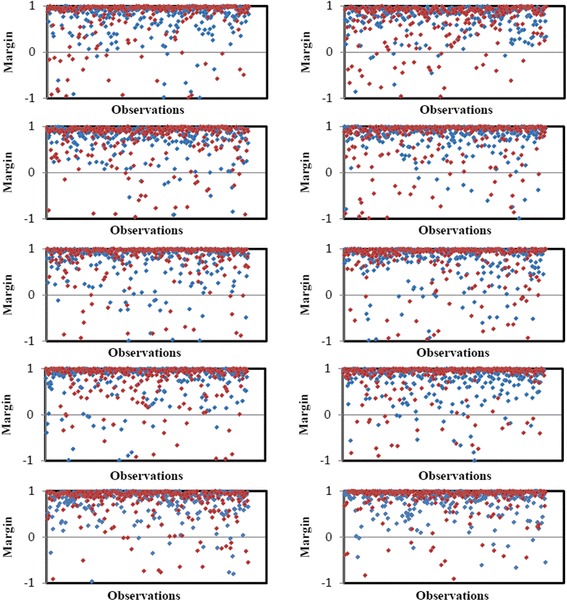
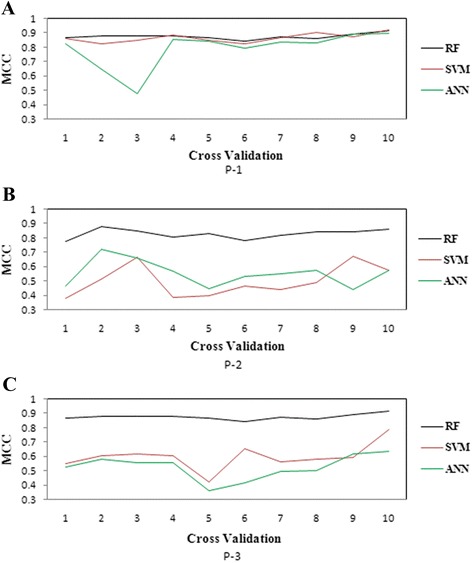
Background: Detection of splice sites plays a key role for predicting the gene structure and thus development of efficient analytical methods for splice site prediction is vital. This paper presents a novel sequence encoding approach based on the adjacent di-nucleotide dependencies in which the donor splice site motifs are encoded into numeric vectors. The encoded vectors are then used as input in Random Forest (RF), Support Vector Machines (SVM) and Artificial Neural Network (ANN), Bagging, Boosting, Logistic regression, kNN and Naïve Bayes classifiers for prediction of donor splice sites.

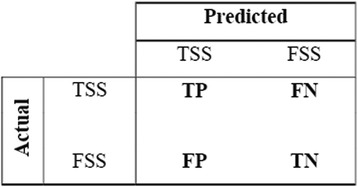
Results: The performance of the proposed approach is evaluated on the donor splice site sequence data of Homo sapiens, collected from Homo Sapiens Splice Sites Dataset (HS3D). The results showed that RF outperformed all the considered classifiers. Besides, RF achieved higher prediction accuracy than the existing methods viz., MEM, MDD, WMM, MM1, NNSplice and SpliceView, while compared using an independent test dataset.

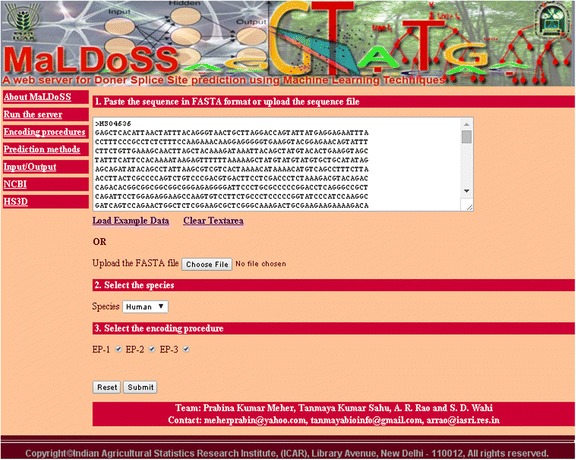
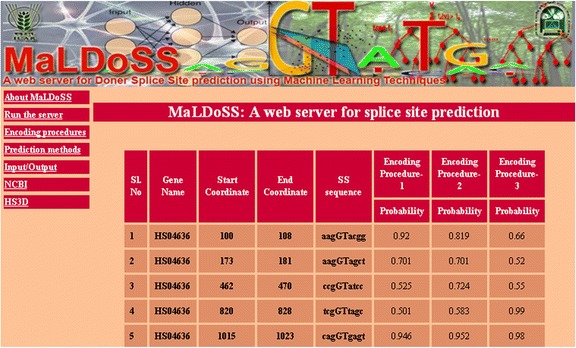
Conclusion: Based on the proposed approach, we have developed an online prediction server (MaLDoSS) to help the biological community in predicting the donor splice sites. The server is made freely available at http://cabgrid.res.in:8080/maldoss. Due to computational feasibility and high prediction accuracy, the proposed approach is believed to help in predicting the eukaryotic gene structure.

Keywords: Computational feasibility; Di-nucleotide association; Machine learning; PWM.


Figures

Fig. 1
Fig. 1
Pictorial representation of donor and acceptor ss. Donor ss have di-nucleotides GT at the beginning of the intron and acceptor ss have di-nucleotides AG at the end of intron
Fig. 2
Fig. 2
Flow diagram shows the step involved in prediction using ensemble of tree classifiers. Initially, B number of samples were drawn from the original training set and a tree was grown using each sample. The final predictions were made by combining all the classifiers
Fig. 3
Fig. 3
Pictorial representation of ss motif. The di-nucleotides GT conserved at 51st and 52nd positions in the ss motif of length 102 having 50 nucleotides flanking on both sides of GT
Fig. 4
Fig. 4
Graphical representation of the PWM for the TSS. The graph shows the probability distribution of four nucleotide bases (ATGC) around the splicing junction
Fig. 5
Fig. 5
A sample scoring matrix. There are 101 columns for different combination of positions and 16 rows for all possible combinations of nucleotides. This scoring matrix was prepared under all the three encoding procedures
Fig. 6
Fig. 6
Diagrammatic representation for preparation of encoded training and test datasets from TSS and FSS sequences. For each of the training set in 10 fold cross validation procedure, TSS and FSS scoring matrices were constructed followed by the construction of difference scoring matrices. The encoded training and test sets were obtained after passing the ss sequence data of training and test sets through the difference matrix
Fig. 7
Fig. 7
Diagrammatic representation of the steps involved in RF methodology
Fig. 8
Fig. 8
Diagrammatic representation of confusion matrix. TP, FP, TN and FN are the number of true positives, false positives, true negatives and false negatives respectively. TP is the number of TSS being predicted as a TSS and TN is the number of FSS being predicted as FSS. Similarly, FN is the number of TSS being incorrectly predicted as FSS and FP is the number of FSS being incorrectly predicted as TSS
Fig. 9
Fig. 9
Graphical representation of sequence distribution in the dataset. a. Similarities of each sequence of TSS with rest of the sequences in TSS. b. Similarities of each sequence of FSS with rest of the sequences in FSS. c. Similarities of each sequence of TSS with all the sequences in FSS. d. Similarities of each sequence of FSS with all the sequences in TSS. X-axis represents the sequence entries and Y-axis represents fraction of similar sequences
Fig. 10
Fig. 10
Graphical representation of OOB-ER with different mtry and ntree. Graphs a, b and c represents the trend of error rates with varying mtry for three encoding procedures, P-1, P-2 and P-3. The OOB-ER was minimum for mtry = 50 and stabilized with 200 trees (ntree)
Fig. 11
Fig. 11
Graphical representation of margin functions for ten-fold cross-validation. Red color points for FSS and blue color for TSS. The instances having value of margin function greater than or equal to zero are correctly predicted test instances and instances having value below zero indicate incorrectly predicted test instances
Fig. 12
Fig. 12
Graphical representation of MCC of the RF, SVM and ANN. MCC is consistent in all the three procedures for the RF over the tenfold cross-validation
Fig. 13
Fig. 13
Snapshot of the server page
Fig. 14
Fig. 14
Snapshot of the result page after execution of an example dataset with all the three encoding procedures

References

    1. Sheth N, Roca X, Hastings ML, Roeder T, Krainer AR, Sachidanandam R. Comprehensive splice site analysis using comparative genomics. Nucleic Acids Res. 2006;34:3955–3967. doi: 10.1093/nar/gkl556. - DOI - PMC - PubMed
    1. Chen TM, Lu CC, Li WH. Prediction of splice sites with dependency graphs and their expanded Bayesian networks. Bioinformatics. 2005;21(4):471–482. doi: 10.1093/bioinformatics/bti025. - DOI - PubMed
    1. Reese MG. Application of a time-delay neural network to promoter annotation in the Drosophila melanogaster genome. Comput Chem. 2001;26(1):51–56. doi: 10.1016/S0097-8485(01)00099-7. - DOI - PubMed
    1. Rajapakse J, CaH LS. Markov encoding for detecting signals in genomic sequences. IEEE Trans Comput. Biol Bioinformatics. 2005;2(2):131–142. - PubMed
    1. Zhang XF, Katherine HA, Ilana HC, Lawrene LS, Chasin A. Sequence Information for the Splicing of Human Pre-mRNA Identified by Support Vector Machine Classification. Genome Res. 2003;13:2637–2650. doi: 10.1101/gr.1679003. - DOI - PMC - PubMed

LinkOut - more resources