

Global Expanded Nutrient Supply (GENuS) Model: A New Method for Estimating the Global Dietary Supply of Nutrients
- PMID: 26807571
- PMCID: PMC4726504
- DOI: 10.1371/journal.pone.0146976
Global Expanded Nutrient Supply (GENuS) Model: A New Method for Estimating the Global Dietary Supply of Nutrients
Abstract
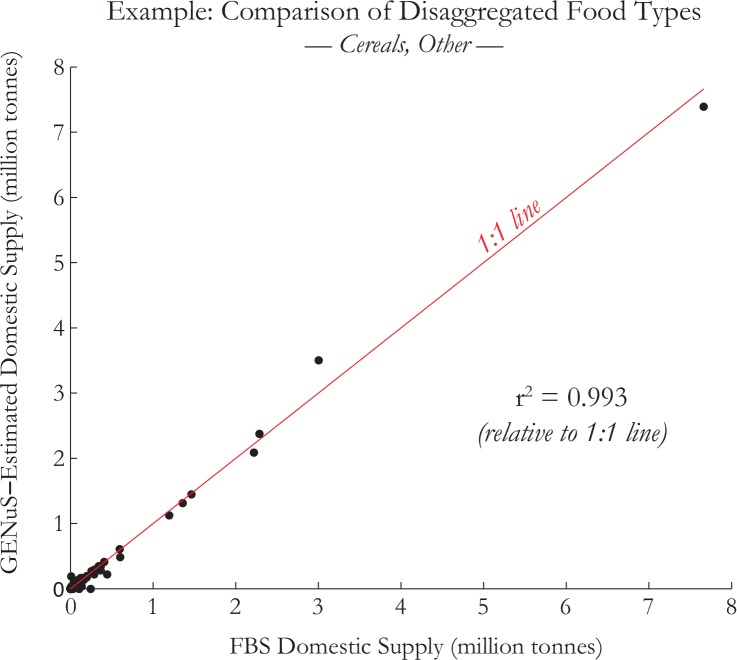
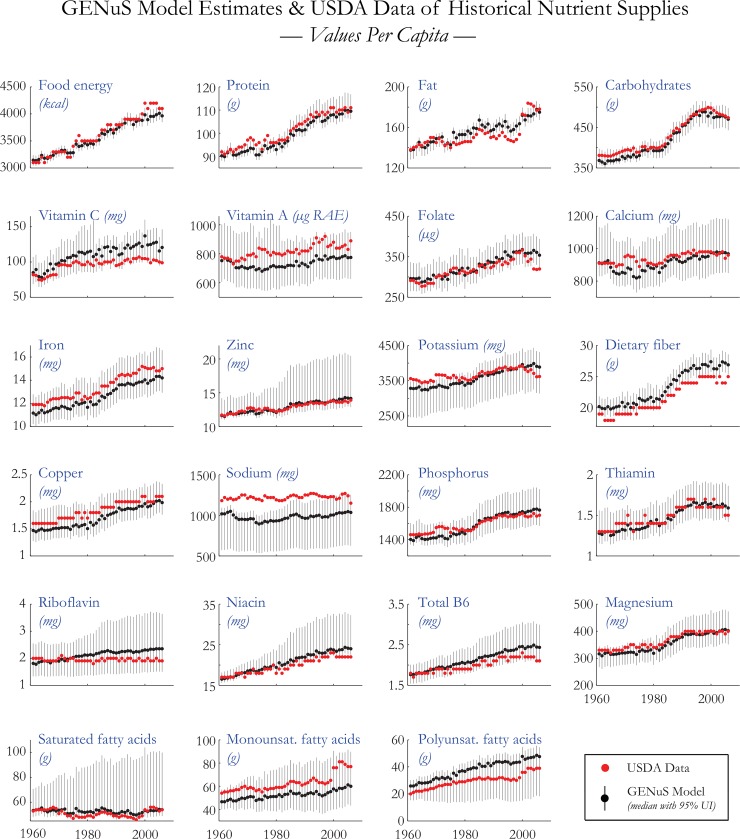
Insufficient data exist for accurate estimation of global nutrient supplies. Commonly used global datasets contain key weaknesses: 1) data with global coverage, such as the FAO food balance sheets, lack specific information about many individual foods and no information on micronutrient supplies nor heterogeneity among subnational populations, while 2) household surveys provide a closer approximation of consumption, but are often not nationally representative, do not commonly capture many foods consumed outside of the home, and only provide adequate information for a few select populations. Here, we attempt to improve upon these datasets by constructing a new model--the Global Expanded Nutrient Supply (GENuS) model--to estimate nutrient availabilities for 23 individual nutrients across 225 food categories for thirty-four age-sex groups in nearly all countries. Furthermore, the model provides historical trends in dietary nutritional supplies at the national level using data from 1961-2011. We determine supplies of edible food by expanding the food balance sheet data using FAO production and trade data to increase food supply estimates from 98 to 221 food groups, and then estimate the proportion of major cereals being processed to flours to increase to 225. Next, we estimate intake among twenty-six demographic groups (ages 20+, both sexes) in each country by using data taken from the Global Dietary Database, which uses nationally representative surveys to relate national averages of food consumption to individual age and sex-groups; for children and adolescents where GDD data does not yet exist, average calorie-adjusted amounts are assumed. Finally, we match food supplies with nutrient densities from regional food composition tables to estimate nutrient supplies, running Monte Carlo simulations to find the range of potential nutrient supplies provided by the diet. To validate our new method, we compare the GENuS estimates of nutrient supplies against independent estimates by the USDA for historical US nutrition and find very good agreement for 21 of 23 nutrients, though sodium and dietary fiber will require further improvement.
Conflict of interest statement
Figures
References
-
- Drewnowski AD, Popkin BM. The nutrition transition: New trends in the global diet. Nutr Rev. 1997. February; 55(2): 31–43. - PubMed
-
- Grigg D. The pattern of world protein consumption. Geoforum. 1995. February; 26(1): 1–17.
-
- de Boer J, Helms M, Aiking H. Protein consumption and sustainability: Diet diversity in EU-15. Ecol Econ. 2006. September 20; 59(3): 267–274. 10.1016/j.ecolecon.2005.10.011 - DOI
Publication types
MeSH terms
Substances
LinkOut - more resources
Full Text Sources
Other Literature Sources
Medical
