. 2016 Jan 25;11(1):e0147176.
doi: 10.1371/journal.pone.0147176. eCollection 2016.

Aqueous Angiography: Real-Time and Physiologic Aqueous Humor Outflow Imaging

Affiliations

Aqueous Angiography: Real-Time and Physiologic Aqueous Humor Outflow Imaging

Sindhu Saraswathy et al. PLoS One. .

Abstract

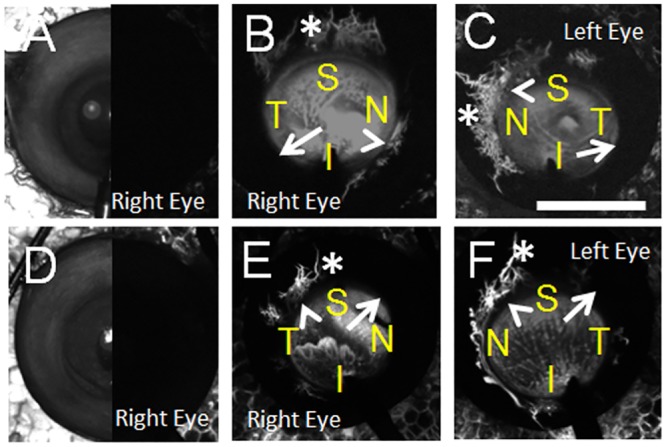
Purpose: Trabecular meshwork (TM) bypass surgeries attempt to enhance aqueous humor outflow (AHO) to lower intraocular pressure (IOP). While TM bypass results are promising, inconsistent success is seen. One hypothesis for this variability rests upon segmental (non-360 degrees uniform) AHO. We describe aqueous angiography as a real-time and physiologic AHO imaging technique in model eyes as a way to simulate live AHO imaging.

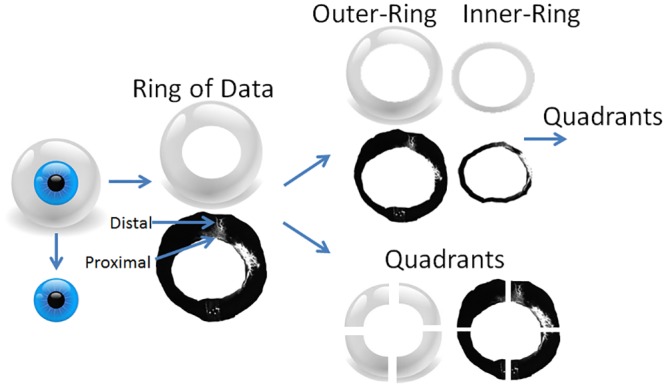
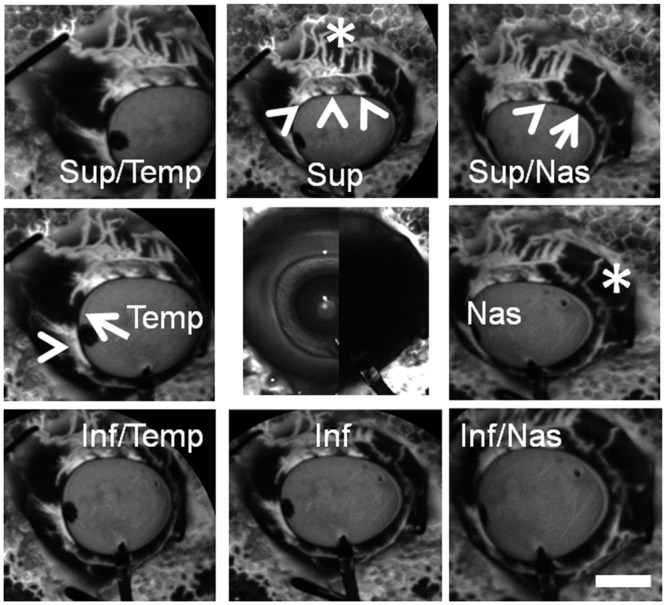
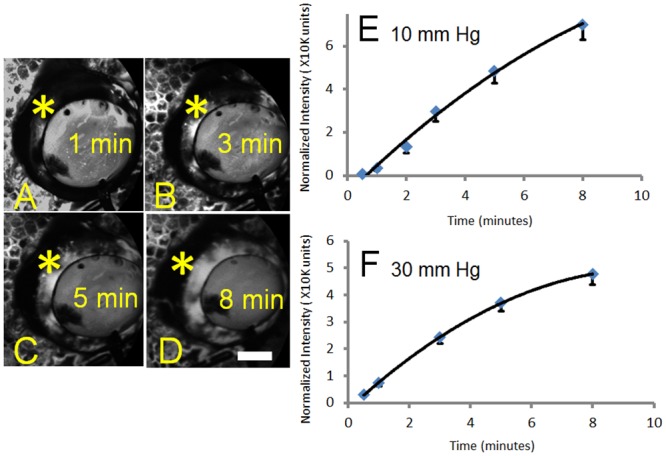
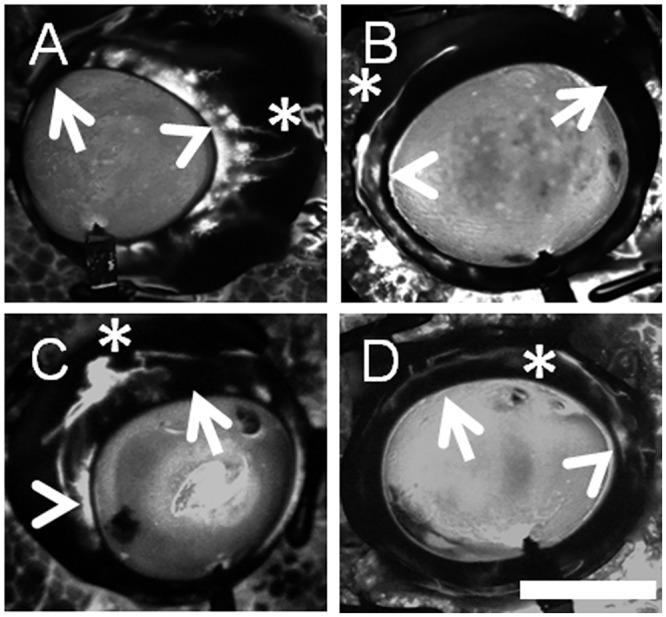
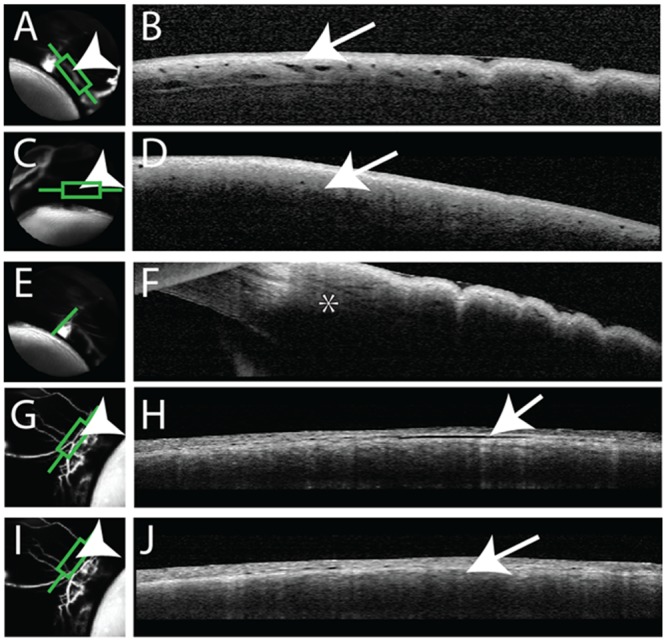
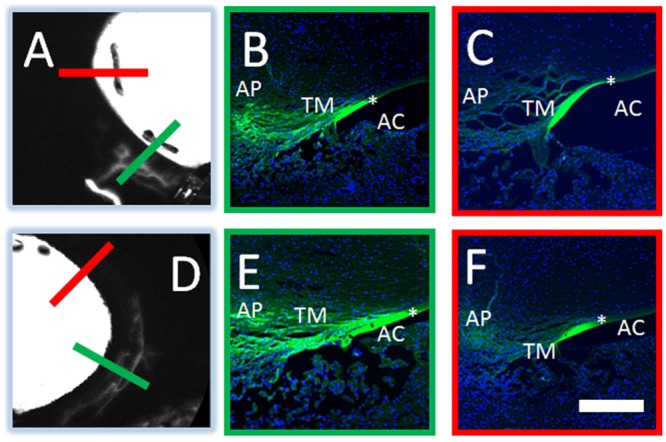
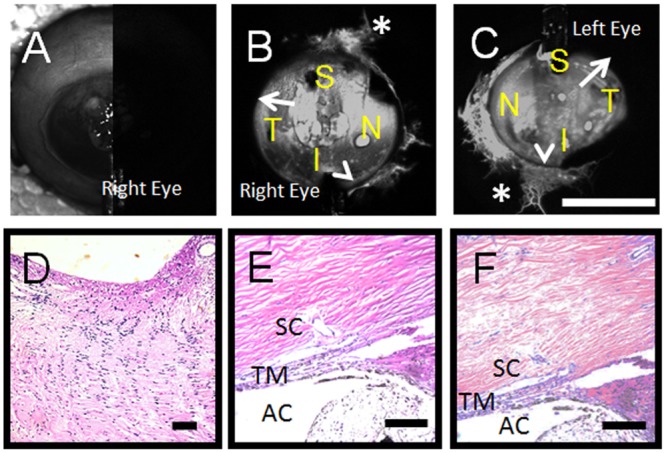
Methods: Pig (n = 46) and human (n = 6) enucleated eyes were obtained, orientated based upon inferior oblique insertion, and pre-perfused with balanced salt solution via a Lewicky AC maintainer through a 1mm side-port. Fluorescein (2.5%) was introduced intracamerally at 10 or 30 mm Hg. With an angiographer, infrared and fluorescent (486 nm) images were acquired. Image processing allowed for collection of pixel information based on intensity or location for statistical analyses. Concurrent OCT was performed, and fixable fluorescent dextrans were introduced into the eye for histological analysis of angiographically active areas.

Results: Aqueous angiography yielded high quality images with segmental patterns (p<0.0001; Kruskal-Wallis test). No single quadrant was consistently identified as the primary quadrant of angiographic signal (p = 0.06-0.86; Kruskal-Wallis test). Regions of high proximal signal did not necessarily correlate with regions of high distal signal. Angiographically positive but not negative areas demonstrated intrascleral lumens on OCT images. Aqueous angiography with fluorescent dextrans led to their trapping in AHO pathways.

Conclusions: Aqueous angiography is a real-time and physiologic AHO imaging technique in model eyes.


Conflict of interest statement

Competing Interests: The authors have declared that no competing interests exist.

Figures

Fig 1
Fig 1. Image Processing for Quantitative Analyses.
The cornea/limbal border and the globe horizon were manually segmented with the anterior chamber and any information beyond the globe horizon removed to create a total ring of angiographic data. While this ring certainly compressed the information due to the globe curvature, this view allowed for the entire angiographic image to be seen 360 degrees around the limbus due to the available lenses on the Spectralis. The segmented cornea/limbal border was then identified and expanded to 115% in Photoshop (transform selection tool) to separate an inner- versus outer-ring approximating more proximal from distal signal. Qualitatively, a 115% enlargement encompassed the peri-limbal signal of the TM/Aqueous plexus (AP)/CC complex. The a) total, b) inner-, and c) outer-rings could then be divided into equal quadrants (superior-nasal [SN], superior-temporal [ST], inferior-nasal [IN], and inferior-temporal [IT]).
Fig 2
Fig 2. Aqueous Angiography Shows Segmental Patterns.
Images from nine cardinal positions were taken on a representative pig eye demonstrating segmental and differentially emphasized angiographic patterns. Arrowheads denoted regions of peri-limbal proximal (TM/AP/CC) signal and asterisks highlighted regions of distal signal (episcleral). Arrows showed areas of relatively low per-limbal signal. The central image was a composite image of cSLO infrared (left side) and pre-injection background (right side) images. Note that the pre-injection background was even less intense than that of the stained styrofoam (polygonal background pattern) that the eye was attached to. Sup = superior; temp = temporal, nas = nasal; inf = interior. Scale bar = 1 cm.
Fig 3
Fig 3. Aqueous Angiography Signal Intensity Strengthens and Plateaus with Time.
(A-D) Aqueous angiography signal (asterisks) increased in one eye with 2.5% fluorescein over time from 1 to 8 minutes. (E) Total normalized pixel intensity values from 18 total eyes were recorded as a function of time with perfusion at 10 mm Hg. (F) Total normalized pixel intensity values from 18 total eyes were recorded as a function of time with perfusion at 30 mm Hg. Graphs showed mean +/- standard error. Given that eyes were enucleated, episcleral veins eventually ended with nowhere for the fluorescein to go other than to accumulate on the surface, possibly explaining the plateau. This accumulation appeared slower at 10 mm Hg compared to 30 mm Hg. As such, segmental and relative differences in angiographic signal in different parts of the eye were more readily observed at earlier time points. Scale bar = 1 cm.
Fig 4
Fig 4. Aqueous Angiography Shows Different Patterns in Different Pig Eyes.
Robust segmental angiographic signal was seen with regions of proximal (TM/AP/CC; arrowheads), distal (asterisks), and relatively diminished (arrows) regions. (A/B) Different eyes showed different patterns where in some cases, more proximal angiographic signal (arrowheads) was located near adjacent to more distal angiographic signal (asterisks). (C/D) In other eyes, more proximal angiographic signal (arrowheads) traveled distally to different locations in the eye (asterisks). Scale bar = 1 cm.
Fig 5
Fig 5. Aqueous Angiography and Optical Coherence Tomography (OCT).
Aqueous angiography was conducted in pig eyes in parallel with anterior segment OCT. (A/G) Angiographically positive areas (arrowheads) correlated with (B/H) intrascleral lumens on OCT (arrows). (C/I) In contrast, angiographically lacking areas (arrowheads) were (D/J) devoid of intrascleral lumens on OCT (arrows). (E) Angiographically positive areas could be associated with a classical “side-ways Y”[39] aqueous vein (asterisk).
Fig 6
Fig 6. Aqueous Angiography Localizes to AHO Pathways.
Aqueous angiography was conducted with 3 kD fixable fluorescent dextrans in pig eyes. Two representative eyes (A-C and D-F) are shown here. Angiographically positive (A/D; green lines) or diminished (A/D; red lines) regions were identified with aqueous angiography and then sectioned. In the first eye (A-C), angiographically positive (green line in A corresponds to panel B) but not angiographically negative (red line in A corresponds to panel C) regions showed trapping of dextrans within outflow pathways. In the second eye (D-F), angiographically positive (green line in D corresponds to panel E) but not angiographically negative (red line in D corresponds to panel F) regions also showed trapping of dextrans within outflow pathways. Note similar degree of non-specific fluorescence seen in strips of Descemet Membrane in all cases (asterisks). AP = aqueous plexus, TM = trabecular meshwork, AC = anterior chamber. Scale bar = 100 microns.
Fig 7
Fig 7. Aqueous Angiography in Enucleated Human Eyes.
Aqueous angiography was performed on enucleated eyes from two female subjects not known to have glaucoma at 10 mm Hg (subject 1 = (A-C) and subject 2 = (D-F)). Both right and left eyes from each subject were investigated and shown at 10–25 seconds. (A/D) Composite cSLO infrared (left-side) and pre-injection background images (right-side) are shown from the right eyes of these two subjects. S = superior; T = temporal, N = nasal; I = inferior. AC = anterior chamber, TM = trabecular meshwork, SC = Schlemm’s Canal. Scale bars = 1 cm.
Fig 8
Fig 8. Aqueous Angiography and Histology in Enucleated Human Eyes.
Aqueous angiography was performed on enucleated eyes from one male subject at 30 mm Hg (A-C). (A) Composite cSLO infrared (left-side) and pre-injection background images (right-side) are shown from the right eye only. (D) This subject was not known to have glaucoma and the optic nerve of the right eye showed lack of cupping on paraffin sectioning. Also in the right eye, angle structures were grossly similar at the light microscopic level comparing regions of greater (E; S region of panel B) or lesser (F; ST region of panel (C) angiographic signal. S = superior; T = temporal, N = nasal; I = inferior. AC = anterior chamber, TM = trabecular meshwork, SC = Schlemm’s Canal. Scale bars = 100 micron (black) and 1 cm (white).

References

    1. Swaminathan SS, Oh DJ, Kang MH, Rhee DJ. Aqueous outflow: segmental and distal flow. J Cataract Refract Surg. 2014;40(8):1263–72. Epub 2014/08/05. 10.1016/j.jcrs.2014.06.020 ; PubMed Central PMCID: PMCPmc4151118. - DOI - PMC - PubMed
    1. Ashton N. Anatomical study of schlemm's canal and aqueous veins by means of neoprene casts, part I. aqueous veins. British Journal of Ophthalmology. 1951;35(5):291–303. - PMC - PubMed
    1. Johnson M. 'What controls aqueous humour outflow resistance?'. Exp Eye Res. 2006;82(4):545–57. Epub 2006/01/03. 10.1016/j.exer.2005.10.011 ; PubMed Central PMCID: PMCPmc2892751. - DOI - PMC - PubMed
    1. Goel M, Picciani RG, Lee RK, Bhattacharya SK. Aqueous humor dynamics: a review. Open Ophthalmol J. 2010;4:52–9. Epub 2011/02/05. 10.2174/1874364101004010052 ; PubMed Central PMCID: PMCPmc3032230. - DOI - PMC - PubMed
    1. Abu-Hassan DW, Acott TS, Kelley MJ. The Trabecular Meshwork: A Basic Review of Form and Function. J Ocul Biol. 2014;2(1). - PMC - PubMed

Publication types

LinkOut - more resources