. 2016 Mar;18(3):271-280.
doi: 10.1038/ncb3303. Epub 2016 Jan 25.

EXD2 promotes homologous recombination by facilitating DNA end resection

Affiliations

EXD2 promotes homologous recombination by facilitating DNA end resection

Ronan Broderick et al. Nat Cell Biol. 2016 Mar.

Abstract

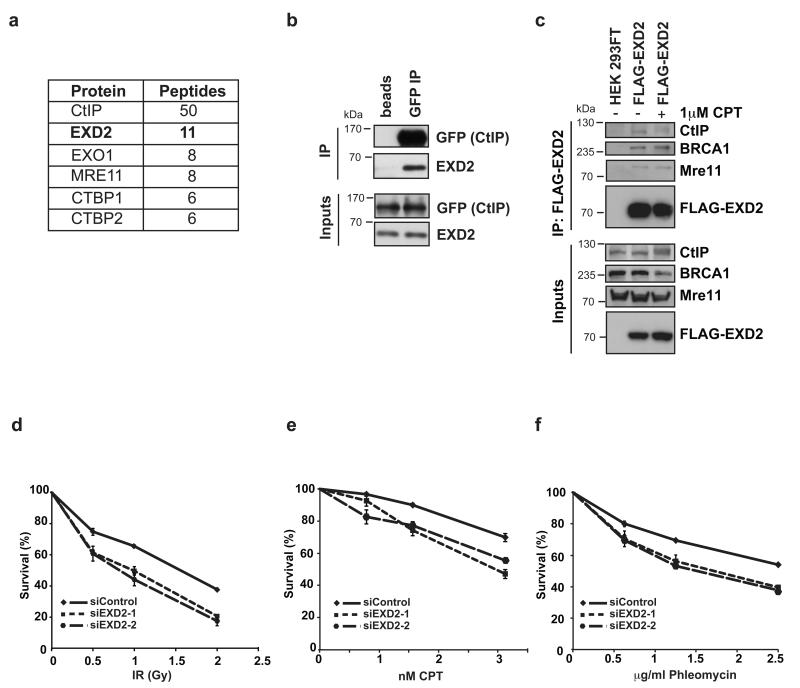
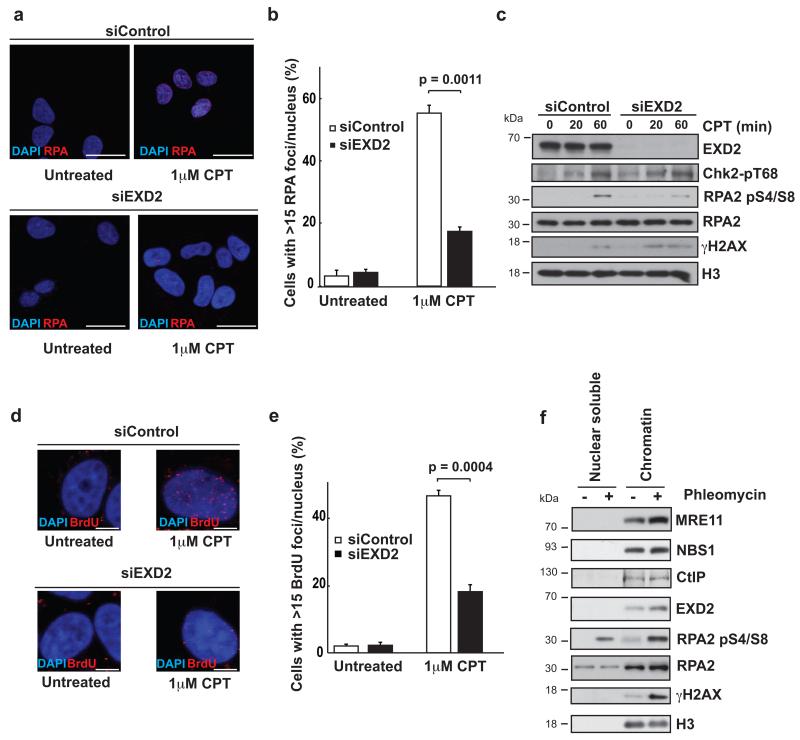
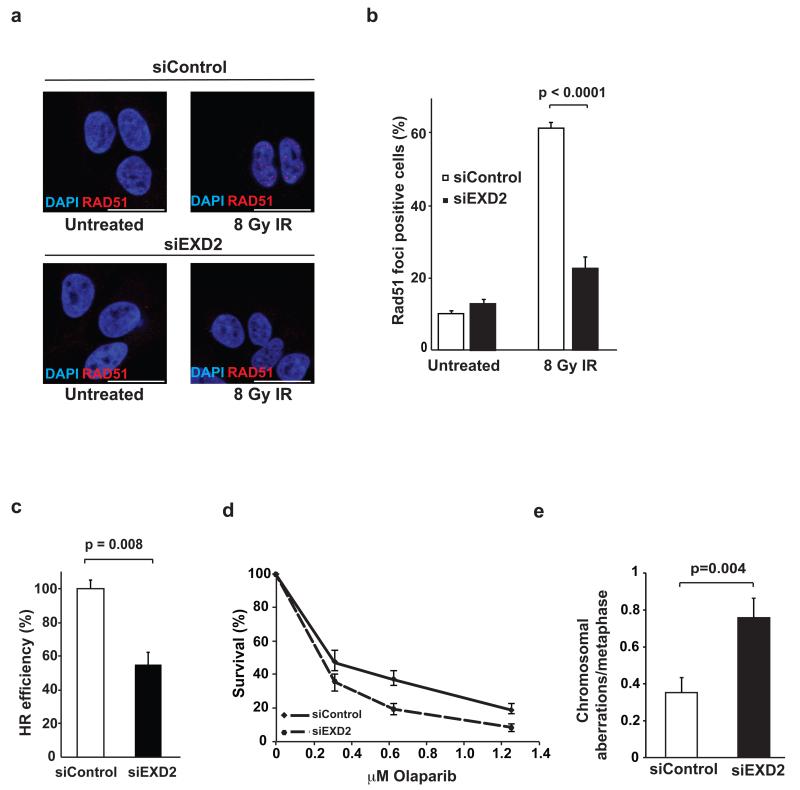
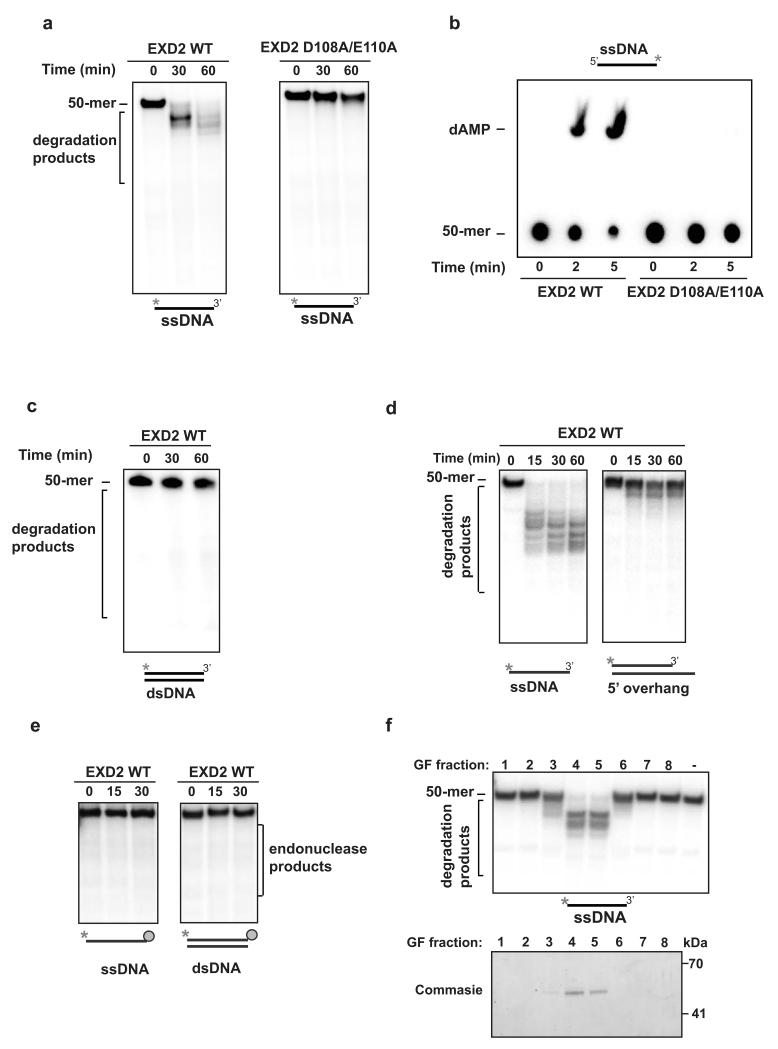
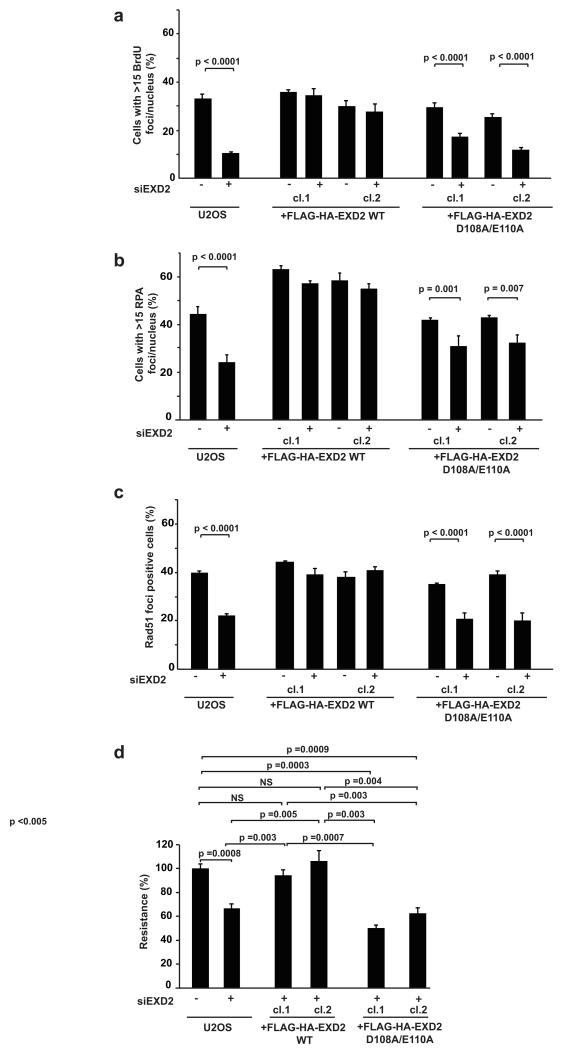
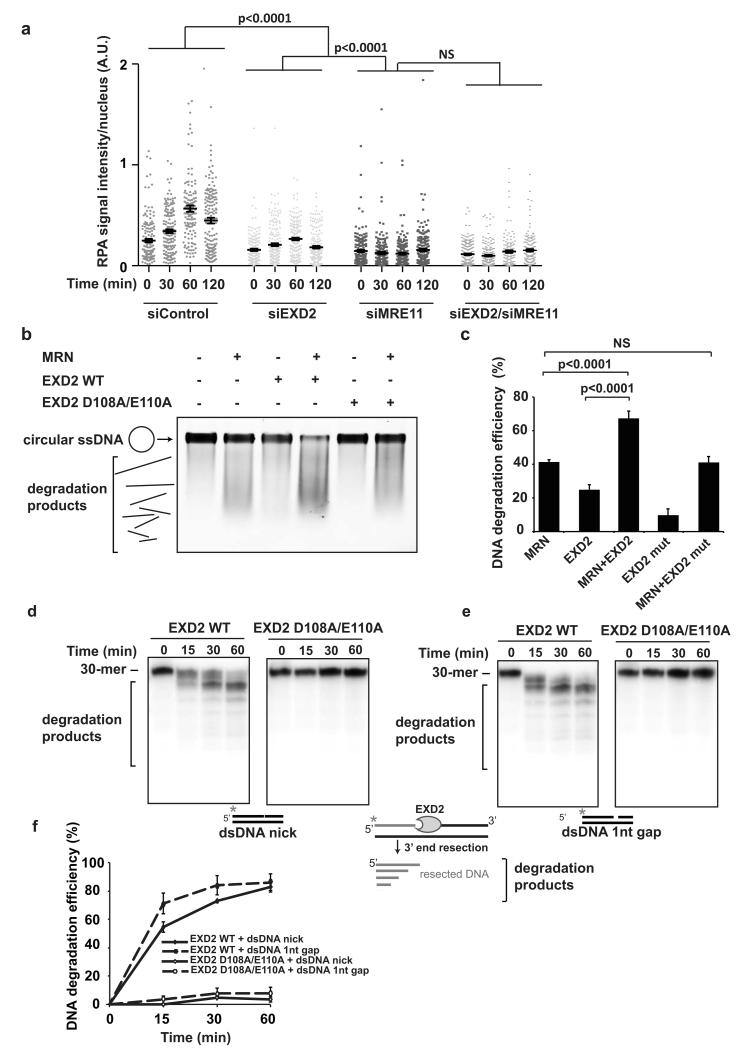
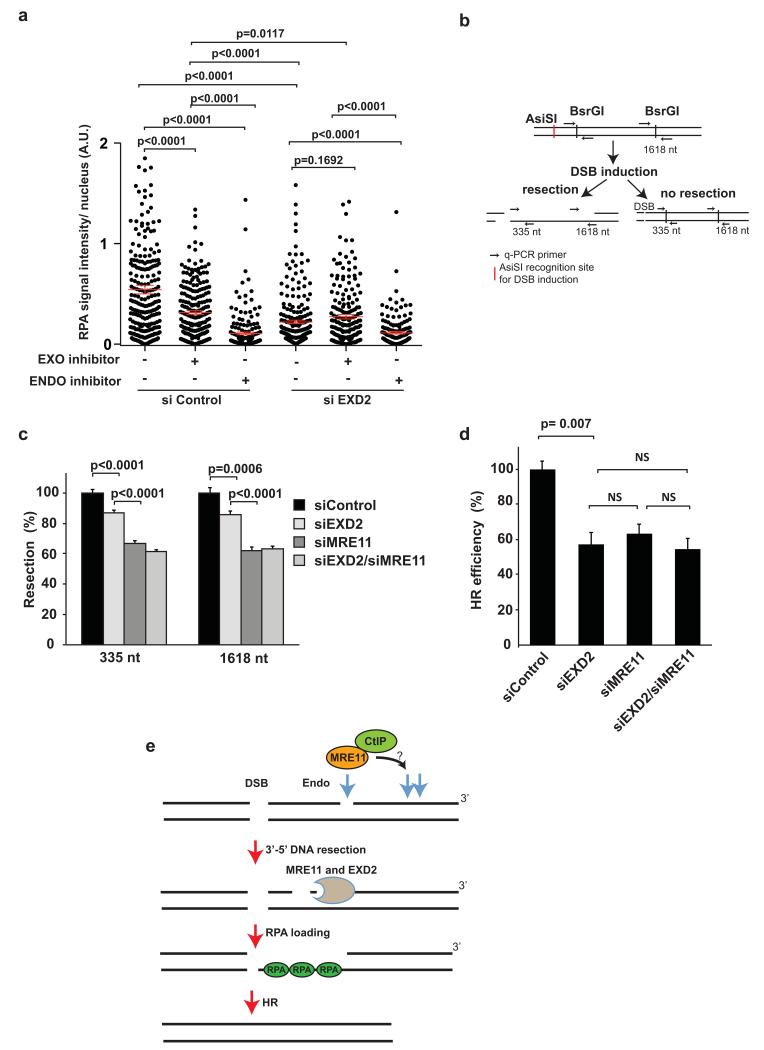
Repair of DNA double-strand breaks (DSBs) by homologous recombination (HR) is critical for survival and genome stability of individual cells and organisms, but also contributes to the genetic diversity of species. A vital step in HR is MRN-CtIP-dependent end resection, which generates the 3' single-stranded DNA overhangs required for the subsequent strand exchange reaction. Here, we identify EXD2 (also known as EXDL2) as an exonuclease essential for DSB resection and efficient HR. EXD2 is recruited to chromatin in a damage-dependent manner and confers resistance to DSB-inducing agents. EXD2 functionally interacts with the MRN complex to accelerate resection through its 3'-5' exonuclease activity, which efficiently processes double-stranded DNA substrates containing nicks. Finally, we establish that EXD2 stimulates both short- and long-range DSB resection, and thus, together with MRE11, is required for efficient HR. This establishes a key role for EXD2 in controlling the initial steps of chromosomal break repair.


Figures

Figure 1
Figure 1. EXD2 is a CtIP interactor and its depletion sensitizes cells to DNA damage
a) Table showing proteins identified in IP/MS analysis of GFP-Trap purification from U2OS cells stably expressing GFP-CtIP. b) Input (0.4% of total IP) and eluate fractions from immunoprecipitations of lysates prepared from U2OS cells stably expressing GFP-CtIP are shown with blocked agarose beads serving as a negative control (beads). Uncropped images of blots are shown in Supplementary Fig. 7. This experiment was carried out once as a validation of mass spectrometry data. c) Input (0.4% of total IP) and eluate fractions of FLAG-HA-EXD2 pull downs from HEK293-FT cells transiently expressing this fusion protein treated with 1 μM CPT for 1h or left untreated as indicated. IP performed on mock-transfected HEK293FT cells serves as a negative control. This experiment was carried out two times independently. Uncropped images of blots are shown in Supplementary Fig. 7. d, e and f) U2OS cells 72h post-transfection with control siRNA (siControl) or two independent siRNAs targeting EXD2 (siEXD2-1 or 2) were treated with the indicated doses of either ionizing radiation (IR), campthotecin (CPT) or phleomycin. Survival data represent mean +/− SEM, (n=3 independent experiments).
Figure 2
Figure 2. EXD2 depletion impairs DNA end-resection following DSB induction
a) Representative images of U2OS cells 72h post-transfection with control siRNA (siControl) or an siRNA oligo targeting EXD2 (siEXD2) treated with 1 μM CPT for 1h as indicated and stained for RPA and DAPI. Scale bar = 20μm. b) Quantification of the percentage of U2OS cells treated as in (a). with greater than 15 RPA foci per nucleus. Bars represent +/− SEM. n=412 cells (siControl untreated), 358 cells (siEXD2 untreated), 396 cells (siControl 1μM CPT) and 403 cells (siEXD2 1μM CPT) respectively, grouped from three independent experiments. Statistical significance was determined by the Chi-square test. c) Western blotting of various DDR proteins in U2OS cells 72h post-transfection with control siRNA (siControl) or an siRNA oligo targeting EXD2 (siEXD2) treated with 1 μM CPT for indicated amounts of time. Chk2-p T68 acts as a control for ATM activation, RPA2 pS4/S8 acts to indicate resection efficiency, γH2AX serves to indicate DSB induction with RPA and histone H3 acting as loading controls. This experiment was carried out two times independently. Uncropped images of blots are shown in Supplementary Fig. 7. d) Representative images of U2OS cells 72h post-transfection with control siRNA (siControl) or an siRNA oligo targeting EXD2 (siEXD2) treated with 1 μM CPT for 1h as indicated and stained for BrdU and DAPI. BrdU staining was carried out under non-denaturing conditions, with foci indicating the presence of ssDNA. Scale bar = 5μm. e) Quantification of the percentage of U2OS cells treated as in (d), exhibiting greater than 15 BrdU foci per nucleus. n=311 cells (siControl untreated), 300 cells (siEXD2 untreated), 300 cells (siControl 1μM CPT) and 300 cells (siEXD2 1μM CPT) respectively, grouped from three independent experiments. Error bars represent +/− SEM. The Chi-square test was used to determine statistical significance. f) Chromatin fractionation of HeLa cells untreated or treated with 500 μM phleomycin for 1h as indicated. γH2AX and RPA2 pS4/S8 are used as markers of DNA damage and histone H3 (H3) acts as a loading control. This experiment was carried out two times independently. Uncropped images of blots are shown in Supplementary Fig. 7.
Figure 3
Figure 3. EXD2 promotes homologous recombination and suppresses genome instability
a) RAD51 foci in U2OS cells 72h following transfection with control siRNA (siControl) or an siRNA oligo targeting EXD2 (siEXD2). Cells were either untreated or were exposed to 8 Gy IR and left to recover for 6h prior to fixation and staining for RAD51 and DAPI as indicated. Scale bar = 20μm. b) Quantification of the percentage of cells treated as in (a), exhibiting RAD51 foci; n=334 cells (siControl untreated), 368 cells (siEXD2 untreated), 378 cells (siControl 8Gy IR) and 376 cells (siEXD2 8gy IR) respectively, grouped from three independent experiments. Error bars represent +/− SEM. The Chi-square test was used to determine statistical significance. c) Quantification of the relative efficiency of HR as measured by the DR-GFP assay (see methods for details) in cells treated with control siRNA (siControl) or an siRNA oligo targeting EXD2 (siEXD2). Efficiency of HR following transient expression of I-SceI enzyme was analysed by FACS and siEXD2 samples compared to the siControl (normalized to 100%). Data represent the mean +/− SEM (n=3 independent experiments). Statistical significance was determined using the student’s t-test. d) siRNA-treatment was carried out using either control siRNA (siControl) or siRNA targeting EXD2 (siEXD2) in cells treated with the indicated doses of Olaparib. Survival data represent mean +/− SEM, (n=3 independent experiments). e) Quantification of the frequency of chromosomal aberrations from mitotic spreads prepared from U2OS cells treated with control siRNA (siControl) or an siRNA smartpool targeting EXD2 (siEXD2). Error bars represent +/− SEM, n= 75metaphase spreads pooled from 3 independent experiments. Statistical significance was determined using the student’s t-test.
Figure 4
Figure 4. EXD2 displays 3′ – 5′ exonuclease activity in vitro
a) 5′ radiolabeled ssDNA 50-mer substrate (10 nM molecules) was incubated for the indicated amounts of time with EXD2 WT or EXD2 D108A E110A mutant protein (70 nM). Samples were resolved on a 20% TBE-Urea polyacrylamide gel and visualised by phosphorimaging. This experiment was carried out two times independently. b) 3′ radiolabeled ssDNA 50-mer substrate (0.25 μM molecules) was incubated for the indicated amounts of time with EXD2 WT or EXD2 D108A E110A (70 nM) mutant protein. Samples were resolved by TLC in 1M sodium formate pH 3.4 and visualised by phosphorimaging. This experiment was carried out two times independently. c) 5′ dsDNA 50-mer substrates (10 nM molecules) were incubated for the indicated amounts of time with EXD2 WT protein (70 nM). Samples were resolved on a 20% TBE-Urea polyacrylamide gel and visualised by phosphorimaging. This experiment was carried out two times independently. d) 5′ radiolabeled ssDNA or dsDNA with 5’overhang substrate (3 nM molecules) was incubated for indicated amounts of time with EXD2 WT (K76 - V564) protein (25 nM). Samples were resolved on a 20% TBE-Urea polyacrylamide gel and visualised by phosphorimaging. This experiment was carried out two times independently. e) 5′ radiolabeled ssDNA or dsDNA (3 nM molecules) with 3′ end blocked by biotin – streptavidin was incubated for indicated time with EXD2 WT (K76 - V564) protein (25 nM) in buffer supplemented with 1 mM ATP. Samples were resolved on a 20% TBE-Urea polyacrylamide gel and visualised by phosphorimaging. This experiment was carried out two times independently. f) (upper panel) EXD2 WT (K76 - V564) gel-filtration fractions were tested for nuclease activity against 5′ radiolabeled ssDNA (10 nM molecules). Reactions were incubated for 30 min and resolved on a 15% TBE-Urea polyacrylamide gel and visualised by phosphorimaging; (lower panel) Coomassie blue–stained gel depicting the EXD2 protein in gel-filtration fractions analysed in the upper panel. This experiment was carried out two times independently.
Figure 5
Figure 5. EXD2’s nuclease activity is required for DSB repair in vivo
a) U2OS control cells or cells stably expressing Flag–HA–EXD2 WT or D108A–E110A mutant fusion proteins 72 h post transfection with an siRNA targeting EXD2 3′ UTR or without siRNA were treated with 1 μM CPT for 1 h. Quantification of the percentage of cells with more than 15 BrdU foci per nucleus is represented. n = 223 cells (U2OS – EXD2 siRNA), 235 cells (U2OS + EXD2 siRNA), 209 cells (WT clone 1 – EXD2 siRNA), 170 cells (WT clone 1 + EXD2 siRNA), 183 cells (WT clone 2 – EXD2 siRNA), 203 cells (WT clone 2 + EXD2 siRNA), 200 cells (D108A–E110A clone 1 – EXD2 siRNA), 190 cells (D108A–E110A clone 1 + EXD2 siRNA), 282 cells (D108A–E110A clone 2 – EXD2 siRNA) and 223 cells (D108A–E110A clone 2 + EXD2 siRNA), pooled from three independent experiments. (b) U2OS control cells or cells stably expressing Flag–HA–EXD2 WT or D108A–E110A mutant fusion proteins 72 h post transfection with an siRNA targeting EXD2’s 3′ UTR or without siRNA were treated with 1 μM CPT for 1 has indicated. Cells were fixed and stained for RPA by immunofluorescence with quantification of the percentage of cells with more than 15 RPA foci per nucleus represented. n = 308 cells (U2OS – EXD2 siRNA), 308 cells (U2OS + EXD2 siRNA), 327 cells (WT clone 1 – EXD2 siRNA), 320 cells (WT clone 1 + EXD2 siRNA), 308 cells (WT clone 2 – EXD2 siRNA), 353 cells (WT clone 2 + EXD2 siRNA), 321 cells (D108A–E110A clone 1 – EXD2 siRNA), 368 cells (D108A–E110A clone 1 + EXD2 siRNA), 370 cells (D108A–E110A clone 2 – EXD2 siRNA) and 337 cells (D108A–E110A clone 2 + EXD2 siRNA), pooled from three independent experiments. At least 100 cells were scored for each experiment. (c) U2OS control cells or cells stably expressing Flag–HA–EXD2 WT or D108A–E110A mutant fusion proteins 72 h post transfection with an siRNA targeting EXD2 3′ UTR or without siRNA were irradiated with 8 Gy. Cells were fixed and stained for RAD51 6 h post treatment and the percentage of RAD51-positive cells quantified. n = 213 cells (U2OS – EXD2 siRNA), 254 cells (U2OS + EXD2 siRNA), 169 cells (WT clone 1 – EXD2 siRNA), 176 cells (WT clone 1 + EXD2 siRNA), 191 cells (WT clone 2 – EXD2 siRNA), 184 cells (WT clone 2 + EXD2 siRNA), 195 cells (D108A–E110A clone 1 – EXD2 siRNA), 224 cells (D108A–E110A clone 1), 191 cells (D108A–E110A clone 2 – EXD2 siRNA) and 198 cells (D108A–E110A clone 2 + EXD2 siRNA), pooled from three independent experiments. (d) Survival assay in U2OS cells complemented with WT or D108A–E110A mutant EXD2 protein transfected with control siRNA (sample 1) or siRNA targeting 3′ UTR of EXD2 (samples 2–6). Cells were treated with 5 μg ml–1 phleomycin, and the resistance of cells transfected with control siRNA was set at 100% (n = 4 independent experiments). For all panels, bars represent mean ± s.e.m. Statistical significance was determined using the Chi-square test (a–c) or Student’s t-test (d).
Figure 6
Figure 6. EXD2 and MRE11 promote resection through a common mechanism with MRE11
a) Quantification of the signal intensity of RPA foci in U2OS cells depleted for EXD2, MRE11 or both by siRNA (as indicated) at various time-points following treatment with 8Gy IR. ImageJ was used to quantify signal intensity per nucleus (using RPA as a marker of resection, DAPI staining marks the nucleus). n= 154, 155, 150, and 161 cells for siControl 0, 30, 60 and 120 min post-treatment, respectively. n= 177, 187, 189, and 173 cells for siEXD2 0, 30, 60 and 120 min post-treatment, respectively. n= 182, 167, 184, and 187 cells for siMRE11 0, 30, 60 and 120 min post-treatment, respectively. n= 214, 182, 150 and 163 cells for siEXD2/siMRE11 0, 30, 60 and 120 min post-treatment, respectively. In all cases cells were pooled from three independent experiments. Error bars represent +/− SEM. Statistical significance was determined using the Mann-Whitney test. b) EXD2 stimulates MRN complex–dependent nuclease activity. MRN complex (MRE11-RAD50-NBS1) (50 nM) was incubated with PhiX174 substrate DNA in the presence or absence of EXD2 WT (K76 - V564) or corresponding mutant protein (350 nM). Reaction products were resolved on agarose gel, stained with SYBR Gold and visualized. c) Quantification of the percentage of intact DNA from (b) representing DNA degradation efficiency. The percentage of intact DNA was obtained relative to the no-protein control sample. Error bars represent +/− SEM, n= 4 independent experiments, student’s t-test was used to determine statistical significance. d) and e) 5′ radiolabeled dsDNA substrate (10 nM molecules) containing a nick (d) or a 1 nucleotide gap (e) was incubated for the indicated amounts of time with EXD2 WT (K76 - V564) or EXD2 (K76 - V564) D108A E110A protein (100 nM). Samples were resolved on a 20% TBE-Urea polyacrylamide gel and visualised by phosphorimaging. These experiments were carried out three times independently. f) Quantification of the efficiency of DNA degradation from (d) and (e). Error bars represent +/− SEM, n= 3 independent experiments.
Figure 7
Figure 7. EXD2 is required for efficient homologous recombination
a) Quantification of the signal intensity of RPA foci in U2OS cells treated with DMSO or small molecule inhibitors specifically targeting MRE11’s exo- or endonuclease activity (EXO or ENDO inhibitors, as indicated) 72h post-transfection with siRNA targeting EXD2 (siEXD2) or control siRNA (siControl). Cells were pre-treated for 30 min with 100 μM PFM39 (EXO inhibitor) or 100 μM PFM01 (ENDO inhibitor) before irradiation with 3Gy ionizing radiation. Cells were harvested 2h post-irradiation and stained for RPA foci. The intensity of RPA signal per cell nucleus was analysed using ImageJ n = 231 cells (siControl EXO/ENDO −), 226 cells (siControl, EXO +), 177 cells (siControl, ENDO +), 233 cells (siEXD2 EXO/ENDO −), 201 cells (siEXD2 EXO +), 158 cells (siEXD2, ENDO +), respectively, pooled from three independent experiments. Error bars represent +/− SEM. The Mann-Whitney test was used to determine statistical significance. b) Schematic diagram of the resection assay in human cells using the ER-AsiSI system. Arrows indicate q-PCR primers for measurement of resection efficiency following induction of the DSB. c) ER-AsiSI U2OS cells were treated with 300 nM 4-OHT for 1 h, genomic DNA was extracted and digested or mock digested with BsrGI overnight. DNA-end resection adjacent to the DSB was measured by qPCR. The percentage of ssDNA was calculated and related to the siControl treated sample, which was set as 100%. Bars represent mean values +/− SEM (n= 5 independent experiments). Student’s t-test was used to determine statistical significance. d) Quantification of the relative efficiency of HR in U2OS cells carrying the DR-GFP reporter construct with concomitant depletion of EXD2 and MRE11 by siRNA following transient expression of the I-SceI enzyme (see Methods and text for details). Efficiency of HR was measured by FACS and all knockdowns compared to siControl (normalized to 100%). Data represents the mean +/− SEM (n= 3 independent experiments). Student’s t-test was employed to determine statistical significance. e) Schematic model of EXD2’s putative role in DNA-end resection. DSB induction leads to recruitment of MRE11, whose endonuclease activity results in nicking of the DNA strand proximal to the DSB. EXD2 can then process this substrate, either alone or in conjunction with the MRN complex, thereby promoting DNA-end resection.

References

    1. Jackson SP, Bartek J. The DNA-damage response in human biology and disease. Nature. 2009;461:1071–1078. - PMC - PubMed
    1. Malkova A, Haber JE. Mutations arising during repair of chromosome breaks. Annual review of genetics. 2012;46:455–473. - PubMed
    1. Krogh BO, Symington LS. Recombination proteins in yeast. Annual review of genetics. 2004;38:233–271. - PubMed
    1. Symington LS, Gautier J. Double-strand break end resection and repair pathway choice. Annual review of genetics. 2011;45:247–271. - PubMed
    1. Huertas P, Cortes-Ledesma F, Sartori AA, Aguilera A, Jackson SP. CDK targets Sae2 to control DNA-end resection and homologous recombination. Nature. 2008;455:689–692. - PMC - PubMed

Publication types