

Sp1 and Sp3 Are the Transcription Activators of Human ek1 Promoter in TSA-Treated Human Colon Carcinoma Cells
- PMID: 26807725
- PMCID: PMC4725723
- DOI: 10.1371/journal.pone.0147886
Sp1 and Sp3 Are the Transcription Activators of Human ek1 Promoter in TSA-Treated Human Colon Carcinoma Cells
Abstract
Background: Ethanolamine kinase (EK) catalyzes the phosphorylation of ethanolamine, the first step in the CDP-ethanolamine pathway for the biosynthesis of phosphatidylethanolamine (PE). Human EK exists as EK1, EK2α and EK2β isoforms, encoded by two separate genes, named ek1 and ek2. EK activity is stimulated by carcinogens and oncogenes, suggesting the involvement of EK in carcinogenesis. Currently, little is known about EK transcriptional regulation by endogenous or exogenous signals, and the ek gene promoter has never been studied.
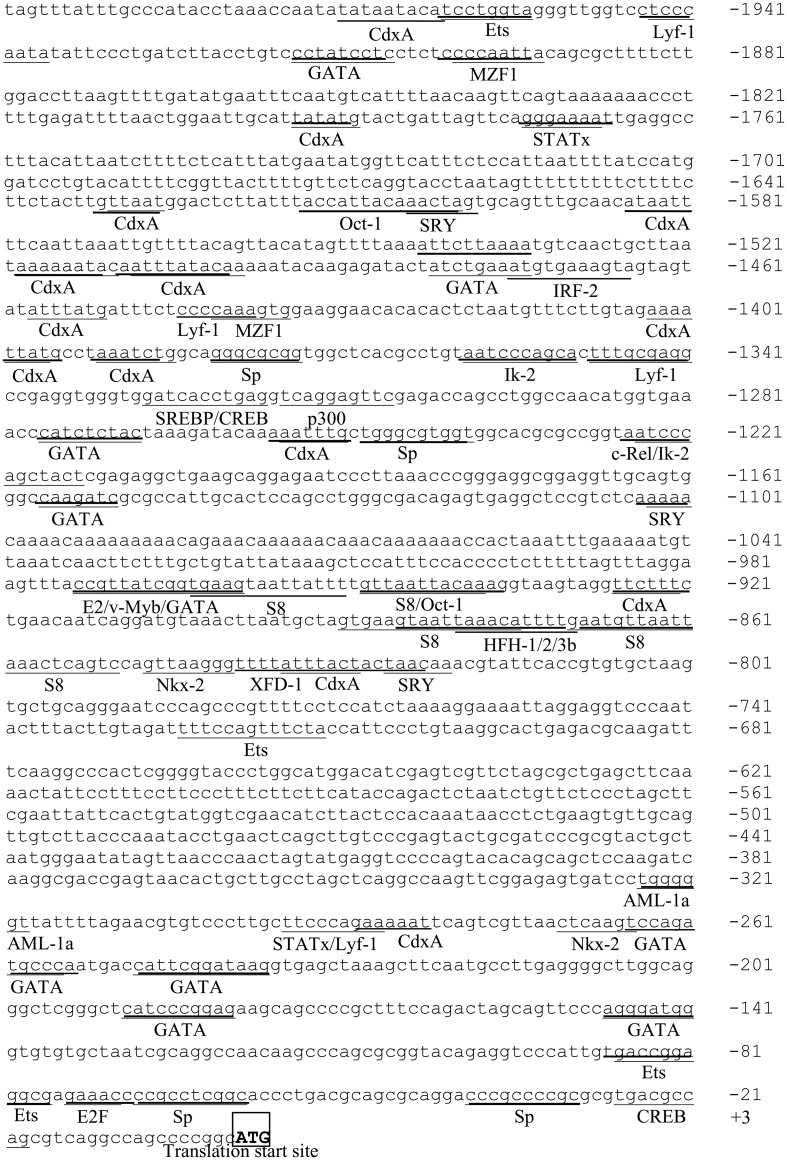
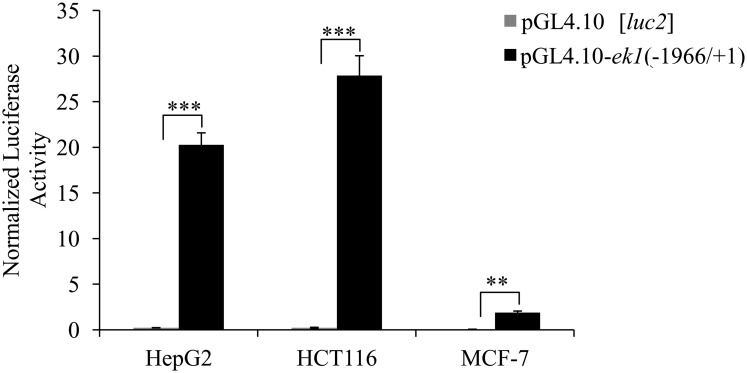
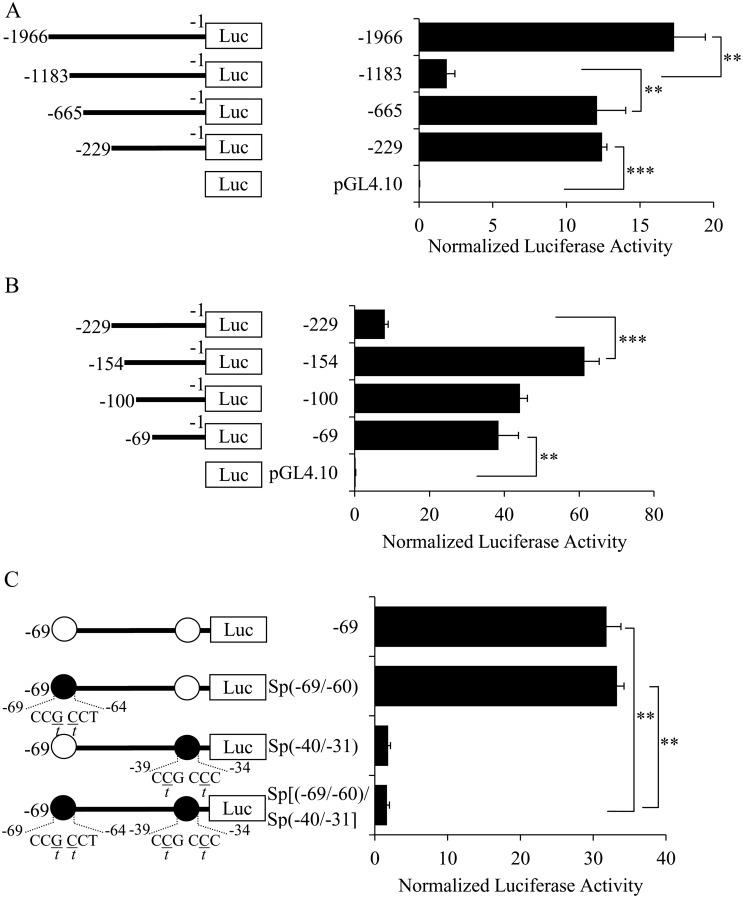
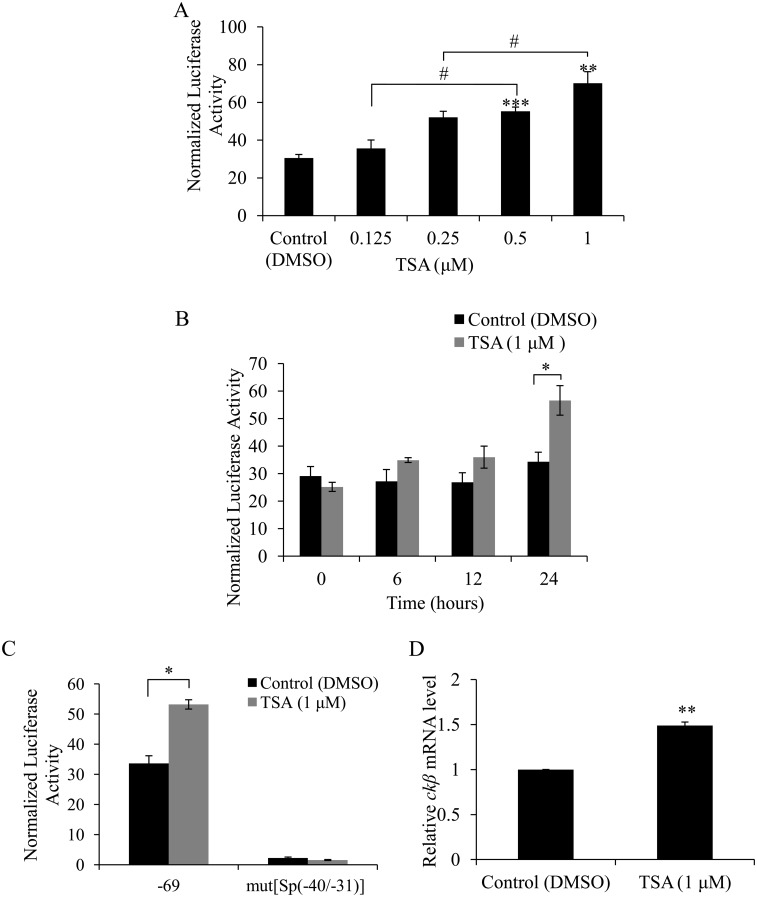
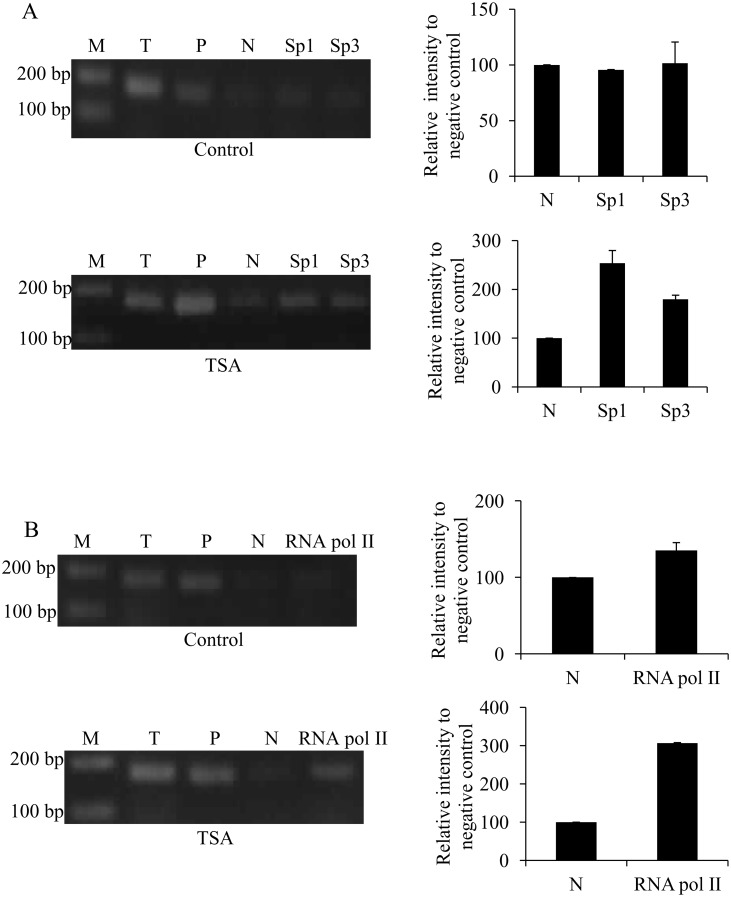
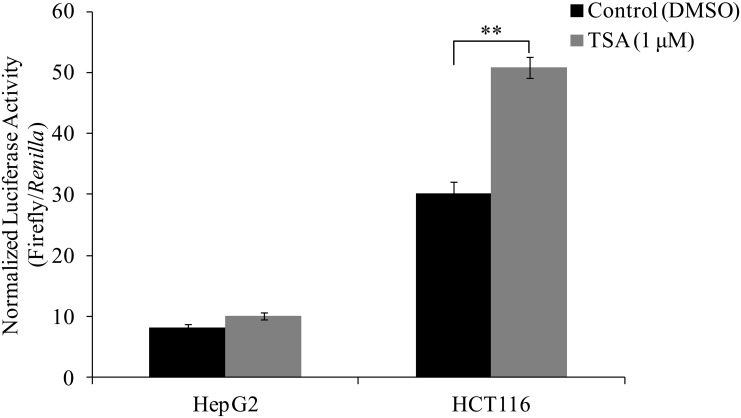
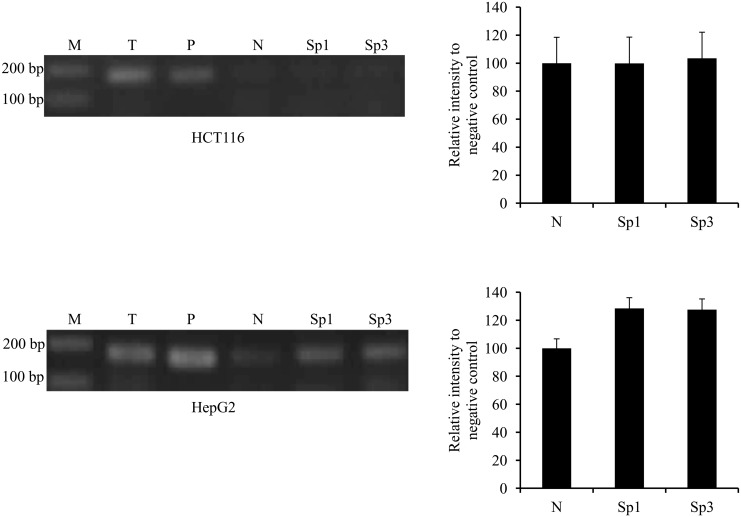
Methodology/principal findings: In this report, we mapped the important regulatory regions in the human ek1 promoter. 5' deletion analysis and site-directed mutagenesis identified a Sp site at position (-40/-31) that was essential for the basal transcription of this gene. Treatment of HCT116 cells with trichostatin A (TSA), a histone deacetylase inhibitor, significantly upregulated the ek1 promoter activity through the Sp(-40/-31) site and increased the endogenous expression of ek1. Chromatin immunoprecipitation assay revealed that TSA increased the binding of Sp1, Sp3 and RNA polymerase II to the ek1 promoter in HCT116 cells. The effect of TSA on ek1 promoter activity was cell-line specific as TSA treatment did not affect ek1 promoter activity in HepG2 cells.
Conclusion/significance: In conclusion, we showed that Sp1 and Sp3 are not only essential for the basal transcription of the ek1 gene, their accessibility to the target site on the ek1 promoter is regulated by histone protein modification in a cell line dependent manner.
Conflict of interest statement
Figures
Similar articles
-
Trichostatin A, a histone deacetylase inhibitor, activates the IGFBP-3 promoter by upregulating Sp1 activity in hepatoma cells: alteration of the Sp1/Sp3/HDAC1 multiprotein complex.Biochem Biophys Res Commun. 2002 Aug 30;296(4):1005-12. doi: 10.1016/s0006-291x(02)02001-6. Biochem Biophys Res Commun. 2002. PMID: 12200149
-
Histone deacetylase inhibitors activate INK4d gene through Sp1 site in its promoter.Oncogene. 2004 Jul 8;23(31):5340-9. doi: 10.1038/sj.onc.1207689. Oncogene. 2004. PMID: 15107822
-
Expression profiling of choline and ethanolamine kinases in MCF7, HCT116 and HepG2 cells, and the transcriptional regulation by epigenetic modification.Mol Med Rep. 2015 Jan;11(1):611-8. doi: 10.3892/mmr.2014.2707. Epub 2014 Oct 20. Mol Med Rep. 2015. PMID: 25333818
-
Both Sp1 and Sp3 are responsible for p21waf1 promoter activity induced by histone deacetylase inhibitor in NIH3T3 cells.J Cell Biochem. 1999 Jun 1;73(3):291-302. J Cell Biochem. 1999. PMID: 10321829
-
The histone deacetylase inhibitor trichostatin A mediates upregulation of 5-lipoxygenase promoter activity by recruitment of Sp1 to distinct GC-boxes.Biochim Biophys Acta. 2007 Oct;1771(10):1271-82. doi: 10.1016/j.bbalip.2007.08.003. Epub 2007 Aug 17. Biochim Biophys Acta. 2007. PMID: 17894944
Cited by
-
A Scalable Epitope Tagging Approach for High Throughput ChIP-Seq Analysis.ACS Synth Biol. 2017 Jun 16;6(6):1034-1042. doi: 10.1021/acssynbio.6b00358. Epub 2017 Mar 7. ACS Synth Biol. 2017. PMID: 28215080 Free PMC article.
-
3-Hydroxyphthalic Anhydride-Modified Chicken Ovalbumin as a Potential Candidate Inhibits SARS-CoV-2 Infection by Disrupting the Interaction of Spike Protein With Host ACE2 Receptor.Front Pharmacol. 2021 Jan 14;11:603830. doi: 10.3389/fphar.2020.603830. eCollection 2020. Front Pharmacol. 2021. PMID: 33519467 Free PMC article.
-
Promoter methylation inhibits expression of tumor suppressor KIBRA in human clear cell renal cell carcinoma.Clin Epigenetics. 2017 Oct 6;9:109. doi: 10.1186/s13148-017-0415-6. eCollection 2017. Clin Epigenetics. 2017. PMID: 29046731 Free PMC article.
-
MicroRNA-22 suppresses the growth, migration and invasion of colorectal cancer cells through a Sp1 negative feedback loop.Oncotarget. 2017 May 30;8(22):36266-36278. doi: 10.18632/oncotarget.16742. Oncotarget. 2017. PMID: 28422727 Free PMC article.
-
Spontaneous Glutamatergic Synaptic Activity Regulates Constitutive COX-2 Expression in Neurons: OPPOSING ROLES FOR THE TRANSCRIPTION FACTORS CREB (cAMP RESPONSE ELEMENT BINDING) PROTEIN AND Sp1 (STIMULATORY PROTEIN-1).J Biol Chem. 2016 Dec 30;291(53):27279-27288. doi: 10.1074/jbc.M116.737353. Epub 2016 Nov 14. J Biol Chem. 2016. PMID: 27875294 Free PMC article.
References
-
- Kiss Z. Regulation of mitogenesis by water-soluble phospholipid intermediates. Cell Signal. 1999;11(3):149–57. Epub 1999/06/03. S0898-6568(98)00057-6 [pii]. . - PubMed
-
- Kiss Z, Crilly KS. Ha-Ras stimulates uptake and phosphorylation of ethanolamine: inhibition by wortmannin. FEBS Lett. 1995;357(3):279–82. Epub 1995/01/09. 0014-5793(94)01371-7 [pii]. . - PubMed
Publication types
MeSH terms
Substances
LinkOut - more resources
Full Text Sources
Other Literature Sources
Research Materials
