Review
. 2016 Jun 8;116(11):6516-51.
doi: 10.1021/acs.chemrev.5b00562. Epub 2016 Jan 25.

Protein Ensembles: How Does Nature Harness Thermodynamic Fluctuations for Life? The Diverse Functional Roles of Conformational Ensembles in the Cell

Affiliations
Review

Protein Ensembles: How Does Nature Harness Thermodynamic Fluctuations for Life? The Diverse Functional Roles of Conformational Ensembles in the Cell

Guanghong Wei et al. Chem Rev. .

Abstract

All soluble proteins populate conformational ensembles that together constitute the native state. Their fluctuations in water are intrinsic thermodynamic phenomena, and the distributions of the states on the energy landscape are determined by statistical thermodynamics; however, they are optimized to perform their biological functions. In this review we briefly describe advances in free energy landscape studies of protein conformational ensembles. Experimental (nuclear magnetic resonance, small-angle X-ray scattering, single-molecule spectroscopy, and cryo-electron microscopy) and computational (replica-exchange molecular dynamics, metadynamics, and Markov state models) approaches have made great progress in recent years. These address the challenging characterization of the highly flexible and heterogeneous protein ensembles. We focus on structural aspects of protein conformational distributions, from collective motions of single- and multi-domain proteins, intrinsically disordered proteins, to multiprotein complexes. Importantly, we highlight recent studies that illustrate functional adjustment of protein conformational ensembles in the crowded cellular environment. We center on the role of the ensemble in recognition of small- and macro-molecules (protein and RNA/DNA) and emphasize emerging concepts of protein dynamics in enzyme catalysis. Overall, protein ensembles link fundamental physicochemical principles and protein behavior and the cellular network and its regulation.


Figures

Figure 1.
Figure 1.
The energy landscape defines the amplitude and timescale of protein motions. (A), One-dimensional cross-section through the high dimensional energy landscape of a protein showing the hierarchy of protein dynamics and the energy barriers. Each tier is classified following the description introduced by Frauenfelder, Sligar and Wolynes and co-workers. A state is defined as a minimum in the energy surface, whereas a transition state is the maximum between the wells. Lower tiers describe faster fluctuations between a large number of closely related substates within each tier-0 state. (B), Timescale of dynamic processes in proteins and the experimental methods that can detect fluctuations on each timescale. (Adapted with permission from reference . © 2007 Macmillan Publishers Limited).
Figure 2.
Figure 2.
Schematic of energy landscapes. (a) A folded protein (human nucleoside diphosphate kinase (NDPK), PDB ID: 1nsk) and (B) an intrinsically disordered peptide (CcdA C-terminal, PDB ID: 3tcj); (C) close-up of the minimal free energy well in (A), where IDRs are shown in red and ordered regions are shown in white. The example NDPK conformations are shown again enlarged to the right for better visualization. In (C) lower free energy (dark blue) represents more probable conformations. Representative protein conformations were generated with molecular dynamics simulations in CHARMM using coordinates from the 1nsk and 3tcj PDB structures as initial states. Reprinted with permission from reference . © 1996–2015 MDPI AG
Figure 3.
Figure 3.
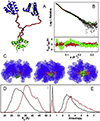
Ensemble optimization analysis of the SAXS profile measured for L12. (a) Cartoon of a single L12 conformation, 1rqu, showing the NTD dimer (green), the CTD (blue), and the linker (red). (b) Logarithm of the scattering intensity (black dots) as a function of the momentum transfer, s = 4πsin(θ)/λ. The fitted scattering profile of the optimized ensemble (OE), obtained by the Ensemble Optimization Method (EOM) approach, is shown in red. The theoretical scattering curve of the random ensemble (RE, green line) is shown for comparison. The bottom panel displays the point-by-point error function for the two ensembles using the same color code. Both ensembles contain 10,000 independent conformers. (c) Three orthogonal views of a random subset (N = 50) of the OE; color code as in panel A. The orientation in the side view (left) is the same as in panel A. (d) Radius of gyration (Rg) and (e) anisotropy (A) distributions for the RE (black lines) and the OE (red lines). The sharp peaks at A < 1 correspond to oblate conformers with populations of 4.8% and 14.2% for the OE and RE, respectively. Reprinted with permission from reference . © 2015 Elsevier B.V.
Figure 4.
Figure 4.
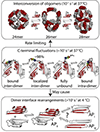
Dynamic movements of αB-crystallin in solution. A model of how the dynamic motions of αB-crystallin at three different time scales are inter-related. The C-terminus is localized to an adjacent dimer with the IXI unbound for the majority of time, but converts on the millisecond time scale into a bound conformation that can be either inter- or intra-molecular (middle panel). This tail-binding may induce distortions in the dimer interface that lead to rearrangements including breaking of the dimer interface or registration shifts (lower panel). Together these two effects determine the rate of subunit exchange between higher-order oligomers, which is ultimately rate-limited by C-terminal fluctuations (upper panel). Reprinted with permission from reference . © 2015 Elsevier B.V.
Figure 5.
Figure 5.
Effect of open and closed UvrD conformation on unwinding and rezipping activity. (A): location of donor and acceptor fluorophores for smFRET measurement and model of UvrD conformational switching. Upper (and lower) orange arrows denote 2B (and 1A-2A) domain orientation. (B): a representative time trace of monomeric UvrD conformation and activity. (C): correlation between UvrD activity and conformation. The color map represents the probability distribution of FRET state and velocity. Adapted with permission from reference . © 2015 American Association for the Advancement of Science.
Figure 6.
Figure 6.
Structural analysis of K18 monomer in aqueous solution at 310 K. (A) Representative conformations for the top eight most-populated clusters (labeled by “Cn”, n=1~8) along with their corresponding probabilities. Secondary structures are displayed in new-cartoon style, with different colors representing different repeats, blue for R1, red for R2, green for R3, and purple for R4 and the last four residues after R4. For each structure, helices are indicated with H1, H2, …, and β-sheets are labeled with B1, B2, …; β-strands in the same sheet are labeled with Bna, Bnb, Bnc...(n = 1, 2, …). Two adjacent β-strands (for example, a and b) are labeled using two neighboring letters in the alphabet. (B) Sequence views of the eight clusters. The amino acid (aa) residue numbering is based on the full-length 441-aa tau protein. The β-strand is shown with a blue arrow and the helix with a red cylinder. Each helix/β-strand is labeled using the same label and color as used in (A). (C, D) Scatter plots comparing experimental (Expt.) and SPARTA-predicted (MD) chemical shifts (CSs) and secondary chemical shifts (SCSs) of the Cα atom. The Pearson correlation coefficients (R) between experimental and MD-generated CSs and SCSs are indicated. Adapted with permission from reference . © 2015 American Chemical Society.
Figure 7.
Figure 7.
Analyses of conformations of middle segments in each repeat and of the contacts between lysine and cysteine residues in K18. (A) Representative structure of the most populated helical conformation in each repeat. Helical structures are mainly located in the middle region of each repeat: i.e. 250MPDLKNVKSKI260 in R1, 280KKLDLSNVQSK290 in R2, 315LSKVTSKCGSL325 in R3, and 345DFKDRVQSKIG355 in R4. The most populated helix in each repeat was identified by performing a RMSD-based cluster analysis using a backbone-RMSD cutoff of 3 Å. (B) Lys-Cys minimum-distance probability density function (PDF) for conformations in the top eight most-populated clusters (C1~C8). (C) Representative conformation of C5 and C7 showing the close contact between lysine and cysteine residues. Adapted with permission from reference . © 2015 American Chemical Society.
Figure 8.
Figure 8.
Free energy landscape of the Na+ and Cs+ systems. (A) Top and side views of the selectivity filter in the crystal structure are shown (Glu66 in green sticks; oxygen atoms are colored red). In the top view (Left), the distances between the carbonyl and carboxylic group of Glu66 in different monomers are shown as black dotted lines. (B, C) The free energy landscape as a function of the z dipole [nanometers for electron charge (nm*e)] and of the Glu66-Coordination variable for the Na+ (B) and Cs+ system (C). The variable Glu66-Coordination counts the number of carboxylate and carbonyl groups of Glu66 in opposite monomers whose distance is larger than 8 Å. Possible conformations of Glu66 residues corresponding to different minima are shown for both the Na+ and the Cs+ systems. This figure is adopted from reference with permission. Adopted with permission from reference . © 2015 National Academy of Sciences.
Figure 9.
Figure 9.
(A) Network representation of the 3000-state MSM built from the simulations of agonist-bound GPCR with each circle representing an individual conformational state. (B) 10-state MSM built from the 3000-state MSMs using spectral clustering methods to identify kinetically relevant states. The circles in the 3000-state MSM are colored according to their membership in the coarse-grained 10-state MSM. The weight of arrow indicates the transition probability between states. Reproduced with permission from reference . © 2013 Macmillan Publishers Limited.
Figure 10.
Figure 10.
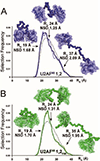
The 20-PDB (light color) or 50-PDB (dark color) ensemble fits of (A) U2AF651,2 (blue) and (B) U2AF651,2FIR (green) SAXS data. The radii of gyration (RG) are plotted on the x-axis, and the frequency of a structure with a given RG on the y-axis. Gray dashed lines plot the randomized starting pool; Solid lines the selected pool. The most typical or divergent selected structures are inset. Reproduced with permission from reference . © 2015 American Chemical Society.

References

    1. Frauenfelder H; Sligar SG; Wolynes PG The energy landscapes and motions of proteins. Science 1991, 254, 1598–1603. - PubMed
    1. Lyle N; Das RK; Pappu RV A quantitative measure for protein conformational heterogeneity. J. Chem. Phys 2013, 139, 121907. - PMC - PubMed
    1. Nagaraju M; McGowan LC; Hamelberg D Cyclophilin A inhibition: targeting transition-state-bound enzyme conformations for structure-based drug design. J. Chem. Inf. Model 2013, 53, 403–410. - PubMed
    1. Cooper A Thermodynamic fluctuations in protein molecules. Proc. Natl. Acad. Sci. U. S. A 1976, 73, 2740–2741. - PMC - PubMed
    1. Karplus M; Weaver DL Protein-folding dynamics. Nature 1976, 260, 404–406. - PubMed

Publication types

LinkOut - more resources