. 2016 Jan 25;11(1):e0148064.
doi: 10.1371/journal.pone.0148064. eCollection 2016.

Time-Dependent Decay of mRNA and Ribosomal RNA during Platelet Aging and Its Correlation with Translation Activity

Affiliations

Time-Dependent Decay of mRNA and Ribosomal RNA during Platelet Aging and Its Correlation with Translation Activity

Catherine Angénieux et al. PLoS One. .

Abstract

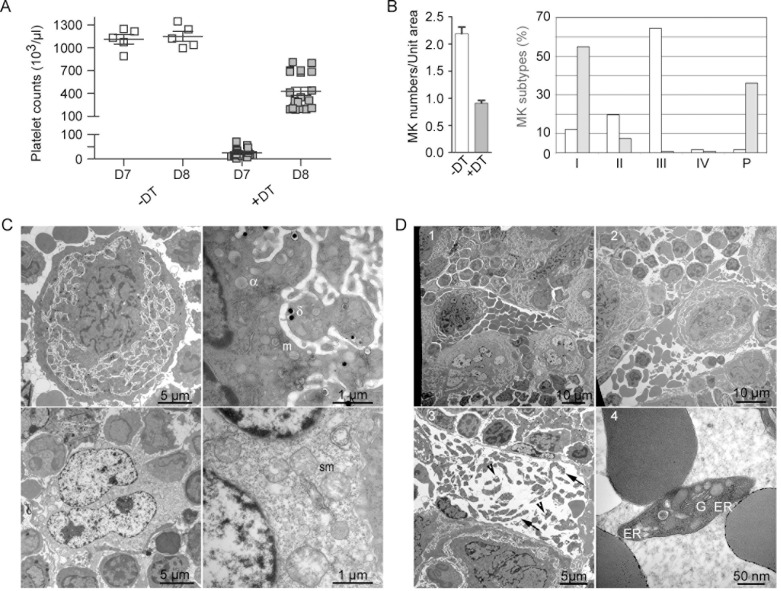
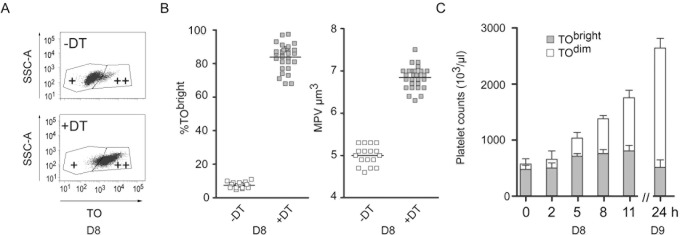
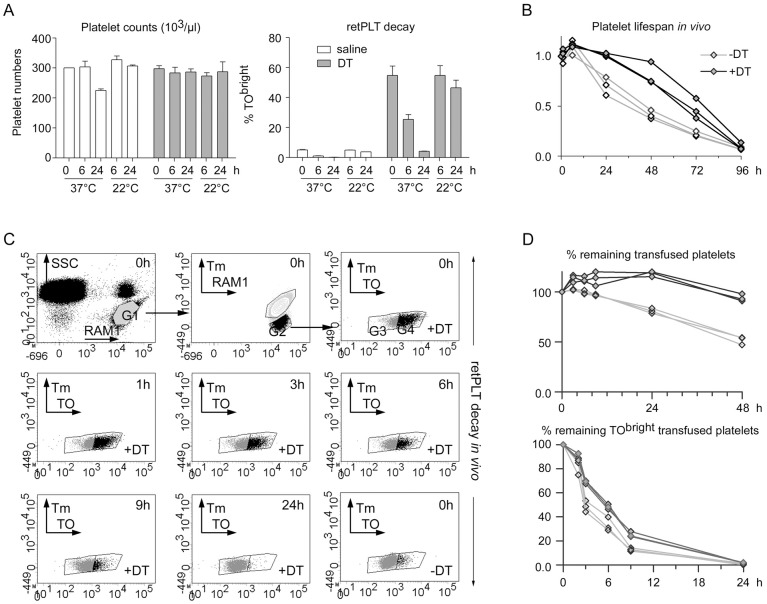
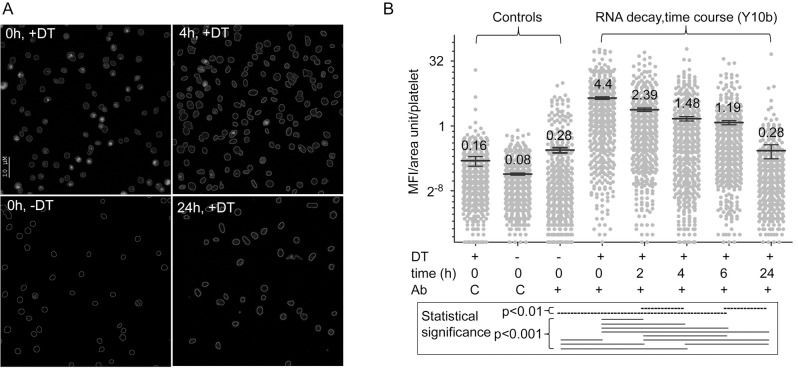
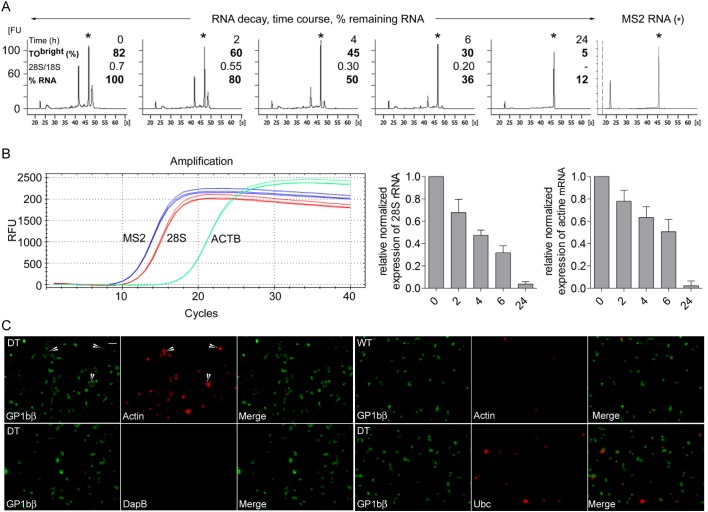
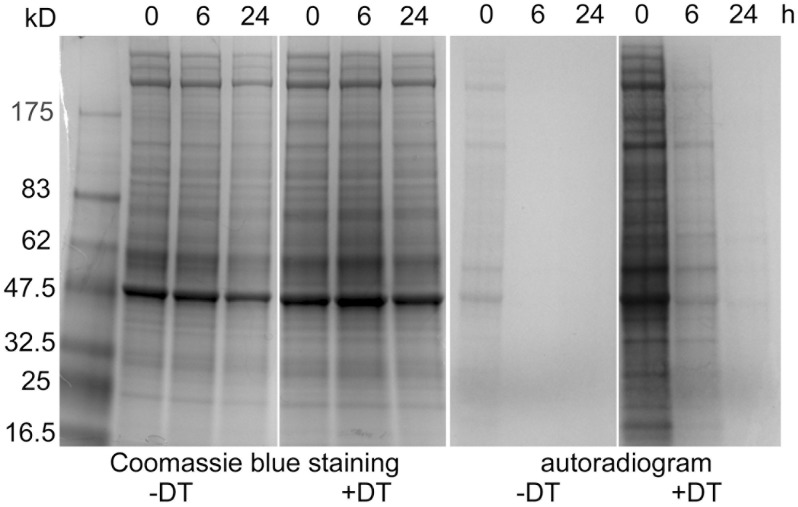
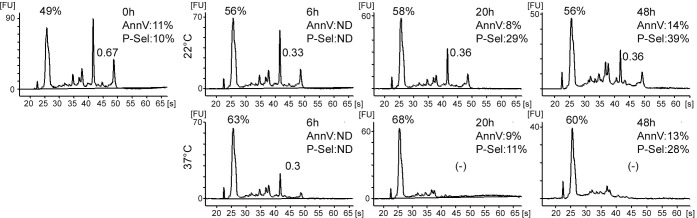
Previous investigations have indicated that RNAs are mostly present in the minor population of the youngest platelets, whereas translation in platelets could be biologically important. To attempt to solve this paradox, we studied changes in the RNA content of reticulated platelets, i.e., young cells brightly stained by thiazole orange (TObright), a fluorescent probe for RNAs. We provoked in mice strong thrombocytopenia followed by dramatic thrombocytosis characterized by a short period with a vast majority of reticulated platelets. During thrombocytosis, the TObright platelet count rapidly reached a maximum, after which TOdim platelets accumulated, suggesting that most of the former were converted into the latter within 12 h. Experiments on platelets, freshly isolated or incubated ex vivo at 37°C, indicated that their "RNA content", here corresponding to the amounts of extracted RNA, and the percentage of TObright platelets were positively correlated. The "RNA Content" normalized to the number of platelets could be 20 to 40 fold higher when 80-90% of the cells were reticulated (20-40 fg/platelet), than when only 5-10% of control cells were TObright (less than 1fg/platelet). TObright platelets, incubated ex vivo at 37°C or transfused into mice, became TOdim within 24 h. Ex vivo at 37°C, platelets lost about half of their ribosomal and beta actin RNAs within 6 hours, and more than 98% of them after 24 hours. Accordingly, fluorescence in situ hybridization techniques confirmed the presence of beta actin mRNAs in most reticulated-enriched platelets, but detected them in only a minor subset of control platelets. In vitro, constitutive translation decreased considerably within less than 6 hours, questioning how protein synthesis in platelets, especially in non-reticulated ones, could have a biological function in vivo. Nevertheless, constitutive transient translation in young platelets under pathological conditions characterized by a dramatic increase in circulating reticulated platelets could deserve to be investigated.


Conflict of interest statement

Competing Interests: The authors have declared that no competing interests exist.

Figures

Fig 1
Fig 1. Enhanced megakaryopoiesis and thrombopoieisis after DT-mediated MK ablation.
F1 iDTR x PF4-Cre mice received 100 ng/day DT or saline for 4 days (first injection on day 1). PLT counts decreased during the following days and PLT rebound occurred between days 7 and 8. (A) PLT counts of saline- and DT-treated mice (n = 5 and 20, respectively) were measured on day 7 and 8. Horizontal bars indicate the mean values of the counts. Comparing the different conditions, a two way ANOVA analysis followed by a Bonferroni post-test indicated a p value of <0.001, except for saline treated samples on days 7 and 8, which displayed no significant differences. (B) On day 5, bone marrow samples from 3 saline- and 3 DT-treated mice, with two sections per sample, i.e. 6 sections per condition, were analyzed by TEM; total numbers of 172 and 133 MKs were observed, respectively. MKs were classified according to their morphology, either as classical stage I to IV, or as pycnotic cells. Left, the density of MKs per unit area (14,400 μm2) was determined on sections from untreated and treated mice; the histograms represent the mean distribution and standard deviation on the sections analyzed. Right, the percentages of the different types of MKs, including pycnotic cells, were calculated on sections from saline- and DT-treated mice. (C) Upper panels, representative images of a stage III MK from untreated mice, left whole cell, right enlarge field showing the presence of α and δ granules and mitochondria (m). Lower panels depict a typical MK from DT-treated mice with a pycnotic nucleus (left panel) and swollen mitochondria (sm)(lower right panel). (D) Representative TEM images of bone marrow sections from DT-treated mice on day 8. Note the accumulation of MKs (1), the presence of whole MKs and large fragments of MKs (2) and the presence of proPLTs (arrows), PLTs (arrow heads) (3) and retPLTs (4) in a bone marrow vessel.
Fig 2
Fig 2. Inversion of the TObright and TOdim PLT populations.
F1 iDTR x PF4-Cre mice were treated as described in Fig 1. On day 8, PLTs were stained with TO and an A647-conjugated anti-GP1bβ mAb and analyzed by FC. (A) Two regions, corresponding to TObright (++) and TOdim (+) PLTs, could be distinguished. (B) PLTs were labeled with TO and analyzed by FC to deduce the proportion of TObright cells (left). The mean PLT volume was determined using a hematology analyzer (right). T-tests indicated a p value of <0.0001 when comparing day 7 and day 8 parameters. (C) In a separate experiment, blood samples were drawn on day 8 (0, 2, 5, 8 and 11 h) and day 9 (24 h). Total PLT counts were obtained using a cell counter and the percentage of TObright PLTs was determined by FC analysis using gates as defined in S3A Fig. The TObright and TOdim PLT counts were subsequently deduced (n = 5).
Fig 3
Fig 3. Life span of retPLTs in vitro and in vivo.
(A) On day 8, washed PLTs were prepared and incubated for the indicated times at 22°C or 37°C in Tyrode’s albumin/DMEM medium. At each time point, PLT counts were recorded (left panel) and cell samples were stained with TO and analyzed by FC to determine the percentage of TObright PLTs (retPLTs) (right panel) (saline- and DT-treated animals, white and grey bars, respectively) (n = 3). (B) On day 8, pooled washed PLTs were prepared from 3 saline- or DT-treated F1 iDTR x PF4-Cre mice and injected into 3 mice expressing EGFP in all cell types. Blood samples obtained 15 min, 1 h 15, 6 h 15 and 24 to 96 h after PLT transfusion (respectively time points 0 h, 1 h, 3 h, etc.) were stained with Alexa647-conjugated RAM1 and analyzed by FC. As also depicted in (C), the RAM1+/SSCdim gate (G1) corresponding to all single PLT events was defined and then the RAM1+/EGFP- transfused PLTs (G2). The percentage of transfused PLTs at a given time (ratio of the number of events in G2 to that in G1) was normalized to that at time 0 to deduce the percentages of remaining transfused PLTs. (C) On day 8, pools of washed PLTs from saline (-DT) or DT- (+DT) treated mice were transfused in Tomato-expressing mice and their fate was followed for 48h. Blood samples obtained 15 min, 1 h 15, 3 h 15, 6 h 15, 9 h 15, 24, and 48h after PLT transfusion were stained with TO and Alexa647-conjugated RAM1 and analyzed by FC. The first row depicts the gating strategy used to analyze the fate of transfused non-fluorescent PLTs: RAM1+/SSCdim gate (G1) corresponding to all single PLT events was defined and then the RAM1+/Tm- transfused PLTs (G2) and the Ram1+/ TOdim (G3) and TObright (G4) transfused PLTs were successively selected. Lower dot plots represent the distribution of remaining transfused PLTs at different times. The G3 and G4 gates were defined, based on the profile of control PLTs from saline-treated mice at time 0 (lower right dot plot). (D) Upper panel, the percentage of remaining transfused PLTs at a given time (ratio of the number of events in G2 to that in G1) was normalized to that at time 0. Lower panel, the ratio of the number of events in G4 to that in G2 provided the percentage of remaining TObright cells among transfused PLTs.
Fig 4
Fig 4. Fate of rRNAs.
On day 8, washed PLTs from DT- or saline-treated mice were resuspended in Tyrode’s albumin/DMEM medium and incubated at 37°C for different periods of time. (A) PLTs were incubated for 0, 2, 4, 6 and 24 h. The percentage of TObright PLTs, determined at 0, 6 and 24 h, was 82, 33 and 2%, respectively. At each time points, PLT samples were fixed and permeabilized, stained with the anti-rRNA mAb Y10b and A647-conjugated anti-mouse IgGs, counterstained with an A488-conjugated anti-GP1bβ mAb and analyzed by confocal microscopy. PLT outlines, determined by Photoshop analysis of anti-GP1bβ staining, are depicted. Representative micrographs of analyzed cells from DT-treated animals (+DT) at times 0, 4 and 24 h and from saline-treated animals (-DT) at time 0 are shown. (B) The mean fluorescence intensity per unit area in each PLT stained with Y10b (+) or an isotype-matched control antibody (C) (y-axis, log2 scale) was calculated as described in the methods; 500 to 550 PLTs from DT-treated mice (+) or saline-treated mice (-) were analyzed for each condition. A one way ANOVA analysis followed by a Bonferroni post-hoc test comparing each pair of conditions gave p values of <0.001 (continuous bars) or <0.01 (dashed bars). Other combinations of Y10b stained samples were not statistically different.
Fig 5
Fig 5. Decay of the quality of PLT RNA.
In another series of experiments, washed PLTs from DT-treated mice were resuspended in Tyrode’s albumin/DMEM medium and incubated at 37°C for 0, 2, 4, 6 and 24h. At the end of each time interval the percentage of TObright PLTs was determined by FC, after which PLT RNA was extracted in Trizol reagent containing MS2 genomic RNA (see methods) (n = 4). (A) The profiles of extracted RNAs were analyzed on a Bioanalyzer; a representative series of profiles is shown. Y-axis scales (fluorescence units) are identical for all the electropherograms (20 FU per subdivision). The asterisks indicate the position of MS2 RNA and the right electropherogram corresponds to pure MS2 RNA. First number, time; second number, percentage of TObright PLTs; third number, 28S/18S RNA ratio; fourth number, percentage of remaining PLT RNA. (B) The decays of rRNA and beta actin mRNA were analyzed by RT-qPCR (see details in method section). Representative amplification curves for MS2, 28S rRNA and beta actin cDNAs at time 0 are shown (1/50 diluted samples, triplicates). No specific amplification products were generated in control experiments without reverse transcriptase (not shown). The relative normalized expression of 28S rRNA and of beta actin mRNA relatively to time 0 were calculated as described in the method section. Histograms represent means and SEM from the 4 independent experiments. C) The presence of beta actin and ubiquitin C transcripts in freshly isolated control and reticulated PLTs was assessed using RNAscope technique. The stringency of the conditions was checked using B subtilis-specific DapB mRNA probes. Hybridized probes were revealed using alkaline phosphatase and HD-assay RED reagent. PLTs were then counterstained with A488-conjugated anti-GP1bβ mAb and DAPI. Upper panels, retPLTs (left, DT) and control PLTs (right, WT) labelled with actin mRNA-specific probes. The masking effect of RED reagent-derived large precipitates on anti-GP1bβ staining is illustrated by arrows. Lower left panel, retPLTs labelled with negative control DapB probes. Lower right panel, retPLTs were stained with Ubiquitin C-specific probes. DAPI staining is not shown because no cells were labelled in the chosen views. Scale bar: 10 μm.
Fig 6
Fig 6. Decay of translation in PLTs.
Washed PLTs were prepared from saline- (-DT) or DT-treated mice (+DT), incubated for 0, 6 and 24h at 37°C and metabolically labeled with 35S methionine and cysteine for 30 min as described in the method sections. PLT lysates (25μg/lane) were analyzed by SDS-PAGE under reducing conditions, Coomassie blue-stained (left panels), or autoradiographed for 4 days (right panels).
Fig 7
Fig 7. Fate of human PLT RNAs in transfusion bags.
Transfusion bags were incubated and sampled at 22°C or 37°C for 0, 6, 20 or 48 h. PLT activation was checked by FC after staining with FITC-conjugated annexin V or anti-P-selectin mAb. Total RNA was extracted and analyzed on a Bioanalyzer 2100 and electropherograms of the extracted RNA are shown. The 28S/18S RNA ratios are indicated between the rRNA peaks and the percentages of small RNAs are shown above the small RNA peaks. AnnV and P-Sel, percentage of annexin V- and P-selectin-positive PLTs (ND, not determined).

References

    1. Jackson SP, Nesbitt WS, Westein E (2009) Dynamics of platelet thrombus formation. J Thromb Haemost 7 Suppl 1: 17–20. 10.1111/j.1538-7836.2009.03401.x - DOI - PubMed
    1. Herter JM, Rossaint J, Zarbock A (2014) Platelets in inflammation and immunity. J Thromb Haemost 12: 1764–1775. 10.1111/jth.12730 - DOI - PubMed
    1. Rowley JW, Schwertz H, Weyrich AS (2012) Platelet mRNA: the meaning behind the message. Curr Opin Hematol 19: 385–391. 10.1097/MOH.0b013e328357010e - DOI - PMC - PubMed
    1. Weyrich AS, Schwertz H, Kraiss LW, Zimmerman GA (2009) Protein synthesis by platelets: historical and new perspectives. J Thromb Haemost 7: 241–246. 10.1111/j.1538-7836.2008.03211.x - DOI - PMC - PubMed
    1. Pillitteri D, Bassus S, Boller K, Mahnel R, Scholz T, Westrup D, et al. (2007) Thrombin-induced interleukin 1beta synthesis in platelet suspensions: impact of contaminating leukocytes. Platelets 18: 119–127. - PubMed

Publication types