. 2016 Jan 25;11(1):e0145096.
doi: 10.1371/journal.pone.0145096. eCollection 2016.

Learning to Produce Syllabic Speech Sounds via Reward-Modulated Neural Plasticity

Affiliations

Learning to Produce Syllabic Speech Sounds via Reward-Modulated Neural Plasticity

Anne S Warlaumont et al. PLoS One. .

Abstract

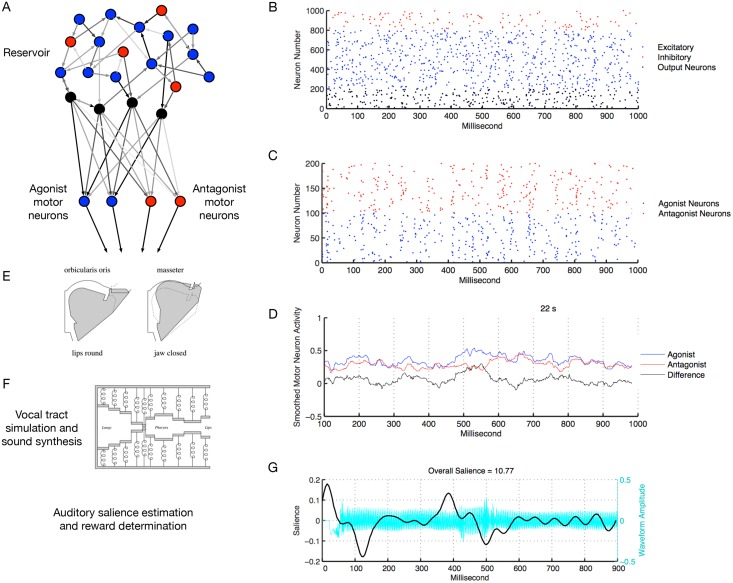
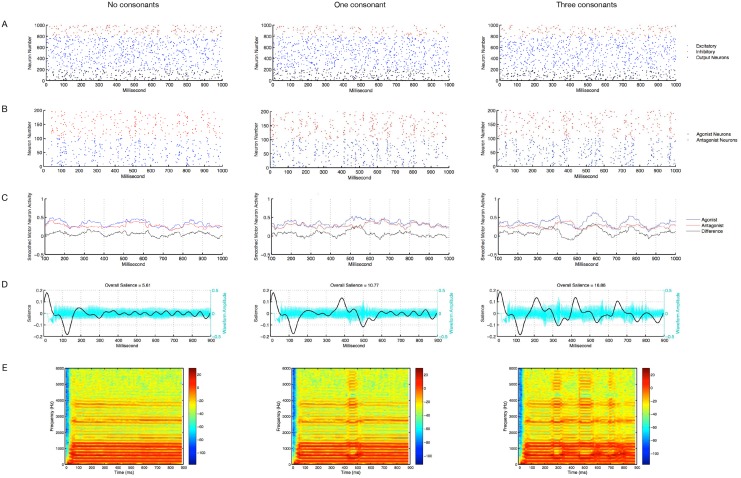
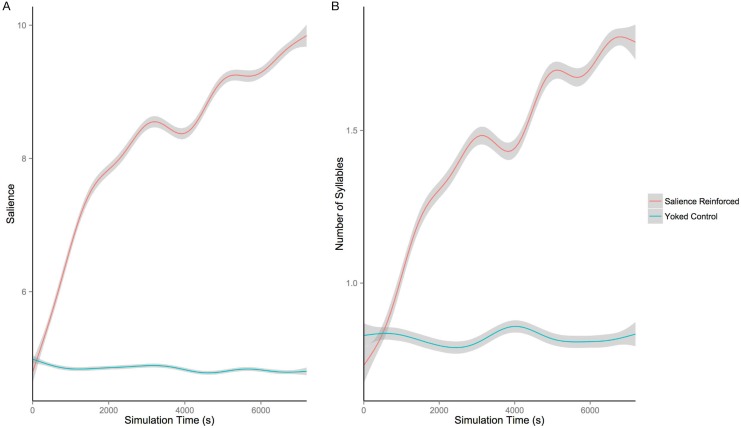
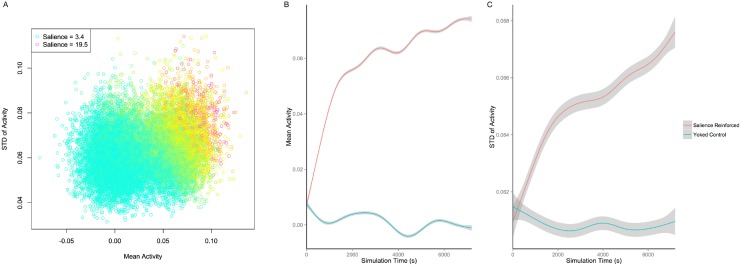
At around 7 months of age, human infants begin to reliably produce well-formed syllables containing both consonants and vowels, a behavior called canonical babbling. Over subsequent months, the frequency of canonical babbling continues to increase. How the infant's nervous system supports the acquisition of this ability is unknown. Here we present a computational model that combines a spiking neural network, reinforcement-modulated spike-timing-dependent plasticity, and a human-like vocal tract to simulate the acquisition of canonical babbling. Like human infants, the model's frequency of canonical babbling gradually increases. The model is rewarded when it produces a sound that is more auditorily salient than sounds it has previously produced. This is consistent with data from human infants indicating that contingent adult responses shape infant behavior and with data from deaf and tracheostomized infants indicating that hearing, including hearing one's own vocalizations, is critical for canonical babbling development. Reward receipt increases the level of dopamine in the neural network. The neural network contains a reservoir with recurrent connections and two motor neuron groups, one agonist and one antagonist, which control the masseter and orbicularis oris muscles, promoting or inhibiting mouth closure. The model learns to increase the number of salient, syllabic sounds it produces by adjusting the base level of muscle activation and increasing their range of activity. Our results support the possibility that through dopamine-modulated spike-timing-dependent plasticity, the motor cortex learns to harness its natural oscillations in activity in order to produce syllabic sounds. It thus suggests that learning to produce rhythmic mouth movements for speech production may be supported by general cortical learning mechanisms. The model makes several testable predictions and has implications for our understanding not only of how syllabic vocalizations develop in infancy but also for our understanding of how they may have evolved.


Conflict of interest statement

Competing Interests: The authors have declared that no competing interests exist.

Figures

Fig 1
Fig 1. Overview of the model.
A: Schematic depiction of the groups of neurons in the spiking neural network and how they are connected. There is a reservoir of 1000 recurrently connected neurons, with 200 of those being inhibitory (red) and the rest excitatory (blue and black). 200 of the reservoir’s excitatory neurons are designated as output neurons (black). These output neurons connect to two groups of motor neurons, agonist motor neurons (blue) and antagonist motor neurons (red). The connection weights within the reservoir are set at the start of the simulation to random values and do not change over the course of the simulation. The connection weights from the reservoir output neurons to the motor neurons are initially set to random values and are modified throughout the simulation by dopamine (DA)-modulated STDP. All reservoir and motor neurons receive random input current at each time step (not shown). B: Raster plot of spikes in the reservoir over a 1 s time period. C: Raster plot of spikes in the motor neuron groups over the same 1 s time period. The agonist and antagonist motor neuron spikes are summed at each time step then are smoothed using a 100 ms moving average. The smoothed antagonist activity is subtracted from the smoothed agonist activity, creating a net smoothed muscle activity that is sent to the orbicularis and masseter muscles. D: The smoothed agonist, antagonist, and net activity for the same 1 s as in the raster plots. E: Effects of the orbicularis oris and masseter on the vocal tract’s shape (reprinted with permission from [61]). Orbicularis oris activity tends to round and close the lips and masseter activity tends to raise the jaw. F: Schematic illustration that the vocal tract is modeled as an air-filled tube bounded by walls made up of coupled mass-spring systems (reprinted with permission from [61]). The orbicularis oris and masseter affect the equilibrium positions at the front parts of the tube. The air pressure over time and space in the tube is calculated, and the air pressure at the lip end of the tube forms the sound waveform. The vocal tract shape is modeled more realistically than depicted here and also contains a nasal cavity that is not depicted. G: The sound synthesized by the vocal tract model is input to an algorithm that estimates auditory salience. The plot shows, for the same 1 s as in B–D, the synthesized vocalization waveform (in cyan) and the salience of that waveform over time (in black). Apart from a peak in salience at the sound’s onset, the most salient portion of the sound is around the place where the sound’s one consonant can be heard. The overall salience of this particular sound is 10.77. If the salience of the sound is above the model’s current threshold, a reward is given, which causes an increase in dopamine concentration in the neural network.
Fig 2
Fig 2. Vocalization examples.
Three examples of vocalizations produced by the model. The left column shows a vocalization that contains no consonants and would not be considered canonical or syllabic babbling. The associated WAV file is available for listening in S1 Sound. The middle column shows a vocalization that contains one consonant and the right column shows a vocalization that contains three consonants. The middle and right vocalizations would qualify as canonical babbling (the associated WAV files are available for listening in S2 Sound and S3 Sound, respectively). The vocalizations were all produced by fully trained versions of the primary version of the model. A: Raster plots of the 1 s of reservoir neuron activity associated with the vocalization. B: motor neuron raster plots. C: Smoothed motor neuron activity for the agonist and antagonist groups as well as the difference between the smoothed agonist and antagonist activities. This difference was what was input as muscle activity to the vocalizations synthesizer. D: Waveforms (cyan), salience traces (black) and overall salience estimates (titles) for each example vocalization. Note that positive values of the salience trace represent detection of onsets of patterns in the auditory stimulus and negative values represent offsets of patterns. E: Spectrograms of the vocalizations; these provide visual evidence of the vocalization’s harmonic frequencies and of formant transitions associated with the production of consonants.
Fig 3
Fig 3. Increase in salience and syllabicity over time.
A: Average auditory salience of the sounds produced by the model as a function of simulation time in seconds and whether the simulation was reinforced based on auditory salience or was a yoked control. B: Number of vowel nuclei, i.e. number of syllables, estimated to be contained within the sounds produced by the model as a function of simulation time in seconds and whether the simulation was reinforced based on auditory salience or was a yoked control. Lines are generalized additive model fits and dark gray shading gives 95% confidence intervals around those fits. When reinforced for auditory salience, the model increases both the salience of its vocalizations and the number of syllables contained within those vocalizations, while the yoked controls do not show such increases.
Fig 4
Fig 4. The relationship of muscle activity mean and standard deviation to salience and learning.
A: Each point represents one vocalization produced by five simulations of the salience-reinforced model. Data are sampled so that every fifth vocalization produced by the model is plotted here. Note that the most salient sounds tend to have both high median activity levels and high standard deviation of muscle activity, as our statistical analyses indicate. The legend shows the colors of the maximum and minimum salience points portrayed in the plot; red indicates high salience, yellow indicates moderate salience, and cyan indicates low salience. B: The mean level of muscle activity produced by the model as a function of simulation time in seconds and whether the simulation was reinforced based on auditory salience or was a yoked control. Lines are generalized additive model fits and dark gray shading gives 95% confidence intervals around those fits. When reinforced for auditory salience, the model increases the baseline level of activity of the masseter and orbicularis oris muscles, leading to greater mouth closure on average after learning. The yoked controls do not show such an increase. C: The average, across vocalizations, of the standard deviation of muscle activity within each vocalization, as a function of simulation time in seconds and whether the simulation was reinforced based on auditory salience or was a yoked control. The salience-reinforced model increases its within-vocalization change in activity of the masseter and orbicularis oris muscles, leading to greater jaw and lip movement on average after learning.
Fig 5
Fig 5. Synaptic weights after learning.
A: Example of the synapse strengths from each reservoir output neuron to each motor neuron after learning. The left plot shows the synapses for the first simulation of the 200 motor neuron m = 2 model reinforced for high-salience vocalizations. The right plot shows the synapses for the corresponding yoked control simulation. Yellow indicates greater connection strengths; blue indicates weaker synapses. The stronger synapses on the left half of the left plot as compared to the right half of that same plot reflect the greater connection of reservoir neurons to agonist motor neurons promoting mouth closure than to antagonist motor neurons promoting mouth opening. Note that this bias is not present in the connection weights of the yoked control simulation shown on the right. B: Across all simulations of the 200 motor neuron m = 2 model, the total strength of the connections from the reservoir to the agonist motor neurons divided by the total strength of the connections from the reservoir to the antagonist motor neurons. Bar height indicates the mean across the five simulations and the error bars represent 95% confidence intervals. C: Across all simulations of the 200 motor neuron m = 2 model, the standard deviation of the connection strengths from the reservoir to the motor neurons. Bar height indicates the mean standard deviation across the five simulations.

Similar articles

Cited by

References

    1. Oller DK. The emergence of the sounds of speech in infancy In: Yeni-Komshian GH, Kavanagh JF, Ferguson CA, editors. Child phonology, vol. 1: Production. New York: Academic Press; 1980. p. 93–112.
    1. Stark RE. Stages of speech development in the first year of life In: Yeni-Komshian GH, Kavanagh JF, Ferguson CA, editors. Child phonology, vol. 1: Production. New York: Academic Press; 1980. p. 73–92.
    1. Koomans-van Beinum FJ, van der Stelt JM. Early stages in the development of speech movements In: Lindblom B, Zetterström R, editors. Precursors of early speech. New York: Stockton Press; 1986. p. 37–50.
    1. Oller DK, Eilers RE, Urbano R, Cobo-Lewis AB. Development of precursors to speech in infants exposed to two languages. J Child Lang. 1997;24(2):407–425. 10.1017/S0305000997003097 - DOI - PubMed
    1. McCune L, Vihman MM. Early phonetic and lexical development: A productivity approach. J Speech Lang Hear Res. 2001;44(3):670–84. 10.1044/1092-4388(2001/054) - DOI - PubMed

Publication types

LinkOut - more resources