. 2016 Mar 1;126(3):837-53.
doi: 10.1172/JCI82788. Epub 2016 Jan 25.

PKCδ inhibition normalizes the wound-healing capacity of diabetic human fibroblasts

PKCδ inhibition normalizes the wound-healing capacity of diabetic human fibroblasts

Mogher Khamaisi et al. J Clin Invest. .

Abstract

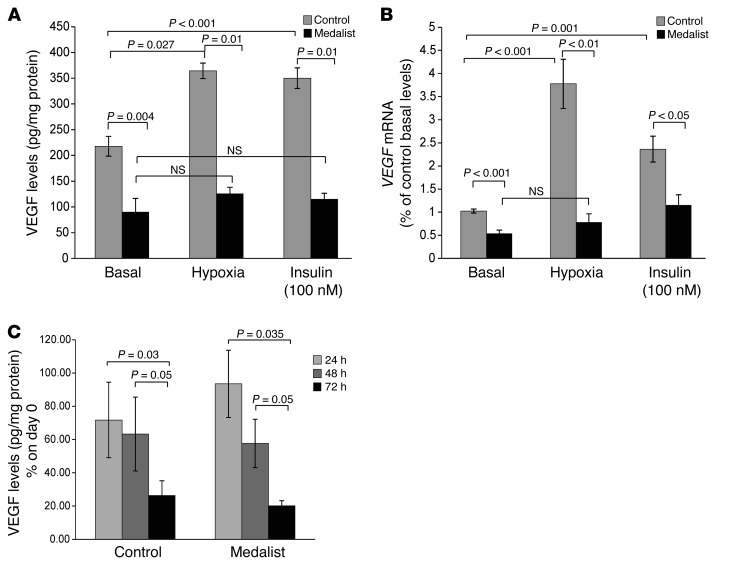
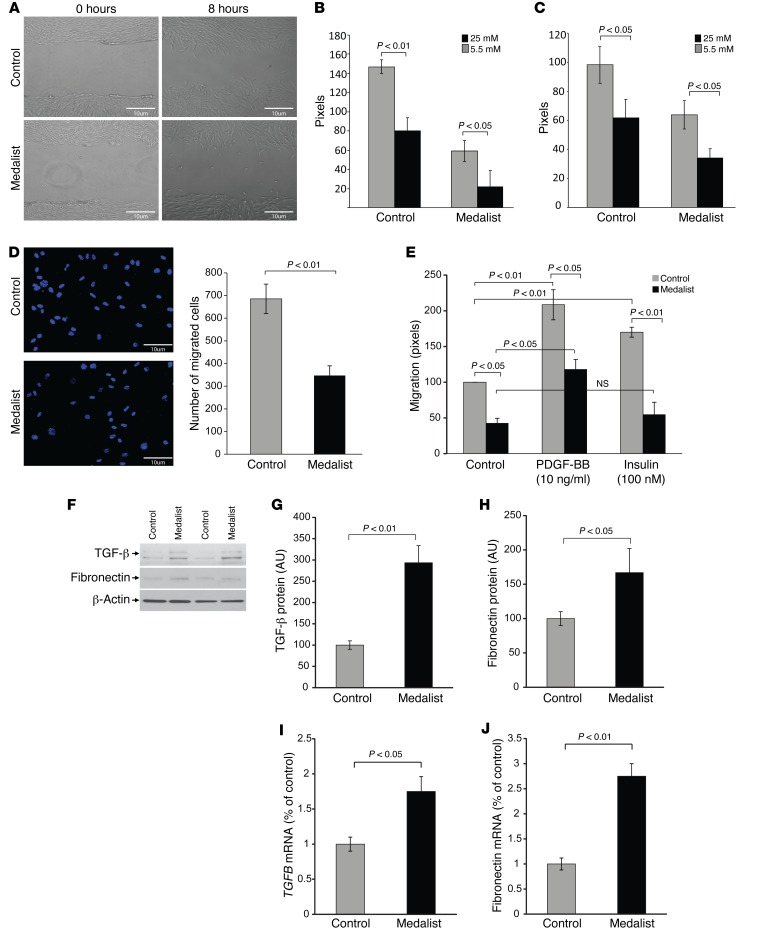
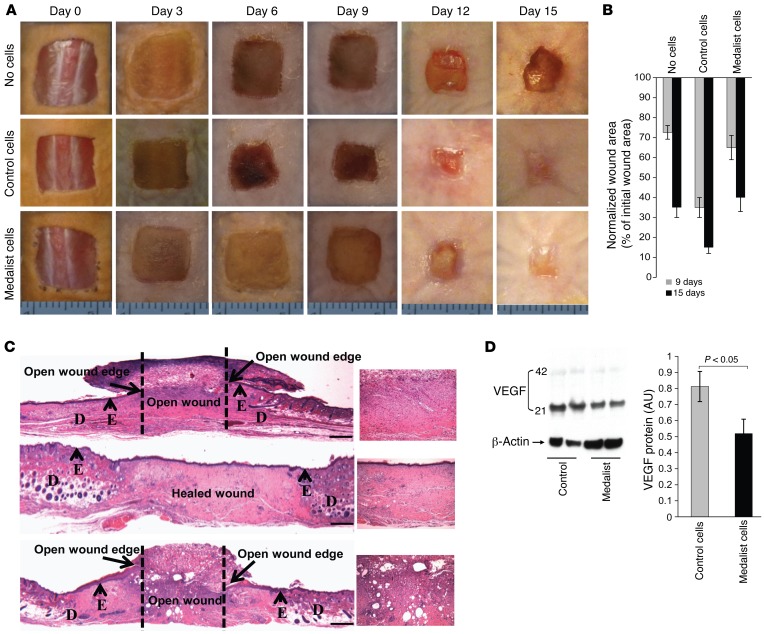
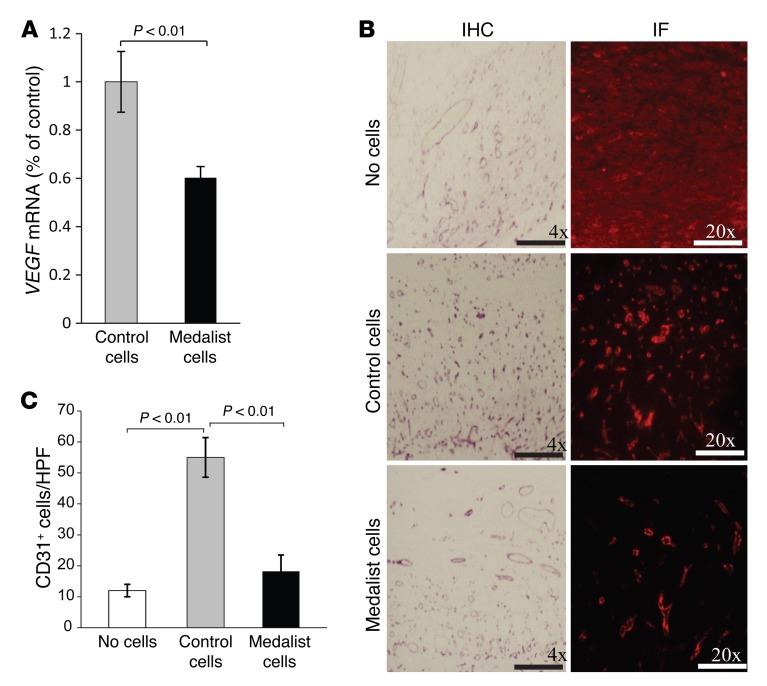
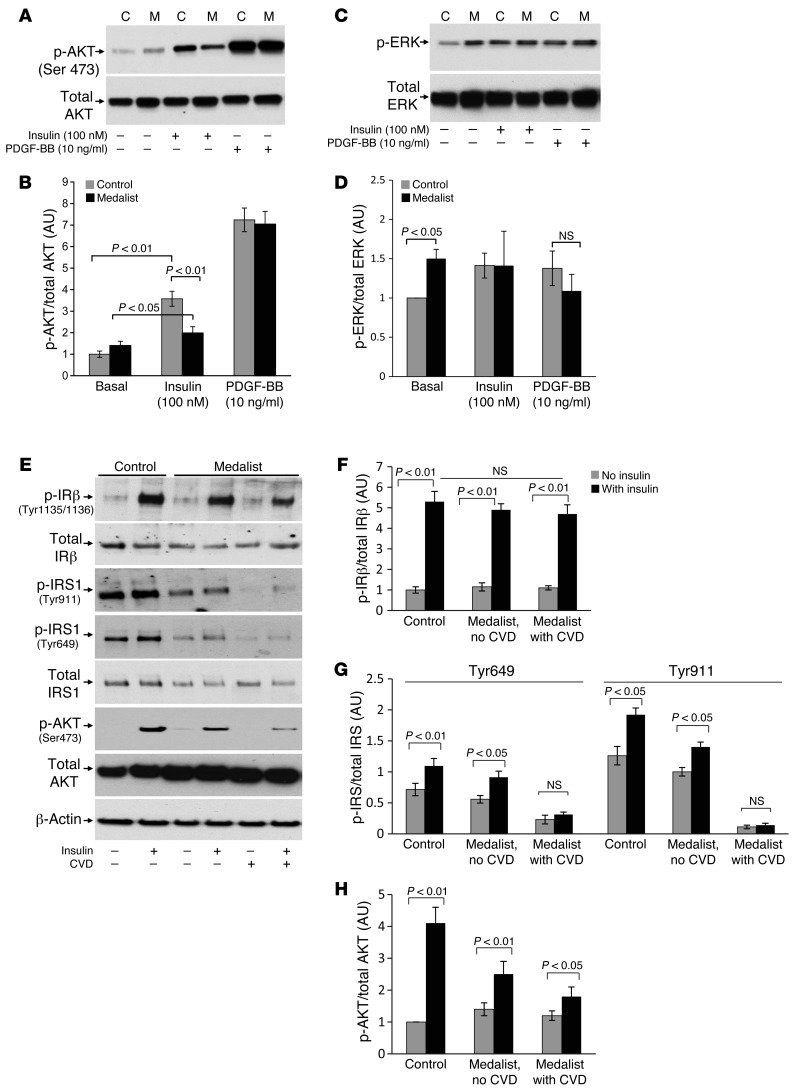
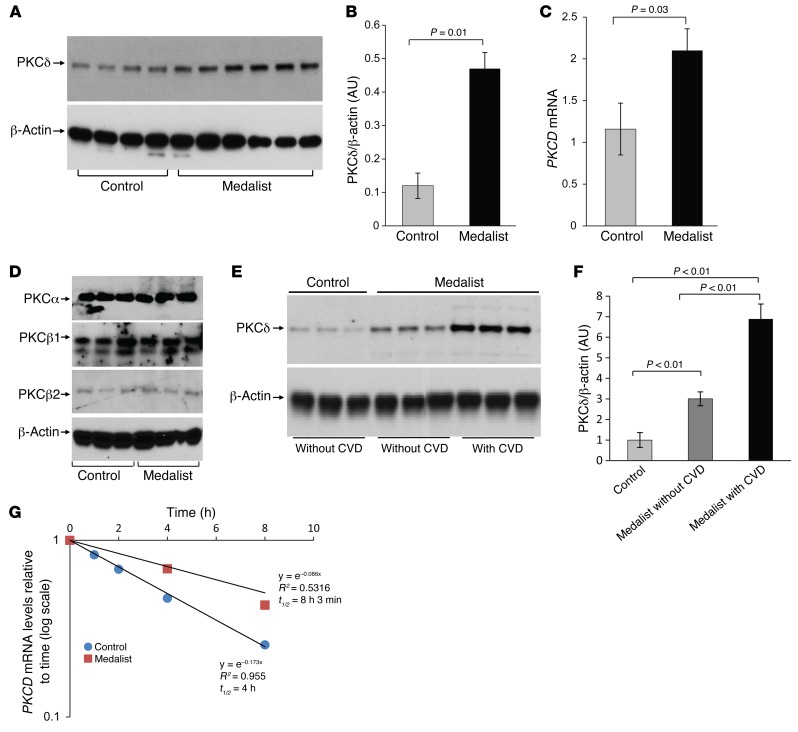
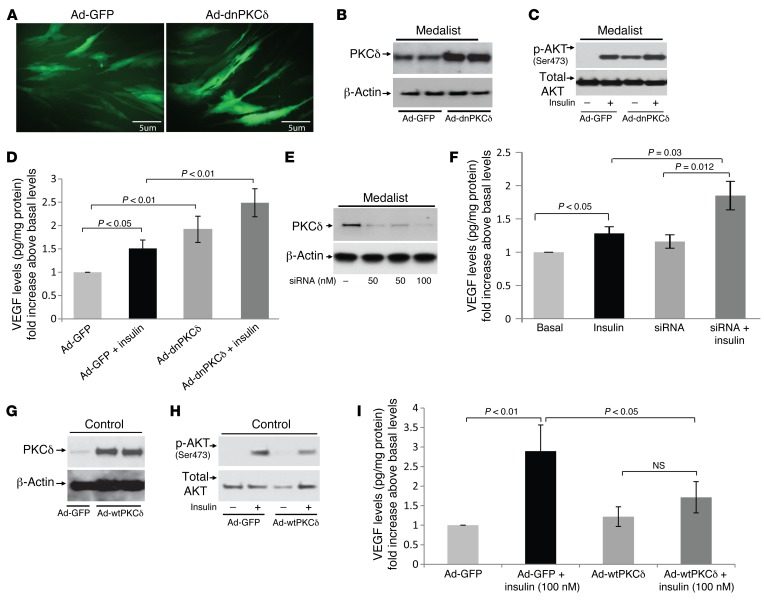
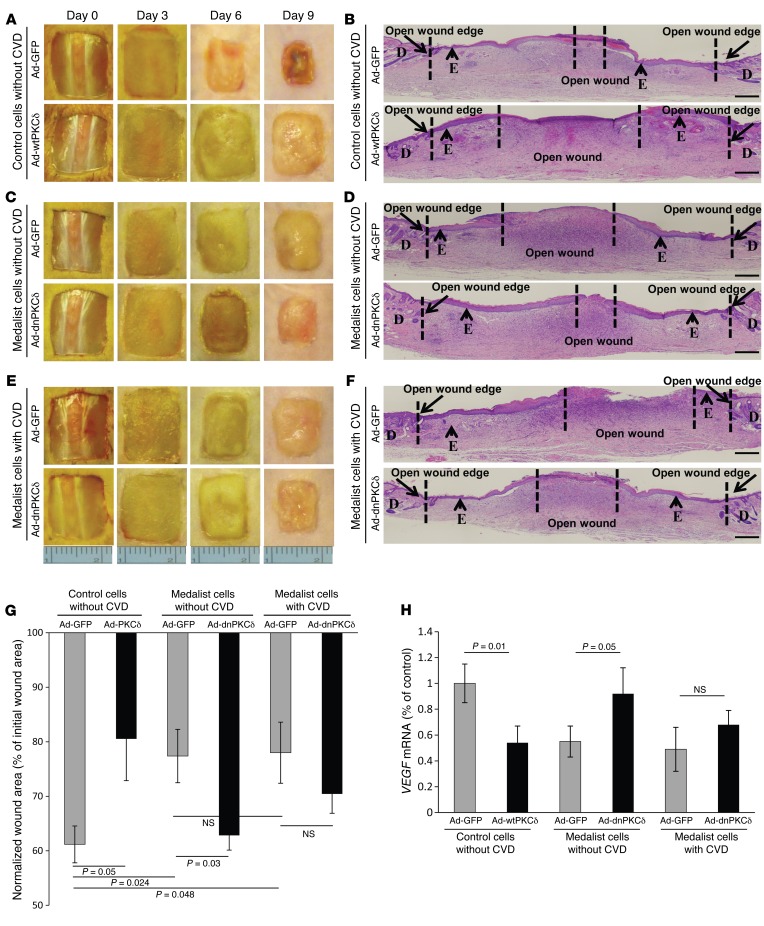
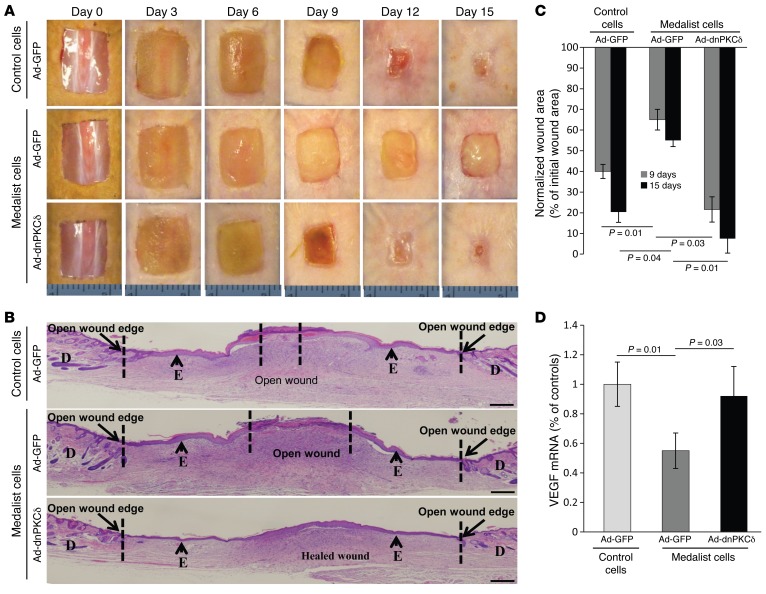
Abnormal fibroblast function underlies poor wound healing in patients with diabetes; however, the mechanisms that impair wound healing are poorly defined. Here, we evaluated fibroblasts from individuals who had type 1 diabetes (T1D) for 50 years or more (Medalists, n = 26) and from age-matched controls (n = 7). Compared with those from controls, Medalist fibroblasts demonstrated a reduced migration response to insulin, lower VEGF expression, and less phosphorylated AKT (p-AKT), but not p-ERK, activation. Medalist fibroblasts were also functionally less effective at wound closure in nude mice. Activation of the δ isoform of protein kinase C (PKCδ) was increased in postmortem fibroblasts from Medalists, fibroblasts from living T1D subjects, biopsies of active wounds of living T1D subjects, and granulation tissues from mice with streptozotocin-induced diabetes. Diabetes-induced PKCD mRNA expression was related to a 2-fold increase in the mRNA half-life. Pharmacologic inhibition and siRNA-mediated knockdown of PKCδ or expression of a dominant-negative isoform restored insulin signaling of p-AKT and VEGF expression in vitro and improved wound healing in vivo. Additionally, increasing PKCδ expression in control fibroblasts produced the same abnormalities as those seen in Medalist fibroblasts. Our results indicate that persistent PKCδ elevation in fibroblasts from diabetic patients inhibits insulin signaling and function to impair wound healing and suggest PKCδ inhibition as a potential therapy to improve wound healing in diabetic patients.


Figures

Figure 1
Figure 1. Effect of glucose, insulin, and hypoxia on VEGF expression.
Basal VEGF protein (A) and mRNA (B) levels (cells were incubated with DMEM medium only) after incubation with 100 nM insulin and after incubation for 16 hours under 5% O2 hypoxic conditions. VEGF protein levels secreted into the medium were measured using an ELISA kit, which determined mainly VEGF165. qPCR using the human VEGF primers detailed in Supplemental Figure 9 was performed to determine VEGF mRNA expression levels. Data represent the mean ± SD for 7 control subjects and 26 Medalists, each in triplicate. (C) VEGF protein expression after incubation of control and Medalist fibroblasts in 5.6 mM or 25 mM glucose for 24, 48, and 72 hours. Osmolality in 5.6 nM conditions was corrected using mannitol. A Student’s t test or χ2 test was used for 2-way comparisons based on the distribution and number of observations of the variable.
Figure 2
Figure 2. Effect of high glucose levels on fibroblast migration and ECM protein secretion.
(A) Representative image of the scratch wound migration assay. (B and C) Quantification of migrated cells after incubation with 25 mM glucose for 8 hours and 3 days, respectively. Osmolality in 5.6 nM conditions was corrected using mannitol. The images acquired for each sample were analyzed quantitatively using Image-Pro Plus software (Media Cybernetics). (D) Fibroblast migration determined in a Matrigel invasion chamber. (E) Scratch wound migration assay on control and Medalist fibroblasts stimulated with 10 ng/ml PDGF-BB or 100 nM insulin for 12 hours. Data represent the mean ± SD for 7 controls and 26 Medalists, each in triplicate. Representative immunoblots (F) and quantification of TGF-β (G) and fibronectin (H) protein levels in control and Medalist fibroblasts. (I) TGFB and (J) fibronectin mRNA expression levels in Medalist fibroblasts. Basal mRNA expression levels in control fibroblasts was set to 1. A Student’s t or χ2 test was used for 2-way comparisons based on the distribution and number of observations of the variable.
Figure 3
Figure 3. Medalist fibroblasts display impaired wound healing in vivo.
(A) Macroscopic images of wound area surface not covered by an epithelial layer in wounds covered with Integra without human cells, Integra with control cells, or Integra with Medalist fibroblasts. (B) Percentage of open wound areas on days 9 and 15 of the initial wound area. (C) H&E-stained sections of open wound area and granulation tissues on day 15 after initial wounding. D, dermis; E, epidermis. Scale bar: 50 μm. (D) Representative immunoblots of VEGF protein levels and quantification (right panel) in the granulation tissues on day 15 after wounding. Data represent the mean ± SD. n = 12 for wounds treated with Integra without cells; n = 7 for wounds treated with control fibroblasts; and n = 12 for wounds treated with Medalist fibroblasts. The criteria for selecting the cell lines for these experiments were completely random, and the clinical and demographic characteristics of the selected subjects did not differ from those of the rest of the patients. A Student’s t or χ2 test was used for 2-way comparisons based on the distribution and number of observations of the variable.
Figure 4
Figure 4. Medalist fibroblasts display impaired wound healing in vivo.
VEGF mRNA levels (A) in granulation tissues on day 15 after wounding. The extent of neovascularization in granulation tissues on day 15 after wounding was assessed by CD31+ cells using IHC or IF (B) and quantification (C). Data represent the mean ± SD. n = 12 for wounds treated with Integra without cells; n = 7 for wounds treated with control fibroblasts; and n = 12 for wounds treated with Medalist fibroblasts. The criteria for selecting the cell lines for these experiments were completely random, and the clinical and demographic characteristics of the selected subjects did not differ from those of the rest of the patients. A Student’s t or χ2 test was used for 2-way comparisons based on the distribution and number of observations of the variable. Scale bars: 50 μm. HPF, high-powered field.
Figure 5
Figure 5. Insulin signaling in control and Medalist fibroblasts.
Representative immunoblot of p-AKT on Ser473 (A), p-AKT quantification (B), p-ERK immunoblot (C), and p-ERK quantification (D) in control (C) or Medalist (M) fibroblasts in a basal state, after stimulation with 100 nM insulin, or after stimulation with 10 ng/ml BDGF-BB for 10 minutes. (E) Phosphorylation of IRβ (Tyr1135 and Tyr1136) (upper), IRS1 (Tyr911 and Tyr649) (middle), and AKT (Ser473) (lower) in the basal state and after stimulation with 100 nM insulin for 10 minutes in fibroblasts derived from controls or Medalists with or without CVD. Immunoblot quantification for IRβ (F), IRS1 (G), and AKT (H). Data represent the mean ± SD. n = 7 for the control fibroblasts group; n = 18 for the Medalist fibroblasts group with CVD; and n = 8 for the Medalist fibroblasts group without CVD. The criteria for selecting the cell lines for these experiments were completely random, and the clinical and demographic characteristics of the selected subjects did not differ from those of the rest of the patients. A Student’s t or χ2 test was used for 2-way comparisons based on the distribution and number of observations of the variable.
Figure 6
Figure 6. Increased PKCδ expression and PKCD mRNA half-life in Medalist fibroblasts.
Representative immunoblot for PKCδ (A), PKCδ protein quantification (B), and PKCD mRNA (C) in control and Medalist fibroblasts. Data represent the mean ± SD. n = 7 for the control fibroblasts group; n = 26 for the Medalist fibroblasts group. (D) PKCα, PKCβ1, and PKCβ2 protein expression in control (n = 5) and Medalist (n = 10) fibroblasts. Representative immunoblot (E) and quantification (F) of PKCδ protein expression in control fibroblasts (n = 7), fibroblasts from Medalists without CVD (n = 8), and fibroblasts from Medalists with CVD (n = 18). (G) The half-life of PKCD mRNA was determined by incubation of fibroblasts from controls (n = 7) and Medalists (n = 10) with 5 μg/ml actinomycin-D for 0 to 8 hours, followed by qPCR analysis. A Student’s t or χ2 test was used for 2-way comparisons based on the distribution and number of observations of the variable.
Figure 7
Figure 7. Knockdown of PKCδ improves insulin-induced VEGF secretion.
(A) Fluorescence micrographic images of adenoviral vector containing GFP (Ad-GFP) and dominant-negative PKCδ–infected (Ad-dnPKCδ) Medalist fibroblasts. Representative immunoblot of PKCδ (B), p-AKT after stimulation with insulin for 10 minutes (C), and VEGF protein levels after stimulation with 100 nM insulin for 16 hours (D) in Medalist fibroblasts infected with Ad-GFP or Ad-dnPKCδ. Representative immunoblot of PKCδ (E) and VEGF protein levels (F) in Medalist fibroblasts transfected with siRNA and stimulated with 100 nM insulin for 16 hours. Representative immunoblot of PKCδ (G), p-AKT after stimulation with 100 nM insulin for 10 minutes (H), and VEGF protein levels (I) after stimulation with 100 nM insulin for 16 hours in control fibroblasts infected with Ad-GFP or Ad-wtPKCδ. Data represent the mean ± SD. n = 10 in Medalist experiments and n = 7 in the control experiments. The criteria for selecting the cell lines for these experiments were completely random, and the clinical and demographic characteristics of the selected subjects did not differ from those of the rest of the patients. A Student’s t or χ2 test was used for 2-way comparisons based on the distribution and number of observations of the variable.
Figure 8
Figure 8. Knockdown of PKCδ in Medalist fibroblasts improves wound healing, while increasing PKCδ expression in control fibroblasts delays wound healing after transplantation into a nondiabetic host.
Macroscopic images of wound area surfaces not covered by an epithelial layer (A) and H&E-stained sections of open wound area and granulation tissues (B) on day 9 after initial wounding in control cells infected with Ad-GFP or Ad-wtPKCδ. Macroscopic wound area surfaces not covered by an epithelial layer (C) and H&E-stained sections of open wound area and granulation tissues (D) on day 9 after initial wounding in fibroblasts derived from Medalists without CVD and infected with Ad-GFP or Ad-dnPKCδ. Macroscopic wound area surfaces not covered by an epithelial layer (E) and H&E-stained sections of open wound area and granulation tissues (F) on day 9 after initial wounding in fibroblasts derived from Medalists with CVD and infected with Ad-GFP or Ad-dnPKCδ. Percentage of open wound areas (G) and VEGF mRNA in granulation tissues (H) on day 9 after wounding for the different treatment groups. Data represent the mean ± SD. n = 7 for the control fibroblast group; n = 8 for fibroblasts from Medalists with CVD; and n = 8 for fibroblasts from Medalists without CVD. The criteria for selecting the cell lines for these experiments were completely random, and the clinical and demographic characteristics of the selected subjects did not differ from those of the rest of the patients. A Student’s t or χ2 test was used for 2-way comparisons based on the distribution and number of observations of the variable. Scale bars: 50 μm.
Figure 9
Figure 9. Knockdown of PKCδ in Medalist fibroblasts improves wound healing when transplanted into a diabetic host.
Macroscopic wound area surfaces not covered by an epithelial layer (A) and H&E-stained sections for open wound area and granulation tissues on day 9 after initial wounding (B) in control fibroblasts infected with Ad-GFP or Medalist fibroblasts infected with Ad-GFP or Ad-dnPKCδ. Percentage of the open wound areas (C) and VEGF mRNA in granulation tissues (D) on day 9 after wounding in the different treatment groups. Data represent the mean ± SD. n = 7 for the control fibroblast group; n = 8 for the Medalist group. The criteria for selecting the cell lines for these experiments were completely random, and the clinical and demographic characteristics of the selected subjects did not differ from those of the rest of the patients. A Student’s t or χ2 test was used for 2-way comparisons based on the distribution and number of observations of the variable. Scale bars: 50 μm.

References

    1. Boulton AJ, Vileikyte L, Ragnarson-Tennvall G, Apelqvist J. The global burden of diabetic foot disease. Lancet. 2005;366(9498):1719–1724. doi: 10.1016/S0140-6736(05)67698-2. - DOI - PubMed
    1. Brem H, Tomic-Canic M. Cellular and molecular basis of wound healing in diabetes. J Clin Invest. 2007;117(5):1219–1222. doi: 10.1172/JCI32169. - DOI - PMC - PubMed
    1. Michalik L, Wahli W. Involvement of PPAR nuclear receptors in tissue injury and wound repair. J Clin Invest. 2006;116(3):598–606. doi: 10.1172/JCI27958. - DOI - PMC - PubMed
    1. Werner S, Grose R. Regulation of wound healing by growth factors and cytokines. Physiol Rev. 2003;83(3):835–870. - PubMed
    1. Brandner JM, Zacheja S, Houdek P, Moll I, Lobmann R. Expression of matrix metalloproteinases, cytokines, and connexins in diabetic and nondiabetic human keratinocytes before and after transplantation into an ex vivo wound-healing model. Diabetes Care. 2008;31(1):114–120. doi: 10.2337/dc07-1304. - DOI - PubMed

Publication types

MeSH terms