. 2016 Jan 25;11(1):e0147676.
doi: 10.1371/journal.pone.0147676. eCollection 2016.

Effects of Obstacles on the Dynamics of Kinesins, Including Velocity and Run Length, Predicted by a Model of Two Dimensional Motion

Affiliations

Effects of Obstacles on the Dynamics of Kinesins, Including Velocity and Run Length, Predicted by a Model of Two Dimensional Motion

Woochul Nam et al. PLoS One. .

Abstract

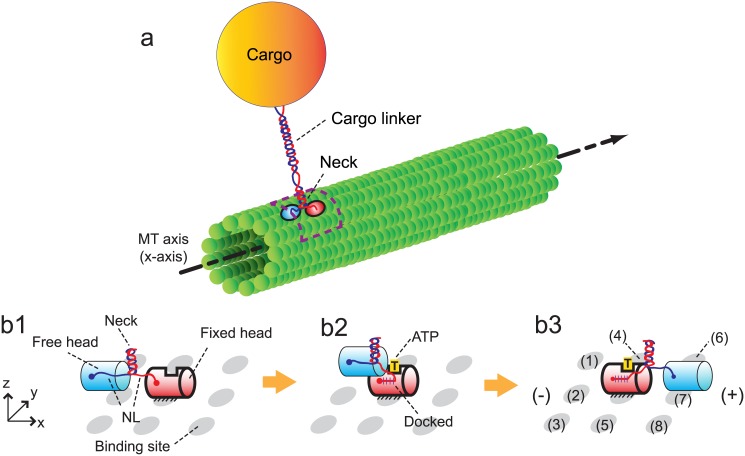
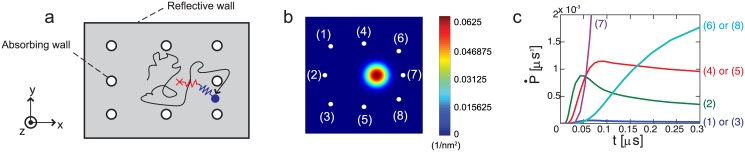
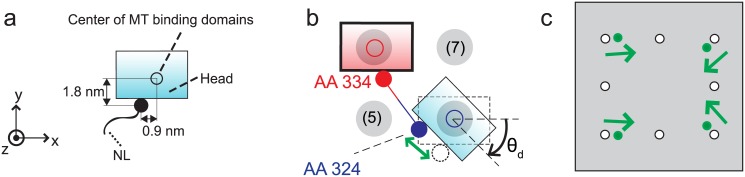
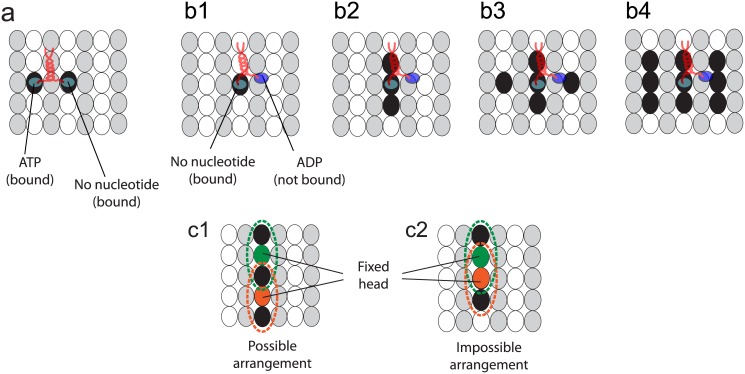
Kinesins are molecular motors which walk along microtubules by moving their heads to different binding sites. The motion of kinesin is realized by a conformational change in the structure of the kinesin molecule and by a diffusion of one of its two heads. In this study, a novel model is developed to account for the 2D diffusion of kinesin heads to several neighboring binding sites (near the surface of microtubules). To determine the direction of the next step of a kinesin molecule, this model considers the extension in the neck linkers of kinesin and the dynamic behavior of the coiled-coil structure of the kinesin neck. Also, the mechanical interference between kinesins and obstacles anchored on the microtubules is characterized. The model predicts that both the kinesin velocity and run length (i.e., the walking distance before detaching from the microtubule) are reduced by static obstacles. The run length is decreased more significantly by static obstacles than the velocity. Moreover, our model is able to predict the motion of kinesin when other (several) motors also move along the same microtubule. Furthermore, it suggests that the effect of mechanical interaction/interference between motors is much weaker than the effect of static obstacles. Our newly developed model can be used to address unanswered questions regarding degraded transport caused by the presence of excessive tau proteins on microtubules.


Conflict of interest statement

Competing Interests: The authors have declared that no competing interests exist.

Figures

Fig 1
Fig 1. Walking motion of a kinesin molecule on the MT.
(a) depicts one kinesin molecule transporting a cargo by walking on the MT. The dotted box indicates the domain where the motion of the kinesin head is realized. (b) shows the components of the kinesin structure and the procedure for its walking motion. The kinesin has one pair of identical heads and NLs. x represents the direction of MT-axis, and y is the tangential direction of the MT. xy-plane represents the outer surface of the MT. The cylinder with bold outlines denotes the fixed head on the MT, and the cylinder with thin outlines is the free head. The neighboring binding sites of the kinesin are shown as gray ellipses. The plus and minus signs denote the polarity of the MT.
Fig 2
Fig 2. Spring model of kinesin NLs.
(a) shows a kinesin molecule and the binding sites around it. Note that the directions of x, y, and z axis are the same with those in Fig 1, and the view direction is along the z axis. NLs are depicted with springs, and gray circles represent the neighboring binding sites. (b) is a schematic cross section through the coiled-coil structure of the neck. The coils are bonded to each other by using the interactions of their AA residues. The neck is connected to two springs corresponding to the docked NL and undocked NL. (c) shows the changes of the force (FUDNL) over the length (UDNL) of undocked NL. (d1) depicts the calculated Fx(x, y), where (x, y) denotes the x and y positions of the free head. (d2) shows the calculated Fy(x, y).
Fig 3
Fig 3. Lattice array of MTs and the distance between adjacent binding sites.
(a) shows the binding sites for MTs of a helical structure. (b) depicts the binding sites in the absence of a mismatch in the lattice array.
Fig 4
Fig 4. Diffusive motion of kinesin head in the absence of obstacles.
The gray area of (a) describes the domain where Eq 2 is solved. (b) is the spatial probability density of the position of the free head after 1 μs after the diffusion has started. (c) shows the rate of the probability density flow out through each absorbing boundary.
Fig 5
Fig 5. Free head when binding to diagonal binding sites.
(a) depicts the positions of AA 324 with a filled circle. The geometric center of the binding domains which interact with binding sites is shown as a hollow circle. (b) depicts the assumption that the free head is likely to bind to the diagonal site with a tilted posture. (c) shows with filled circles the position of the absorbing boundaries of the diagonal sites which correspond to binding with a tilted posture.
Fig 6
Fig 6. Probability of binding at neighboring sites.
The numbers in (a) denote the probability to bind (Pb, i) at each site in the absence of external loads. The probability Pb of backward steps is not indicated because its value is very small. (b) shows the changes in the probabilities of forward (Pfw = Pb, 6 + Pb, 7 + Pb, 8), sideway (Psd = Pb, 4 + Pb, 5), and backward (Pbw = Pb, 1 + Pb, 2 + Pb, 3) steps over the external load.
Fig 7
Fig 7. Binding sites occupied by kinesin heads.
The black ellipses represent the binding sites occupied by the kinesin. The gray and white ellipses are α and β tubulins of the MT. Note that the kinesin head can only bind to β tubulins. (a1) Two sites are occupied by the kinesin when its two heads are strongly bound. (b) depicts possible scenarios when one of the kinesin heads can be unbound and the other head is strongly bound. The kinesin can occupy one (b1), three (b2), five (b3), or nine (b4) binding sites. (c1)-(c2) shows two examples of cases where sites occupied by two kinesin molecules are adjacent, allowing for interference. Both kinesins have one unbound head and one bound head. The dotted circles represent the sites occupied by kinesin heads.
Fig 8
Fig 8. Motion of kinesin in front of a single obstacle.
(a1) shows the probability density over the domain after 1 μs if a single obstacle of mobs = 1 is ahead of the kinesin. The blocked region formed by the obstacle is included into the domain with the reflective boundary. (a2) denotes the probability to bind to each site. The numbers in parentheses represent the position of the sites shown in (a1). (b1) demonstrates different types of obstacles which occupy one, two or three binding sites. The black ellipses represent the binding sites occupied by a single obstacle. (b2) shows the number of kinesin steps (nstep) to proceed 8 nm along the MT axis for various mobs. (c1) illustrates cases where one of the neighboring sites becomes unaccessible due to an obstacle. (c2) denotes the degree of interference for the cases shown in (c1).
Fig 9
Fig 9. The velocity and run length of kinesins over the density of motors.
(a) depicts the motions of the kinesin in (K + MΦ), (K + M+), and (K + M) situations. Motors with an arrow directed to the right are moving kinesins. Motors with an arrow directed to the left are minus-end directed motors. Immobile kinesins are presented as motors without an arrow. ρ represents the molar ratio of immobile kinesins and tubulins for (K + MΦ), the molar ratio of walking kinesins and tubulins for (K + M+), or the molar ratio of minus-end directed motors and tubulins for (K + M). Note that the MT is saturated with kinesins when ρ is about 0.43. The line denotes the velocity and run length for (K + MΦ) obtained from Eqs 5 and 6. The results shown as circles, stars and diamonds are calculated from our stochastic model.
Fig 10
Fig 10. Spatial probability density of the position of the free head in the large domain.

Similar articles

Cited by

References

    1. Romberg L, Vale RD. Chemomechanical cycle of kinesin differs from that of myosin. Nature. 1993;361(6408):168–170. 10.1038/361168a0 - DOI - PubMed
    1. Mandelkow E, Johnson KA. The structural and mechanochemical cycle of kinesin. Trends Biochem Sci. 1998;23(11):429–433. 10.1016/S0968-0004(98)01278-X - DOI - PubMed
    1. Cross R, Crevel I, Carter N, Alonso M, Hirose K, Amos L. The conformational cycle of kinesin. Philos T Roy Soc B. 2000;355(1396):459–464. 10.1098/rstb.2000.0587 - DOI - PMC - PubMed
    1. Block SM, Asbury CL, Shaevitz JW, Lang MJ. Probing the kinesin reaction cycle with a 2D optical force clamp. Proc Natl Acad Sci. 2003;100(5):2351–2356. 10.1073/pnas.0436709100 - DOI - PMC - PubMed
    1. Hancock WO, Howard J. Kinesin’s processivity results from mechanical and chemical coordination between the ATP hydrolysis cycles of the two motor domains. Proc Natl Acad Sci. 1999;96(23):13147–13152. 10.1073/pnas.96.23.13147 - DOI - PMC - PubMed

Publication types

LinkOut - more resources