Three-Dimensional Quantitative Morphometric Analysis (QMA) for In Situ Joint and Tissue Assessment of Osteoarthritis in a Preclinical Rabbit Disease Model
- PMID: 26808542
- PMCID: PMC4726512
- DOI: 10.1371/journal.pone.0147564
Three-Dimensional Quantitative Morphometric Analysis (QMA) for In Situ Joint and Tissue Assessment of Osteoarthritis in a Preclinical Rabbit Disease Model
Abstract
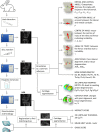
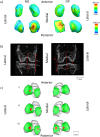
This work utilises advances in multi-tissue imaging, and incorporates new metrics which define in situ joint changes and individual tissue changes in osteoarthritis (OA). The aims are to (1) demonstrate a protocol for processing intact animal joints for microCT to visualise relevant joint, bone and cartilage structures for understanding OA in a preclinical rabbit model, and (2) introduce a comprehensive three-dimensional (3D) quantitative morphometric analysis (QMA), including an assessment of reproducibility. Sixteen rabbit joints with and without transection of the anterior cruciate ligament were scanned with microCT and contrast agents, and processed for histology. Semi-quantitative evaluation was performed on matching two-dimensional (2D) histology and microCT images. Subsequently, 3D QMA was performed; including measures of cartilage, subchondral cortical and epiphyseal bone, and novel tibio-femoral joint metrics. Reproducibility of the QMA was tested on seven additional joints. A significant correlation was observed in cartilage thickness from matching histology-microCT pairs. The lateral compartment of operated joints had larger joint space width, thicker femoral cartilage and reduced bone volume, while osteophytes could be detected quantitatively. Measures between the in situ tibia and femur indicated an altered loading scenario. High measurement reproducibility was observed for all new parameters; with ICC ranging from 0.754 to 0.998. In conclusion, this study provides a novel 3D QMA to quantify macro and micro tissue measures in the joint of a rabbit OA model. New metrics were established consisting of: an angle to quantitatively measure osteophytes (σ), an angle to indicate erosion between the lateral and medial femoral condyles (ρ), a vector defining altered angulation (λ, α, β, γ) and a twist angle (τ) measuring instability and tissue degeneration between the femur and tibia, a length measure of joint space width (JSW), and a slope and intercept (m, Χ) of joint contact to demonstrate altered loading with disease progression, as well as traditional bone and cartilage and histo-morphometry measures. We demonstrate correlation of microCT and histology, sensitive discrimination of OA change and robust reproducibility.
Conflict of interest statement
Figures


Similar articles
-
Quantitative measures of bone shape, cartilage morphometry and joint alignment are associated with disease in an ACLT and MMx rat model of osteoarthritis.Bone. 2021 May;146:115903. doi: 10.1016/j.bone.2021.115903. Epub 2021 Feb 27. Bone. 2021. PMID: 33652170
-
A microCT imaging protocol for reproducible and efficient quantitative morphometric analysis (QMA) of joint structures of the in situ mouse tibio-femoral joint.Bone. 2023 Jan;166:116606. doi: 10.1016/j.bone.2022.116606. Epub 2022 Nov 8. Bone. 2023. PMID: 36368467
-
Alterations in subchondral bone plate, trabecular bone and articular cartilage properties of rabbit femoral condyles at 4 weeks after anterior cruciate ligament transection.Osteoarthritis Cartilage. 2015 Mar;23(3):414-22. doi: 10.1016/j.joca.2014.11.023. Epub 2014 Dec 3. Osteoarthritis Cartilage. 2015. PMID: 25479166
-
Spatially matching morphometric assessment of cartilage and subchondral bone in osteoarthritic human knee joint with micro-computed tomography.Bone. 2019 Mar;120:393-402. doi: 10.1016/j.bone.2018.12.003. Epub 2018 Dec 8. Bone. 2019. PMID: 30529213
-
Quantitative multi-image analysis in metals research.MRS Commun. 2022;12(6):1030-1036. doi: 10.1557/s43579-022-00265-7. Epub 2022 Oct 14. MRS Commun. 2022. PMID: 36474648 Free PMC article. Review.
Cited by
-
Accelerating functional gene discovery in osteoarthritis.Nat Commun. 2021 Jan 20;12(1):467. doi: 10.1038/s41467-020-20761-5. Nat Commun. 2021. PMID: 33473114 Free PMC article.
-
Contrast-enhanced micro-computed tomography of articular cartilage morphology with ioversol and iomeprol.J Anat. 2020 Dec;237(6):1062-1071. doi: 10.1111/joa.13271. Epub 2020 Jul 19. J Anat. 2020. PMID: 32683740 Free PMC article.
-
Molecular Signaling Interactions and Transport at the Osteochondral Interface: A Review.Front Cell Dev Biol. 2020 Aug 19;8:750. doi: 10.3389/fcell.2020.00750. eCollection 2020. Front Cell Dev Biol. 2020. PMID: 32974333 Free PMC article. Review.
-
A Macaca Fascicularis Knee Osteoarthritis Model Developed by Modified Hulth Combined with Joint Scratches.Med Sci Monit. 2018 May 23;24:3393-3404. doi: 10.12659/MSM.906626. Med Sci Monit. 2018. PMID: 29789519 Free PMC article.
-
SPHARM-PDM based image preprocessing pipeline for quantitative morphometric analysis (QMA) for in situ joint assessment in rabbit and rat models.Sci Rep. 2022 Jan 21;12(1):1113. doi: 10.1038/s41598-021-04542-8. Sci Rep. 2022. PMID: 35064147 Free PMC article.
References
-
- Little CB, Smith MM. Animal Models of Osteoarthritis. Curr Rheum Rev. 2008;4(3):175–82.
-
- McCauley TR, Recht MP, Disler DG. Clinical imaging of articular cartilage in the knee. Semin Musculoskelet Radiol. 2001;5(4):293–304. - PubMed
-
- Eckstein F, Schnier M, Haubner M, Priebsch J, Glaser C, Englmeier KH, et al. Accuracy of cartilage volume and thickness measurements with magnetic resonance imaging. Clin Orthop. 1998;(352):137–48. . - PubMed
Publication types
MeSH terms
LinkOut - more resources
Full Text Sources
Other Literature Sources

