. 2016 Mar 1;126(3):905-20.
doi: 10.1172/JCI84014. Epub 2016 Jan 25.

Histone demethylase KDM2B regulates lineage commitment in normal and malignant hematopoiesis

Histone demethylase KDM2B regulates lineage commitment in normal and malignant hematopoiesis

Jaclyn Andricovich et al. J Clin Invest. .

Abstract

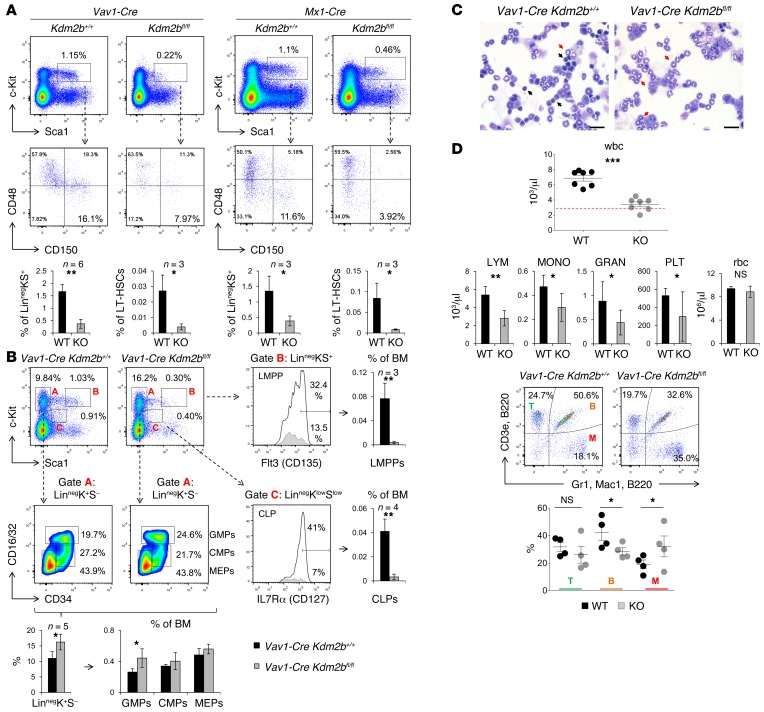
The development of the hematopoietic system is a dynamic process that is controlled by the interplay between transcriptional and epigenetic networks to determine cellular identity. These networks are critical for lineage specification and are frequently dysregulated in leukemias. Here, we identified histone demethylase KDM2B as a critical regulator of definitive hematopoiesis and lineage commitment of murine hematopoietic stem and progenitor cells (HSPCs). RNA sequencing of Kdm2b-null HSPCs and genome-wide ChIP studies in human leukemias revealed that KDM2B cooperates with polycomb and trithorax complexes to regulate differentiation, lineage choice, cytokine signaling, and cell cycle. Furthermore, we demonstrated that KDM2B exhibits a dichotomous role in hematopoietic malignancies. Specifically, we determined that KDM2B maintains lymphoid leukemias, but restrains RAS-driven myeloid transformation. Our study reveals that KDM2B is an important mediator of hematopoietic cell development and has opposing roles in tumor progression that are dependent on cellular context.


Figures

Figure 1
Figure 1. KDM2B is essential for embryonic development.
(A) Targeting strategy to generate the Kdm2b conditional allele. Exons 16–19 were targeted with loxp sites and a neomycin (Neo) cassette flanked by Frt sites. To remove the Neo cassette and generate the Kdm2blox allele, mice were crossed with the actin-Flpe strain. Tissue-specific deletion was achieved by crossing with appropriate Cre strains. Red arrows depict the position of PCR primers for the detection of Kdm2blox (P1:P2) and the recombined allele Kdm2bΔ (P3:P4). (B) Upper left: representative PCR to detect the Kdm2blox allele in tail-tip DNA samples from WT, heterozygous, and homozygous mice. Bottom left: Kdm2bfl/fl MEFs infected with adenoviruses that express GFP or Cre recombinase. PCR of genomic DNA shows excision of the floxed allele upon Cre expression. Asterisk indicates internal PCR control. Right: Western blot showing downregulation of long and short isoforms (arrowheads) of KDM2B from MEF whole-cell lysates. NS, nonspecific. (C and D) Gross images of WT and Kdm2b-null embryos at (C) E9.5 and (D) E10.5. Neural tube defects and excencephaly (white arrows), craniofacial defects (red arrow), and lack of yolk sac vasculature were observed in KO embryos. The red dotted line traces the aorta/AGM. Scale bars: 0.5 mm (C); 1 mm (D). (E) Gross images of E11.5 WT and Tie2-Cre Kdm2bfl/fl embryos. Red dotted line traces the aorta/AGM, and the black arrow points to the heart. Scale bar: 2 mm. (F) Flow cytometric analysis of dissected AGM showing the frequency of double-positive VE-cadherin/CD45 cells. Graph shows the mean ± SEM. n = 3. *P < 0.05. (G) Immunofluorescent staining of aortas from E10.5 embryos for KDM2B (red; nuclear) and c-Kit (green; cell surface). White arrow shows budding hemogenic endothelium and yellow arrow a circulating “stem-like” cell. Nuclei were stained with DAPI (blue). Scale bars: 10 μm.
Figure 2
Figure 2. KDM2B is required for maintenance and lineage commitment of HSPCs.
(A) Flow cytometric analysis of Vav1-Cre (left) and Mx1-Cre mice 2 months after pIpC (right) showing LinnegKS+ and LT-HSC frequencies (%) in BM of 10- to 15-week-old WT and Kdm2b-null mice. Bar graphs show mean ± SEM. *P < 0.05; **P < 0.01. (B) Composite analysis showing the frequency (%) of lymphoid (gate B for LMPP and gate C for CLP) and myeloid (gate A for MEP, CMP, and GMP) progenitors. Bold red type denotes the gates, and black numbers denote the percentages of gated cells. Right: bar graphs show the contribution (%) of LMPPs and CLPs in BM. Bottom: bar graphs depicting the percentages of LinnegK+S cells and the frequency (%) of GMP, CMP and MEP in BM. *P < 0.05; **P < 0.01. (C) May-Grünwald Giemsa–stained cytospin preparations of WT and Kdm2b-null BM. Note the rarity of lymphocytes (black arrows) and the expansion of immature myeloid cells (red arrows) in Kdm2b-null BM. Scale bars: 10 μm. (D) Top: scatter plots of wbc counts. Red dotted line indicates minimum physiological range. Bar graphs show the absolute number of lymphocytes (LYM), monocytes (MONO), granulocytes (GRAN), platelets (PLT), and rbc. Bottom: representative flow cytometric analysis and cumulative scatter plot showing the frequency (%) of T, B, and myeloid (M) cells in the peripheral blood. *P < 0.05. NS, not significant.
Figure 3
Figure 3. Ectopic expression of KDM2B expands lymphoid-primed progenitors in a Jumonji domain–dependent manner.
(A) Schematic of doxycycline-inducible Kdm2b or Kdm2bΔJmjC mice. Crosses with Vav1-Cre removed the “lox-stop-lox” cassette and allowed the expression of rtTA and GFP in the hematopoietic system, which was confirmed by flow cytometry. Bottom: Linneg BM cells were isolated from the indicated mice and cultured in the presence of doxycycline for 3 days. Ectopic expression of KDM2B was confirmed by Western blotting probing with an anti-MYC antibody that recognizes the exogenous MYC-tagged protein. (B) Composite analysis showing the frequency (%) of lymphoid (gate B for LMPP and gate C for CLP) and myeloid (gate A for MEP, CMP, and GMP) progenitors in mice that were administered doxycycline for 9 to 12 weeks to express KDM2B or KDM2BΔJmjC. Bold red type denotes the gates, and black numbers denote the percentages of gated cells. Bar graphs show the contribution (%) of GMPs, CMPs, MEPs, CLPs, LMPPs, and LT-HSCs in BM. *P < 0.05, ANOVA. (C) Scatter plot showing the frequency (%) of T, B, and myeloid cells in doxycycline-treated mice of the indicated genotypes. *P < 0.05, ANOVA. NS, not significant.
Figure 4
Figure 4. Intrinsic role of KDM2B in lineage commitment.
(A) 1 × 10⁶ CD45.2 WT or Kdm2b-null BM cells were injected into lethally irradiated CD45.1 recipients. Left: representative flow cytometric analysis showing the frequency (%) of CD45.2 and CD45.1 cells 1 and 2 months after transplantation. Right: cumulative bar graph from 5 independent transplantations. *P < 0.01 for CD45.1 cells. (B) Upper left: scatter plot of wbc in transplanted mice. Red dotted line indicates minimum physiological range. Upper right: stacked bar graph depicts the contribution (%) of lymphocytes, monocytes, and granulocytes. Bottom: bar graphs show the absolute number of lymphocytes, monocytes, granulocytes, platelets, and rbc. *P < 0.05; **P < 0.01; ***P < 0.001. (C) 1 × 10⁶ WT or Kdm2bfl/fl CD45.2 BM cells were injected in a 1:1 ratio with CD45.1 competitor cells. Left: flow cytometric analysis shows the frequency (%) of CD45.2 and CD45.1 cells before and 10 weeks after pIpC administration. Right: line graph showing the ratio of CD45.2/CD45.1 cells in recipients over time. n = 4. *P < 0.05; **P < 0.01. (D) Stacked bar graphs showing the contribution (%) of CD45.2 and CD45.1 cells in B and T cells, granulocytes, and monocytes after pIpC administration. Bottom: ratio of CD45.2 to CD45.1 cells.
Figure 5
Figure 5. KDM2B regulates cell fate and cycling of HSPCs.
(A) Volcano plot shows the differentially expressed genes (P < 0.05 and fold difference > 1.5) in Kdm2b-null LinnegKS+ progenitors compared with WT (n = 2). Red circles highlight the position of the indicated transcripts. Right: bar graph (mean ± SD) shows fold difference of the indicated transcripts in LinnegKS+ by qRT-PCR. (B) Bar graph (mean ± SD) shows the fold difference determined by qRT-PCR in the expression of the indicated transcripts in Kdm2b-null (black bars) and KDM2B-overexpressing (OE, gray bars) Linneg cells compared with WT controls. (C) Intracellular flow cytometric analysis of IKAROS and PAX5 transcription factors in WT and Kdm2b-null Linneg BM. (D) IPA of the differentially expressed genes identified in A. The x axis (log scale) corresponds to the binomial raw P values. (E) GSEA leading edge analysis identified 3 distinct modules regulated by KDM2B in LinnegKS+ cells. Color bar shows the overlap (%) between the individual gene sets. (F) Cell-cycle analysis of LinnegKS+ cells. n = 2. *P < 0.05.
Figure 6
Figure 6. Prooncogenic role of KDM2B in lymphoid malignancies.
(A) Meta-analysis of KDM2B expression in 159 human cell lines established from leukemias, lymphomas, and MM obtained from CCLE. MCL, mantle cell lymphoma; DLBCL, diffuse large B cell lymphoma; BL, Burkitt’s lymphoma; NHL, non-Hodgkin’s lymphomas. (B) Percentage growth inhibition of B-ALL (SUP-B15 and REH), T-ALL (CCRF-CEM, JURKAT, ALL-SIL, HPB-ALL, LOUCY, DND41, and K3P), CML (K562), AML (THP1), and MM cell lines 7 days after KD of KDM2B. Results are mean ± SEM. (C) The indicated cell lines were infected with lentiviruses to KD KDM2B. Left: Western blot shows successful KD of the endogenous protein. Middle and right: 1 × 10⁶ of those cells were injected in NSG mice via tail vein (n = 3 per group). After 3 months, mice were euthanized for histological analysis. H&E staining of lung sections shows reduced metastasis in mice that received cells treated with shKDM2B. Bar graph shows the average area of lung nodules. Asterisk indicates metastatic nodule. Scale bars: 200 μm. (D) Indicated cell lines were infected with lentiviruses to KD KDM2B. RNA was isolated and the gene-expression profile was obtained using the PrimeView microarray (Affymetrix). Bar graph shows IPA of the differentially expressed genes (P < 0.05 and fold change > 1.5). The x axis (log scale) corresponds to the binomial raw P values. (E) Ingenuity regulator analysis (see Methods) in JURKAT cells treated with shKDM2B. Regulators with z scores greater than 2 and P overlap values of less than 0.01 are shown.
Figure 7
Figure 7. Ablation of Kdm2b accelerates KRAS-driven myeloid transformation.
(A) Kaplan-Meier plots show the survival of AML patients in the TCGA LAML cohort that express low and high levels of KDM2B (left) and EZH2 (right). Survival analysis was performed with the PRECOG profiles software. (B) Kaplan-Meier plot showing the survival of Vav1-Cre KrasG12D Kdm2b+/+ (solid line) and Vav1-Cre KrasG12D Kdm2bfl/fl (dotted line) mice. Median survival in brackets. (C) Scatter plot of wbc and stacked bar graph of percentage contribution of different lineages. P < 0.05, ANOVA. Red dotted line indicates the maximum physiological range. Bottom: flow cytometry analysis showing the frequency (%) of T, B, and myeloid cells in the peripheral blood. (D) May-Grünwald Giemsa staining of blood smears and BM cytospin preparations from 3- and 6-week-old mice. Black arrows, lymphocytes; red arrows, immature granulocytes; orange arrows, myeloblasts. Scale bars: 10 μm. (E) RNA was isolated from Linneg Vav1-Cre KrasG12D Kdm2b+/+ and Kdm2bfl/fl cells (n = 2 mice for each genotype), and gene-expression profiles were obtained with the MoGene 2.0 ST whole transcript (exon) microarray (Affymetrix). Bar graph shows IPA of the differentially expressed genes (P < 0.05 and fold change >1.4). The x axis (log scale) corresponds to the binomial raw P values. Bottom: ingenuity regulator analysis (see Methods) in Kdm2b-null KRAS-driven leukemias. Regulators with z scores greater than 2 and P overlap values of less than 0.01 are shown.
Figure 8
Figure 8. Ectopic expression of KDM2B antagonizes KRAS-driven myeloid transformation.
(A) Left: scatter plot of wbc in Vav1-Cre KrasG12D Tet-Kdm2b and Tet-Kdm2bΔJmjC mice. P < 0.05, ANOVA. Red dotted line indicates the maximum physiological range. Right: stacked bar graph shows the contribution (%) of granulocytes, monocytes, and lymphocytes after doxycycline administration. (B) Kaplan-Meier plot showing the survival of Vav1-Cre KrasG12D Tet-Kdm2b and Tet-Kdm2bΔJmjC mice. n = 5; median survival in brackets. (C) RNA was isolated from Linneg Vav1-Cre KrasG12D Tet- and Vav1-Cre KrasG12D Tet-Kdm2b cells (n = 2 mice), and gene-expression profiles were obtained with the MoGene 2.0 ST whole transcript (exon) microarray (Affymetrix). Bar graph shows IPA of the differentially expressed genes (P < 0.05 and fold change > 1.4). The x axis (log scale) corresponds to the binomial raw P values. Bottom: ingenuity regulator analysis (see Methods) in KDM2B-overexpressing KRAS-driven leukemias. Regulators with z scores greater than 2 and P overlap values of less than 0.01 are shown.
Figure 9
Figure 9. KDM2B regulates cell fate and lineage commitment pathways.
(A) Combinatorial binding profiles of KDM2B in 7 human leukemia cell lines. Each horizontal line represents the signal for a gene over the TSS. A ± 2 kb window is shown for each gene. Color bar shows average log2 ChIP-seq signal intensity. Bottom: metagene analysis of the log2 ChIP-seq signal intensity over the TSS. (B and C) IPA of KDM2B-bound genes (B) in all cell lines (core genes), and (C) in individual cell lines. The x axis (log scale) corresponds to the binomial raw P values.
Figure 10
Figure 10. KDM2B crosstalks with PcG and TrxG complexes.
(A) Combinatorial binding profiles of KDM2B, PcG, and TrxG proteins in K562 cells. Each horizontal line represents the signal for a gene over the TSS. A ± 2 kb window is shown for each gene. Color bar shows average log2 ChIP-seq signal intensity. (B) Venn diagrams showing the overlap of KDM2B-bound genes with components of PRC1/2 (left) and c-MYC/TrxG (right) in K562 cells. (C) Stacked bar graph showing the functional annotation of chromatin occupied (%) by KDM2B, PRC1/2, and TrxG components in K562 cells. (D) IPA of KDM2B-bound genes in the context of PRC1/2 and c-MYC/TrxG. The x axis (log scale) corresponds to the binomial raw P values. (E) Model of KDM2B in hematopoiesis.

References

    1. Kiel MJ, Yilmaz OH, Iwashita T, Terhorst C, Morrison SJ. SLAM family receptors distinguish hematopoietic stem and progenitor cells and reveal endothelial niches for stem cells. Cell. 2005;121(7):1109–1121. doi: 10.1016/j.cell.2005.05.026. - DOI - PubMed
    1. McKinney-Freeman S, et al. The transcriptional landscape of hematopoietic stem cell ontogeny. Cell Stem Cell. 2012;11(5):701–714. doi: 10.1016/j.stem.2012.07.018. - DOI - PMC - PubMed
    1. Orkin SH, Zon LI. Hematopoiesis: an evolving paradigm for stem cell biology. Cell. 2008;132(4):631–644. doi: 10.1016/j.cell.2008.01.025. - DOI - PMC - PubMed
    1. Dzierzak E, Speck NA. Of lineage and legacy: the development of mammalian hematopoietic stem cells. Nat Immunol. 2008;9(2):129–136. doi: 10.1038/ni1560. - DOI - PMC - PubMed
    1. Foudi A, et al. Analysis of histone 2B-GFP retention reveals slowly cycling hematopoietic stem cells. Nat Biotechnol. 2009;27(1):84–90. - PMC - PubMed

Publication types

Substances