. 2016 Mar;13(3):263-8.
doi: 10.1038/nmeth.3735. Epub 2016 Jan 25.

A genetically targetable near-infrared photosensitizer

Affiliations

A genetically targetable near-infrared photosensitizer

Jianjun He et al. Nat Methods. 2016 Mar.

Abstract

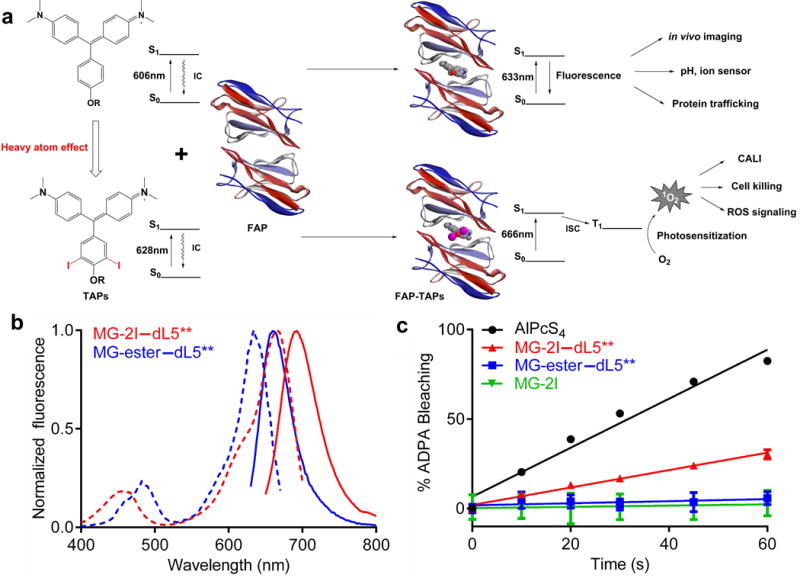
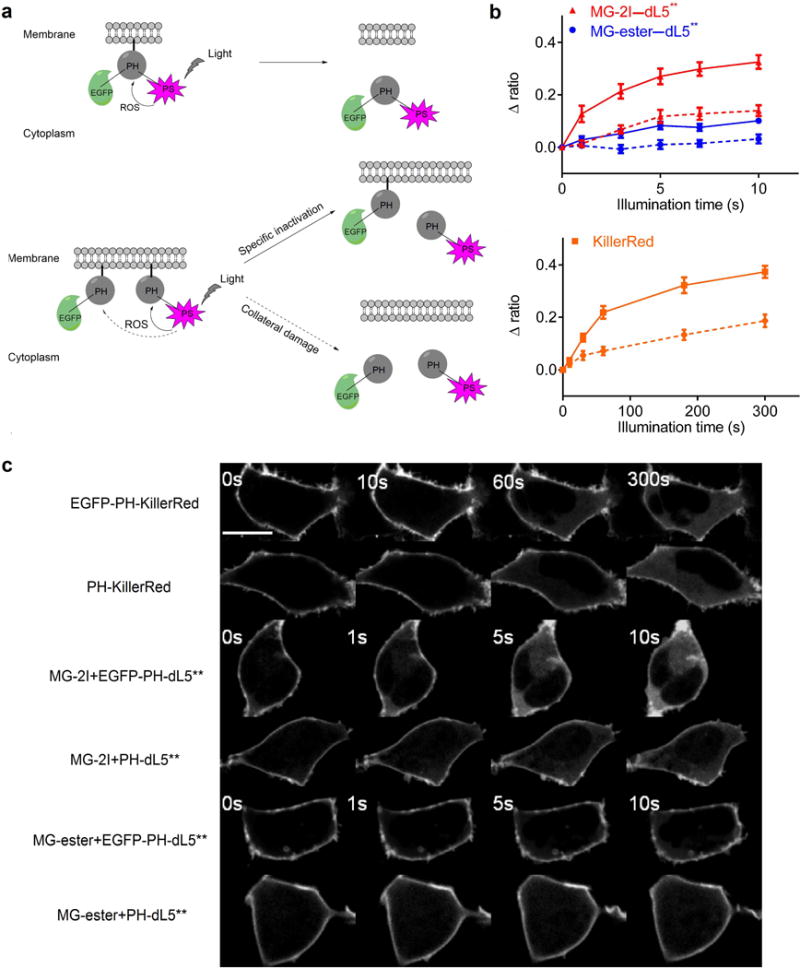
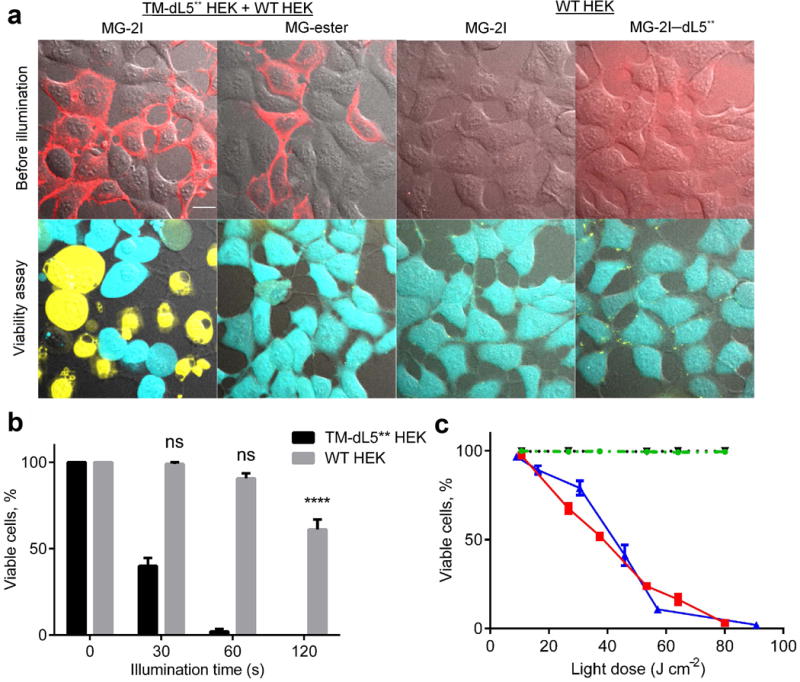
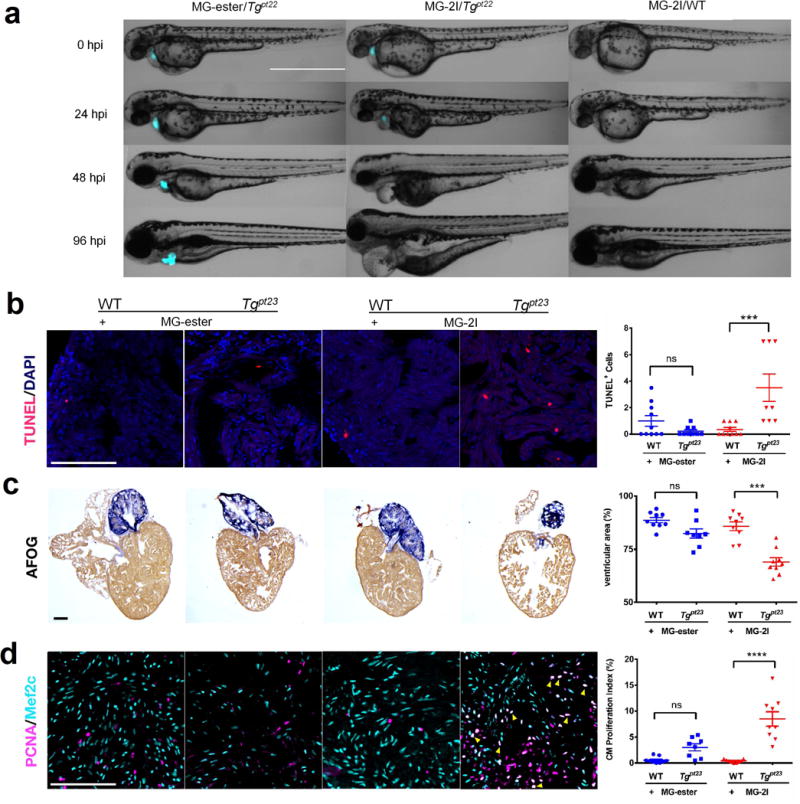
Upon illumination, photosensitizer molecules produce reactive oxygen species that can be used for functional manipulation of living cells, including protein inactivation, targeted-damage introduction and cellular ablation. Photosensitizers used to date have been either exogenous, resulting in delivery and removal challenges, or genetically encoded proteins that form or bind a native photosensitizing molecule, resulting in a constitutively active photosensitizer inside the cell. We describe a genetically encoded fluorogen-activating protein (FAP) that binds a heavy atom-substituted fluorogenic dye, forming an 'on-demand' activated photosensitizer that produces singlet oxygen and fluorescence when activated with near-infrared light. This targeted and activated photosensitizer (TAPs) approach enables protein inactivation, targeted cell killing and rapid targeted lineage ablation in living larval and adult zebrafish. The near-infrared excitation and emission of this FAP-TAPs provides a new spectral range for photosensitizer proteins that could be useful for imaging, manipulation and cellular ablation deep within living organisms.


Figures

Figure 1
Figure 1
Characterization of ROS generation by FAP-TAPs. (a) Illustration of the ROS generating mechanism of FAP-TAPs. IC: internal conversion by molecule’s free rotation, ISC: intersystem crossing; (b) Normalized excitation (dotted lines) and emission (solid lines) spectra of MG-ester and MG-2I binding to dL5**, where 500 nM fluorogen was complexed with 3 μM dL5** and the fluorescence intensity was individually normalized to the peak maxima; (c) Measurement of 1O2 generation by MG-2I–dL5** by ADPA, where bleaching of ADPA fluorescence was monitored at 374/402 nm as a function of 669 nm exposure time. AlPcS4 was used as standard for the 1O2 generation (ΦΔ= 0.34). Optically matched solutions of MG-2I–dL5** and AlPcS4 at 669 nm were used. (n = 4, mean and S.E.M. plotted)
Figure 2
Figure 2
FAP-TAPs mediated light-induced protein inactivation of the PLC δ1 PH domain. (a) Schematic outline of the experimental design. Top: EGFP-PH-KillerRed or EGFP-PH-dL5** triple fusion protein was constructed to evaluate the effectiveness of specific protein inactivation from KillerRed and FAP-TAPs. Bottom: EGFP-PH was co-expressed with PH-KillerRed or PH-dL5** to estimate the collateral damage from KillerRed and FAP-TAPs; (b) EGFP cytoplasm to membrane ratio change upon illumination of MG-2I with EGFP-PH-dL5**, MG-ester with EGFP-PH-dL5** and EGFP-PH-KillerRed (Solid lines). Dashed lines are corresponding collateral damage from co-expressed proteins; (n = 8, mean and S.E.M. plotted) (c) Representative EGFP fluorescent signal change from each condition, with imaging at fixed intervals. Scale bar = 5 μm and applied to all images. Illumination condition: KillerRed: 560 nm laser, 60× objective, 2.03 W cm−2; MG-ester–dL5** and MG-2I–dL5**: 640 nm laser, 60× objective, 2.07 W cm−2.
Figure 3
Figure 3
Phototoxicity of FAP-TAPs on HEK cells expressing surface targeted FAP. Cells were labeled with 400 nM of the indicated dye 30 min prior to illumination, without removal of the unbound dye. (a) Photo-induced cell death required both the binding of MG-2I to dL5** and the cellular targeting of the complex. Top panel: images taken before laser illumination, merge of c640 (red) and DIC; bottom panel: Live/Dead cell viability assay 30 min after illumination, merge of c488 (live cells in cyan), c560 (dead cells in yellow) and DIC. Scale bar = 10 μm and applied to all images; (b) Collateral damage to WT HEK cells caused by TAPs targeted to TM-dL5** HEK cells. A mixture of TM-dL5** and WT HEK cells were subjected to 0 s, 30 s, 60 s and 120 s illumination (640 nm, 40× objective, 0.76 W cm−2), the viability of TM-dL5** and WT HEK cells were plotted above (n = 8, One-way ANOVA, Tukey post hoc tests were performed with multiple comparisons, mean and S.E.M. plotted); (c) Light dose dependent cytotoxicity is seen on TM-dL5** cells labeled with MG-2I under variable light intensity (blue) or variable illumination duration (red). In contrast, no phototoxic effect is seen for MG-ester with TM-dL5** HEK cells (dotted black) or MG-2I with WT HEK cells (dashed green). Cells were illuminated using a LED light box. Cells were stained with propidium iodide (dead) and Hoechst (total) and over 300 cells were counted for each data point (n = 4, mean and S.E.M. plotted).
Figure 4
Figure 4
FAP-TAPs induced photo-ablation of cardiac function. (a) Phenotype development from 0 hpi to 96 hpi of larval zebrafish (Merge of DIC and mCer3 fluorescence (cyan), n = 20 for each group): MG-ester/Tgpt22, MG-2I/Tgpt22 and MG-2I/WT. In MG-2I/Tgpt22 group, the larvae developed a range of visible defects: large cardiac edema, small eyes, and collapsed, nonfunctional heart chambers. In both control groups, development proceeded normally. Scale Bar = 1000 μm and applied to all images; (b) FAP-TAPs photo-induced cardiac damage in adult zebrafish. Hearts were extracted at 3 dpi and TUNEL was performed to assess cell death; (c) Acid Fuchsin Orange G (AFOG) staining of hearts at 5 dpi showing the damaged cardiac structure in transgenic fish injected with MG-2I; (d) Mef2c (cardiomyocyte) and PCNA (proliferation) staining at 5 dpi shows enhanced cardiomyocyte proliferation (yellow arrow) in transgenic fish injected with MG-2I. Scale bar = 100 μm and applied to all images, n = 9 for all groups, One-way ANOVA, Tukey post hoc tests were performed with multiple comparisons of mean for each group. P-values were considered significant when < 0.05, shown as mean ± S.E.M.

References

    1. Lavis LD, Raines RT. Bright ideas for chemical biology. Acs Chem Biol. 2008;3:142–155. - PMC - PubMed
    1. Levskaya A, Weiner OD, Lim WA, Voigt CA. Spatiotemporal control of cell signalling using a light-switchable protein interaction. Nature. 2009;461:997–1001. - PMC - PubMed
    1. Lee HM, Larson DR, Lawrence DS. Illuminating the Chemistry of Life: Design, Synthesis, and Applications of “Caged” and Related Photoresponsive Compounds. Acs Chem Biol. 2009;4:409–427. - PMC - PubMed
    1. Dolmans DEJGJ, Fukumura D, Jain RK. Photodynamic therapy for cancer. Nat Rev Cancer. 2003;3:380–387. - PubMed
    1. Jacobson K, Rajfur Z, Vitriol E, Hahn K. Chromophore-assisted laser inactivation in cell biology. Trends Cell Biol. 2008;18:443–450. - PMC - PubMed

Publication types

MeSH terms

Substances