. 2016 Mar;13(3):269-75.
doi: 10.1038/nmeth.3742. Epub 2016 Jan 25.

Highly multiplexed simultaneous detection of RNAs and proteins in single cells

Affiliations

Highly multiplexed simultaneous detection of RNAs and proteins in single cells

Andreas P Frei et al. Nat Methods. 2016 Mar.

Abstract

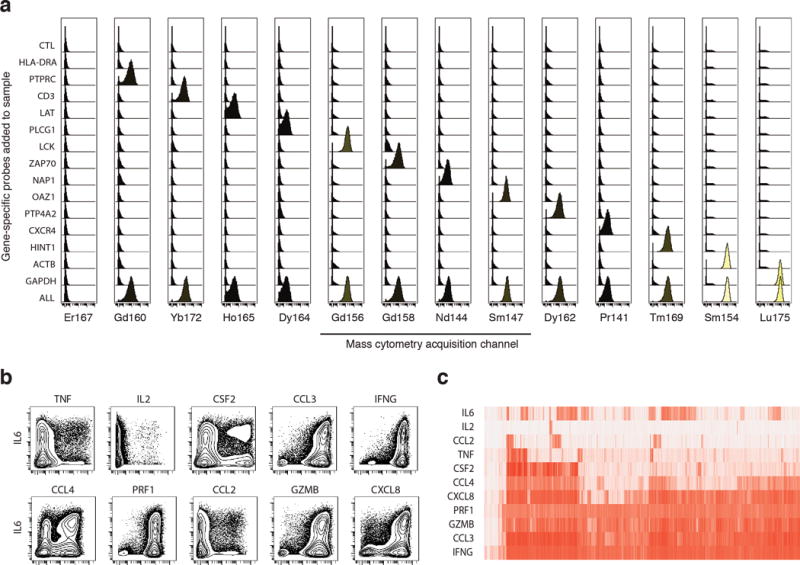
To enable the detection of expression signatures specific to individual cells, we developed PLAYR (proximity ligation assay for RNA), a method for highly multiplexed transcript quantification by flow and mass cytometry that is compatible with standard antibody staining. When used with mass cytometry, PLAYR allowed for the simultaneous quantification of more than 40 different mRNAs and proteins. In primary cells, we quantified multiple transcripts, with the identity and functional state of each analyzed cell defined on the basis of the expression of a separate set of transcripts or proteins. By expanding high-throughput deep phenotyping of cells beyond protein epitopes to include RNA expression, PLAYR opens a new avenue for the characterization of cellular metabolism.


Conflict of interest statement

Statement of Competing Financial Interests

G.P.N. has a personal financial interest in the company Fluidigm, the manufacturer of the mass cytometer used in this manuscript.

Figures

Figure 1
Figure 1. PLAYR enables the simultaneous quantification of specific transcripts and proteins in single cells
a) Main steps of the PLAYR protocol: 1) Fixation of cells captures their native state and permeabilization enables intracellular antibody staining and blocking of endogenous RNAses with inhibitors. 2) PLAYR probe pairs are added for proximal hybridization to target transcripts. 3) Backbone and insert oligonucleotides are added and form a circle if hybridized to PLAYR probes that are in close proximity (bound to a transcript). Insert sequences serve as cognate barcodes for targeted transcripts. 4) Backbone and insert oligonucleotides are ligated into a single-stranded DNA circle by T4 DNA ligase. 5) Rolling circle amplification of the DNA circle by phy29 polymerase. 6) Detection of rolling circle amplicons with suitably labeled oligonucleotides that bind to the insert regions. b) Detection of transcripts for three housekeeping genes that span a wide abundance range in U937 cells by mass cytometry. c) Quantification of CCL4 and IFNG mRNA by PLAYR and qPCR in NKL cells after stimulation with PMA-ionomycin. Measurements were performed at 4 time points in 3 replicates. d) Simultaneous IFNG mRNA and protein quantification by mass cytometry in NKL cells at indicated time points after stimulation with PMA-ionomycin.
Figure 2
Figure 2. Highly multiplexed measurement of different transcripts in single cells
a) Detection of 14 different transcripts in Jurkat cells by mass cytometry. PLAYR probes to transcripts not expressed in T cells (HLA-DRA) or to those encoding T cell surface markers, T cell signaling molecules, and housekeeping proteins of different abundance levels were used. Each row represents a sample to which probe pairs for one gene only or all genes simultaneously (bottom row) were added. Each column represents a mass cytometry acquisition channel that monitors a metal reporter used to detect transcripts of a given gene. Non-cognate probes that are using the same insert system but bind to different target transcripts were included as an additional control (CTL). b) NKL cells were primed with IL2, IL12 and IL18 and stimulated with PMA-ionomycin for 3 hours. Contour plots display co-expression of NKL effector transcripts as measured by mass cytometry. c) 10000 cells were randomly sampled from the data in (b) and transcript expression was represented in heat map format. Each column corresponds to a single cell and rows denote different effector transcripts. Rows and columns of the heat map were clustered for visual clarity (dendrograms not shown). Experiments were run multiple times and representative examples are shown.
Figure 3
Figure 3. Highly multiplexed measurement of transcripts within cell types defined by other transcripts or protein epitopes
a) viSNE analysis of embryonic stem cells, differentiating embryonic stem cells, and embryonic fibroblasts of mice based on expression of 15 transcripts (Cd44, Mki67, Cdh1, Cd47, Klf4, Esrrb, Actb, Sox2, Lincenc1, Zfp42, Sall4, Cd9, Pou5f1 (Oct4), Thy1, Nanog) with overlays showing the location of the three cell populations. b) Color-coded expression levels of selected transcripts used to construct the viSNE map. c) viSNE analysis of PBMCs based on expression of 10 surface protein markers (CD19, CD4, CD8, CD20, PTPRC (CD45), PTPRCRA (CD45RA), CD33, ITGAX (CD11c), CD3, HLA-DRA) with overlays showing the location of major cell populations. d) Expression of selected proteins and the corresponding transcripts was overlaid in the viSNE map shown in (c) and color-coded by signal intensity. e) Contour plots displaying correlations of protein and transcript levels for HLA-DRA and ITGAX in individual PBMCs. Experiments were run multiple times and representative examples are shown.
Figure 4
Figure 4. Measurements of cytokine transcript induction in human PBMCs by mass cytometry and fluorescence flow cytometry
a) Mass cytometry gating strategy for human PBMCs. b) Heat map representing the mean expression values of cytokine transcripts at different time points after stimulation with LPS in different cellular populations defined by protein surface markers. c) Cytokine expression in the CD14+ monocyte population as measured by fluorescence flow cytometry. d) Cytokine transcript expression in the CD14+ monocyte population as measured by mass cytometry. e) Contour plots showing interleukin 8 (CXCL8) and tumor necrosis factor alpha (TNF) transcript expression in CD14+ monocytes as measured by fluorescence flow cytometry. Experiments were run multiple times and representative examples are shown.
Figure 5
Figure 5. Single-cell resolution map of cytokine induction in human PBMCs
PBMCs were stimulated with LPS and analyzed after 4 hours. Cells were analyzed with antibodies against cell surface proteins (CD19, CD38, CD4, CD8, CD7, CD14, IL3RA (CD123), PTPRC (CD45), PTPRCRA (CD45RA), CD33, ITGAX (CD11c), FCGR3A (CD16), CD3, CD20, HLA-DRA, NCAM1 (CD56) and phosphorylation sites pP38 MAPK (pT180/pY182), pERK1/2 (pT202/pY204). a) viSNE map based on cell surface marker expression with overlays showing the location of major cell populations. b) Selected protein markers used to define myeloid cell populations and MAPK signaling were color-coded by expression level. c) Measurements for 8 different cytokine transcripts were overlaid and color-coded by expression level. The experiment was run multiple times and a representative example is shown.

Comment in

References

    1. Jaitin DA, et al. Massively parallel single-cell RNA-seq for marker-free decomposition of tissues into cell types. Science. 2014;343:776–779. - PMC - PubMed
    1. Hashimshony T, Wagner F, Sher N, Yanai I. CEL-Seq: single-cell RNA-Seq by multiplexed linear amplification. Cell Rep. 2012;2:666–673. - PubMed
    1. Islam S, et al. Highly multiplexed and strand-specific single-cell RNA 5′ end sequencing. Nat Protoc. 2012;7:813–828. - PubMed
    1. Islam S, et al. Quantitative single-cell RNA-seq with unique molecular identifiers. Nat Methods. 2014;11:163–166. - PubMed
    1. Ramsköld D, et al. Full-length mRNA-Seq from single-cell levels of RNA and individual circulating tumor cells. Nat Biotechnol. 2012;30:777–782. - PMC - PubMed

Publication types