. 2016 Jan 25;11(1):e0147723.
doi: 10.1371/journal.pone.0147723. eCollection 2016.

Replication-Competent Influenza A and B Viruses Expressing a Fluorescent Dynamic Timer Protein for In Vitro and In Vivo Studies

Affiliations

Replication-Competent Influenza A and B Viruses Expressing a Fluorescent Dynamic Timer Protein for In Vitro and In Vivo Studies

Michael Breen et al. PLoS One. .

Abstract

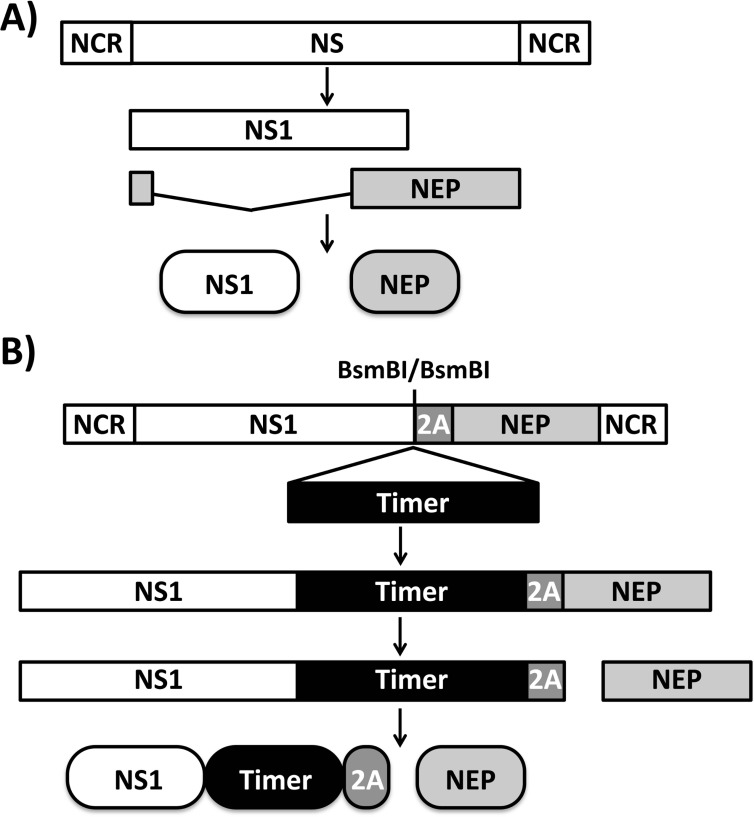
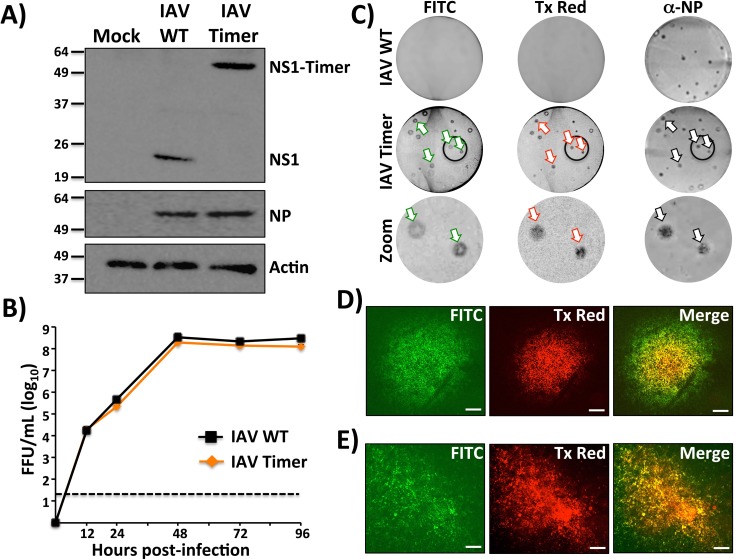
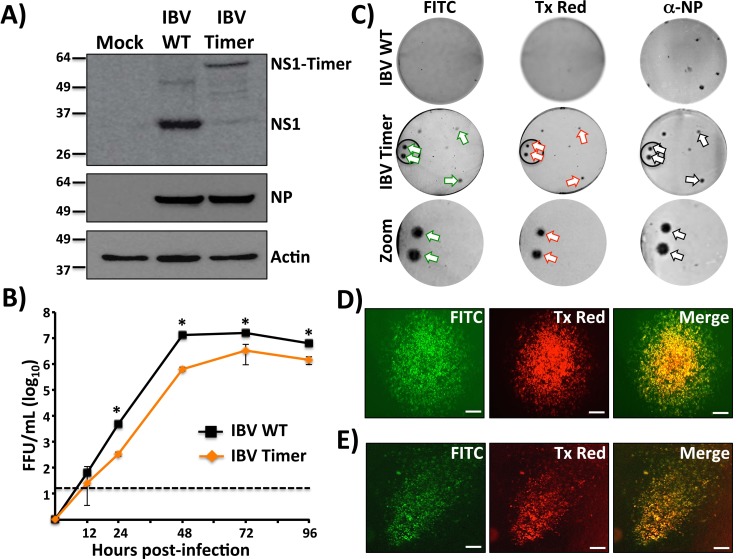
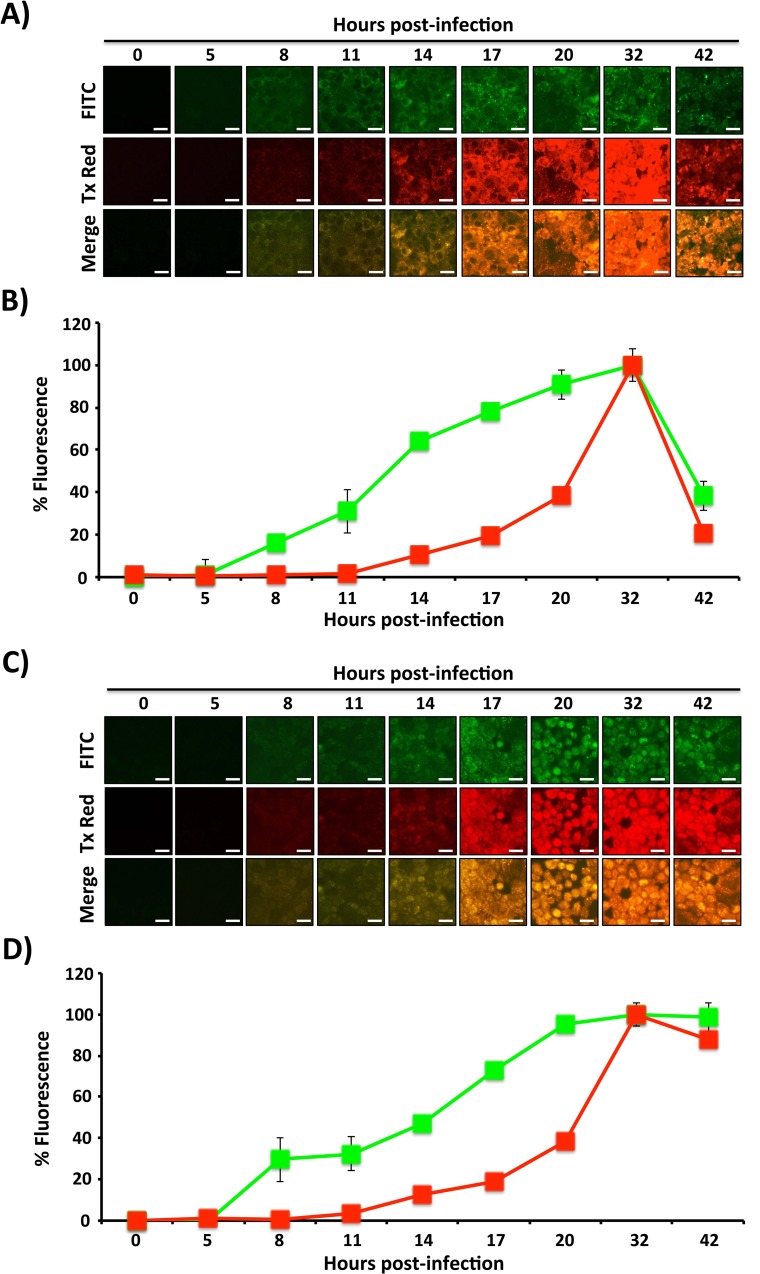
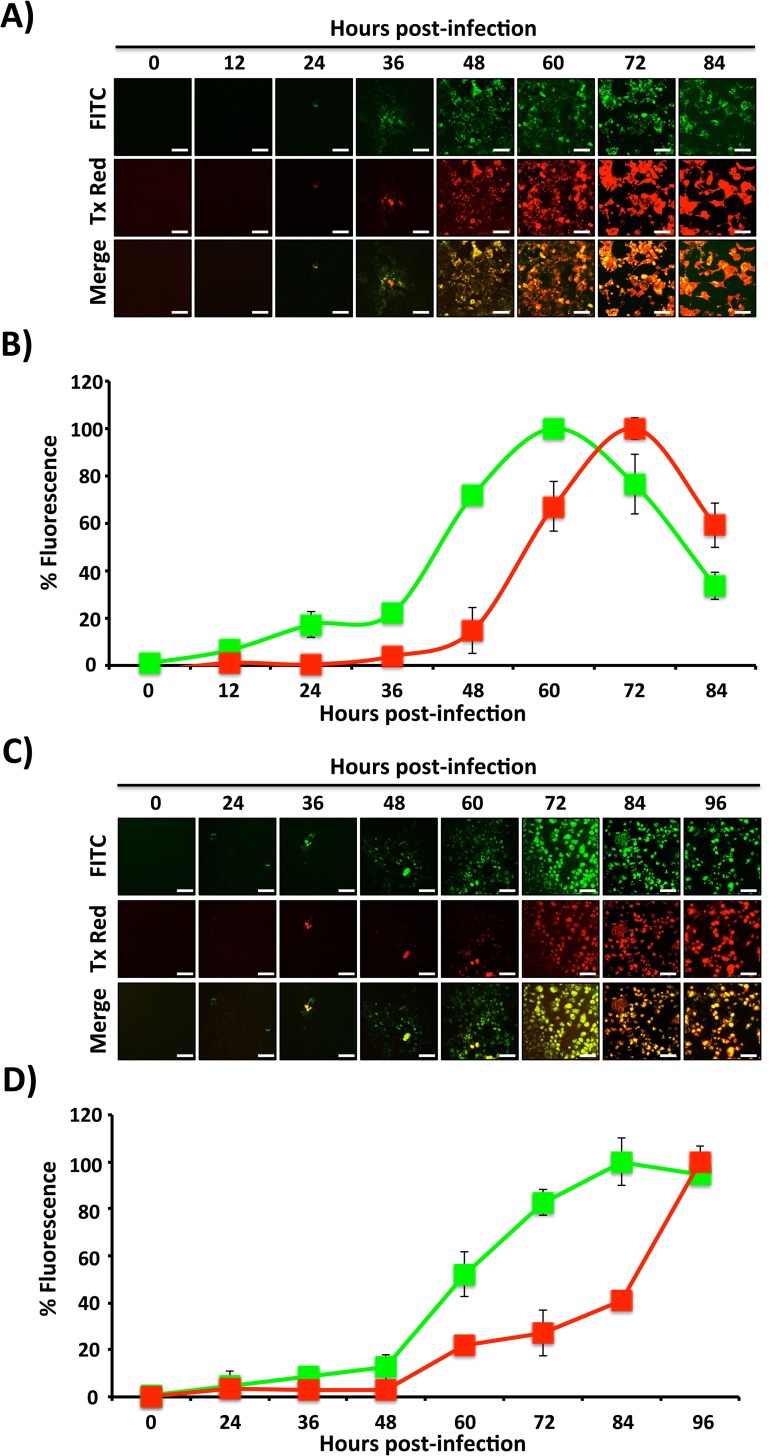
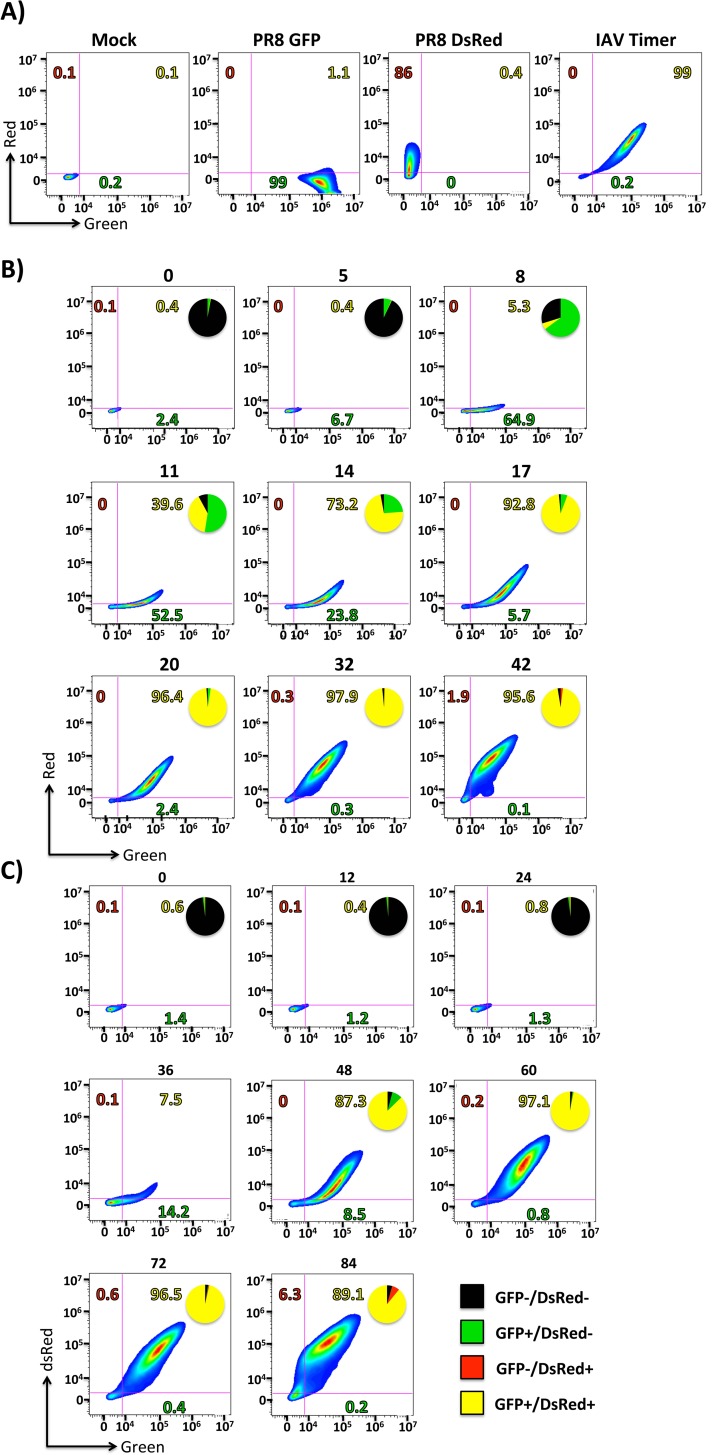
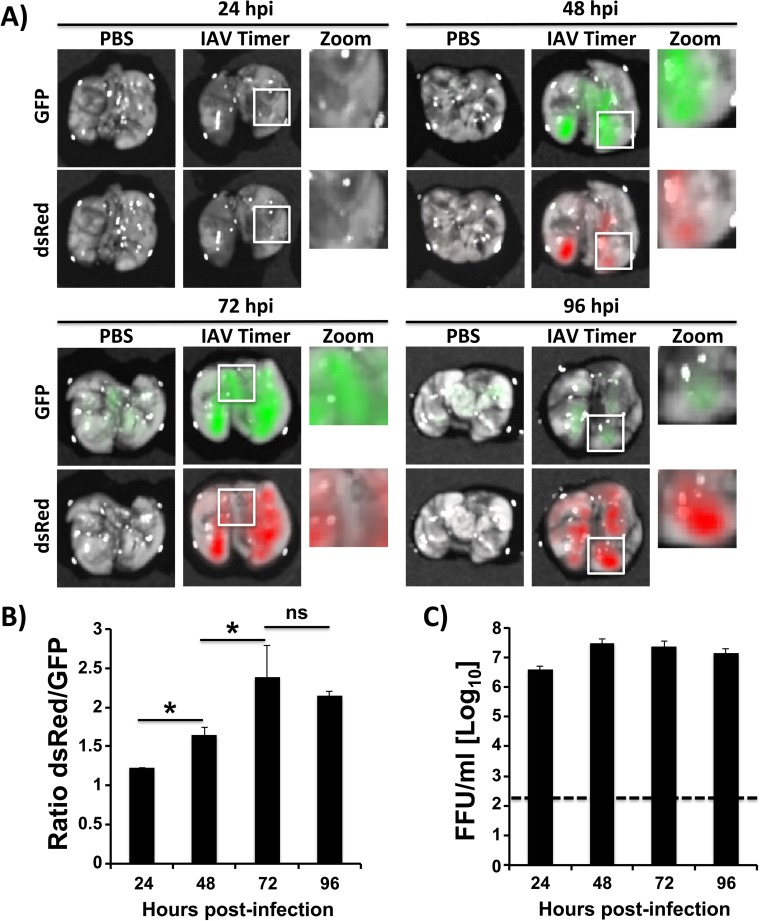
Influenza A and B viruses (IAV and IBV, respectively) cause annual seasonal human respiratory disease epidemics. In addition, IAVs have been implicated in occasional pandemics with inordinate health and economic consequences. Studying influenza viruses in vitro or in vivo requires the use of laborious secondary methodologies to identify infected cells. To circumvent this requirement, replication-competent infectious influenza viruses expressing an easily traceable fluorescent reporter protein can be used. Timer is a fluorescent protein that undergoes a time-dependent color emission conversion from green to red. The rate of spectral change is independent of Timer protein concentration and can be used to chronologically measure the duration of its expression. Here, we describe the generation of replication-competent IAV and IBV where the viral non-structural protein 1 (NS1) was fused to the fluorescent dynamic Timer protein. Timer-expressing IAV and IBV displayed similar plaque phenotypes and growth kinetics to wild-type viruses in tissue culture. Within infected cells, Timer's spectral shift can be used to measure the rate and cell-to-cell spread of infection using fluorescent microscopy, plate readers, or flow cytometry. The progression of Timer-expressing IAV infection was also evaluated in a mouse model, demonstrating the feasibility to characterize IAV cell-to-cell infections in vivo. By providing the ability to chronologically track viral spread, Timer-expressing influenza viruses are an excellent option to evaluate the in vitro and in vivo dynamics of viral infection.


Conflict of interest statement

Competing Interests: The authors have declared that no competing interests exist.

Figures

Fig 1
Fig 1. Schematic representation of wild-type (A) and Timer-expressing (B) influenza A and B NS segments.
Influenza NS segment viral products are indicated by white (NS1) or gray (NEP) boxes. Timer fluorescent protein and the porcine teschovirus-1 (PTV-1) 2A site are indicated by black and gray boxes, respectively. NCR, non-coding regions. BsmBI restriction sites used to clone Timer between NS1 and PTV-1 2A are indicated.
Fig 2
Fig 2. Characterization of Timer-expressing IAV.
A) Analysis of protein expression by Western blot: MDCK cells were mock infected or infected (MOI 3) with WT or Timer-expressing IAVs. At 24 hpi, cell extracts were prepared and analyzed for NS1 and NP expression levels using specific antibodies. Actin was used as a loading control. Numbers indicate the size of molecular markers in kDa. B) Multicycle growth kinetics: Viral titers from TCS of MDCK cells infected (MOI 0.001) with WT and Timer-expressing IAVs at the indicated times (0, 12, 24, 48, 72 and 96 hours) were analyzed by immunofocus assay (FFU/ml). Data represent the means ± SD of the results determined from triplicates. Dotted line indicates the limit of detection (20 FFU/ml). C) Plaque phenotype: WT and Timer-expressing IAV plaques were evaluated at 3 dpi by fluorescence using filters for fluorescein isothiocyanate (FITC) or Texas Red (Tx Red) and by immunostaining using an IAV anti-NP MAb. Arrows indicate correlation between fluorescence and the immunostaining. A zoom of the areas into the black circles for IAV-Timer is showed. “Bull’s eye” plaque (D) and “comet tail” (E) assays: Monolayers of MDCK cells were infected (MOI 0.001) with IAV-Timer and covered with solid (D) or liquid (E) media. At 72 hours post-infection, infected cells were visualized using filters for FITC and Tx Red. Merged images are showed. Scale bar, 200 μm.
Fig 3
Fig 3. Characterization of IBV-Timer.
A) Analysis of protein expression by Western blot: MDCK cells were mock infected or infected (MOI 3) with WT or Timer-expressing IBVs. At 24 hpi, cell extracts were prepared and analyzed for NS1 and NP expression levels using specific antibodies. Actin was used as a loading control. Numbers indicate the size of molecular markers in kDa. B) Multicycle growth kinetics: Viral titers from TCS of MDCK cells infected (MOI 0.001) with WT and Timer-expressing IBV were determined at the indicated times post-infection (0, 12, 24, 48, 72 and 96 hours) by immunofocus assay (FFU/ml). Data represent the means ± SD of the results determined from triplicates. Dotted line denotes the limit of detection (20 FFU/ml). *P < 0.05 using an unpaired two-tailed Student’s test. C) Plaque phenotype: Plaque sizes of WT and Timer-expressing IBVs were evaluated at 3 dpi by fluorescence using filters for fluorescein isothiocyanate (FITC) or Texas Red (Tx Red) and by immunostaining using an IBV anti-NP MAb. Arrows indicate correlation between fluorescence and the immunostaining. A zoom of the areas into the black circles for IBV-Timer is showed. “Bull’s eye” plaque (D) and “comet tail” (E) assays: Monolayers of MDCK cells were infected (MOI 0.001) with IBV-Timer and covered with solid (D) or liquid (E) media. At 72 hours post-infection, infected cells were visualized using filters for FITC and Tx Red. Merged images are showed. Scale bar, 200 μm.
Fig 4
Fig 4. Whole population Timer fluorescence dynamics in MDCK cells infected with high MOI.
MDCK cells were infected (MOI 3) with Timer-expressing IAV (A and B) or IBV (C and D) and, at the indicated times post-infection, fluorescence expression was analyzed using FITC or Tx Red filters on a fluorescence microscope (A and C). Representative images and their merge are shown. Scale bar, 25 μm. Levels of green and red fluorescence in infected cell monolayers were quantified at the same times post-infection using a fluorescence microplate reader (B and D). Data represent the means ± SD of the results determined from triplicate wells.
Fig 5
Fig 5. Timer-expression dynamics in MDCK cells infected with low MOI.
MDCK cells were infected (MOI 0.001) with Timer-expressing IAV (A and B) or IBV (C and D) and, at the indicated times post-infection, monolayers were analyzed for Timer expression using FITC or Tx Red filters under a fluorescence microscope (A and C). Representative images and their merge are illustrated. Scale bar, 50 μm. The levels of green and red fluorescence were quantified at the same times post-infection using a fluorescent microplate reader (B and D). Data represent the means ± SDs of the results determined from triplicate wells.
Fig 6
Fig 6. Flow cytometric analysis of cells infected with Timer-expressing IAV.
A) Dual-fluorescence of Timer-infected cells: MDCK cells were either mock infected or infected (MOI 3) with GFP-, DsRed- or Timer-expressing IAV. At 24 hpi, infected cell suspensions were analyzed and quantified for fluorescence expression using flow cytometry. B and C) Analysis of Timer expression from IAV-infected cells: MDCK cells were infected at high (3) (B) or low (0.001) (C) MOI and analyzed for fluorescence expression at the indicated times post-infection. Gates were set on mock-infected cells. Pie charts within plots indicate the percentage of each population GFP-/DsRed- (black), GFP+/DsRed- (green), GFP-/DsRed+ (red) and GFP+/DsRed+ (yellow).
Fig 7
Fig 7. Kinetics of IAV-Timer infection in mouse lungs.
Female 6-to-8-week-old C57BL/6 mice (n = 3) were inoculated intranasally with PBS or with 105 PFU of IAV-Timer. At 24, 48, 72 and 96 hpi, mice lungs were excised to evaluate and quantify fluorescence (A and B) and production of infectious virus (C). A and B) Fluorescence imaging of infected lungs: Lungs from mock infected (PBS) and IAV-Timer-infected mice were harvested and analyzed by IVIS (A). Representative fluorescence images are shown. The radiant efficiency fold induction from individual mice using DsRed or GFP filters was normalized to mock infected mice. The average ratio of DsRed/GFP expression was determined at each time point (B). Columns represent mean +/- SD. Statistical significance was calculated using two-tailed Student’s t test. * indicates P values < 0.05. C) Viral lung titers. Lung homogenates were used to quantify presence of virus by immunofocus assay (FFU/ml). Bars represent the mean +/-SD. Dotted line denotes the limit of detection (200 FFU/ml).

Similar articles

Cited by

References

    1. CDC. Deaths: Final Data for 2013. 2013 February 6. Report No.
    1. WHO. Influenza (Seasonal) Fact Sheet N211 http://www.who.int/mediacentre/factsheets/fs211/en/2014 [November 2]. Available from: http://www.who.int/mediacentre/factsheets/fs211/en/.
    1. Simonsen L, Clarke MJ, Williamson GD, Stroup DF, Arden NH, Schonberger LB. The impact of influenza epidemics on mortality: introducing a severity index. Am J Public Health. 1997;87(12):1944–50. Epub 1998/02/07. ; PubMed Central PMCID: PMCPmc1381234. - PMC - PubMed
    1. CDC. Updated CDC Estimates of 2009 H1N1 Influenza Cases, Hospitalizations and Deaths in the United States, April 2009–April 10, 2010 2010 [updated May 14; cited 2013]. Available from: http://www.cdc.gov/h1n1flu/estimates_2009_h1n1.htm.
    1. Dawood FS, Iuliano AD, Reed C, Meltzer MI, Shay DK, Cheng P-Y, et al. Estimated global mortality associated with the first 12 months of 2009 pandemic influenza A H1N1 virus circulation: a modelling study. The Lancet Infectious Diseases. 2012;12(9):687–95. 10.1016/S1473-3099(12)70121-4 - DOI - PubMed

Publication types

Substances