. 2016 Feb 8;213(2):177-87.
doi: 10.1084/jem.20150435. Epub 2016 Jan 25.

Btn2a2, a T cell immunomodulatory molecule coregulated with MHC class II genes

Affiliations

Btn2a2, a T cell immunomodulatory molecule coregulated with MHC class II genes

Kerstin Sarter et al. J Exp Med. .

Abstract

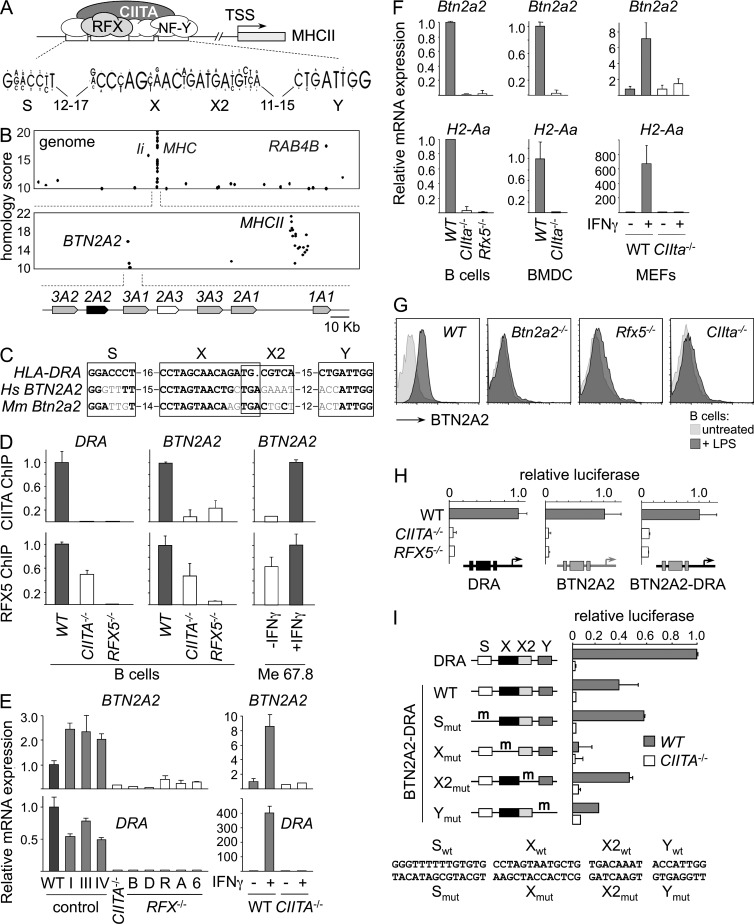
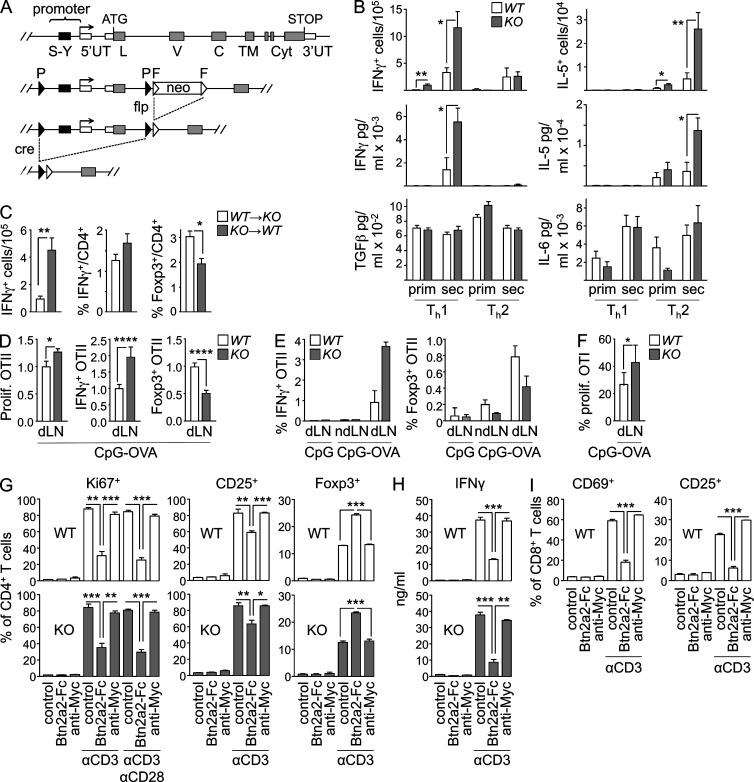
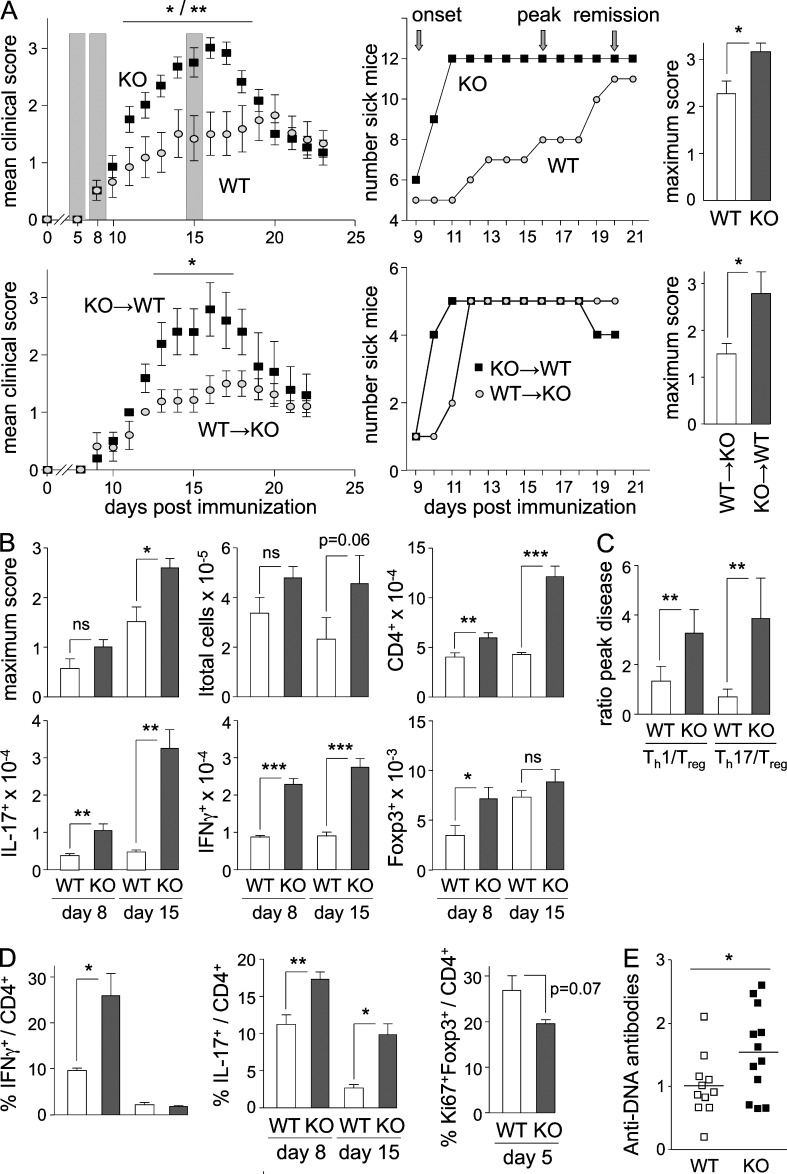
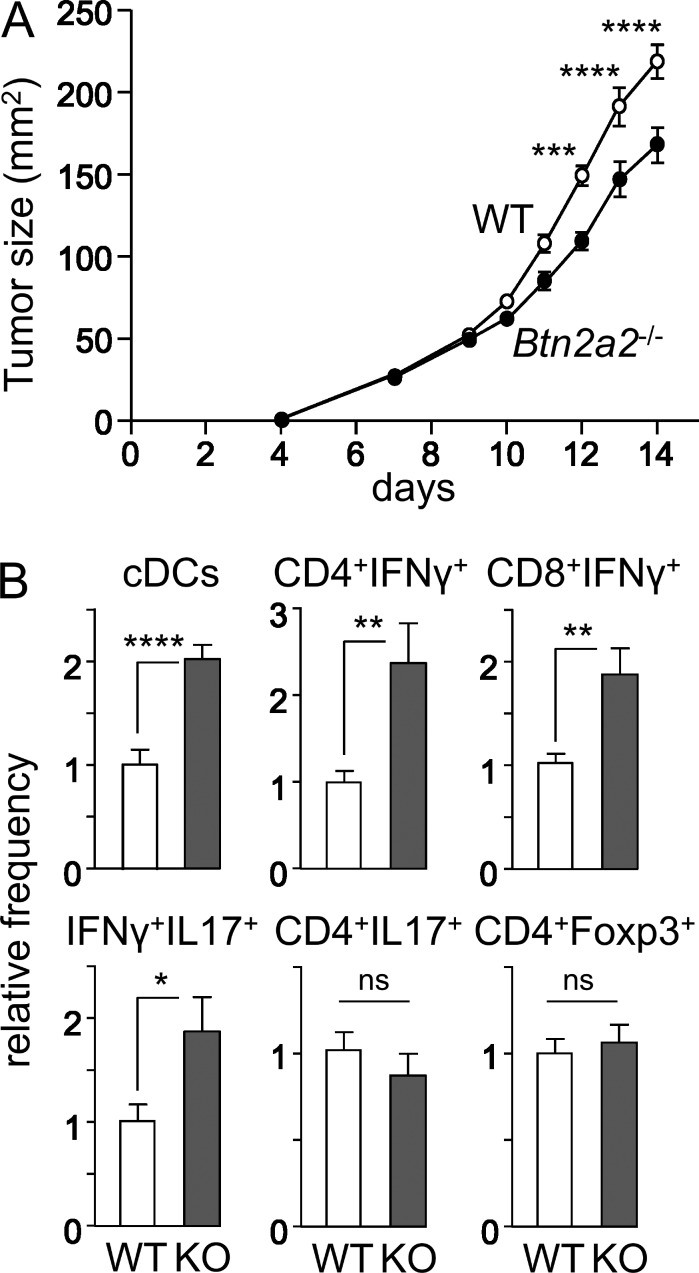
Evidence has recently emerged that butyrophilins, which are members of the extended B7 family of co-stimulatory molecules, have diverse functions in the immune system. We found that the human and mouse genes encoding butyrophilin-2A2 (BTN2A2) are regulated by the class II trans-activator and regulatory factor X, two transcription factors dedicated to major histocompatibility complex class II expression, suggesting a role in T cell immunity. To address this, we generated Btn2a2-deficient mice. Btn2a2(-/-) mice exhibited enhanced effector CD4(+) and CD8(+) T cell responses, impaired CD4(+) regulatory T cell induction, potentiated antitumor responses, and exacerbated experimental autoimmune encephalomyelitis. Altered immune responses were attributed to Btn2a2 deficiency in antigen-presenting cells rather than T cells or nonhematopoietic cells. These results provide the first genetic evidence that BTN2A2 is a co-inhibitory molecule that modulates T cell-mediated immunity.


Figures

Figure 1.
Figure 1.
Coregulation of BTN2A2 with MHCII genes. (A) Schematic representation of transcription factors (RFX, NF-Y, and CIITA) bound to the SXY module of MHCII promoters. The consensus SXY sequence is shown. TSS, transcription start site. (B) The human genome was scanned for promoters containing SXY motifs. Homology scores are plotted as a function of position in the genome. Dots corresponding to known RFX and CIITA targets (BTN2A2, RAB4B, Ii, and MHCII genes) are labeled. A map of the BTN locus is indicated underneath the graphs. (C) Human BTN2A2 and mouse Btn2a2 SXY modules are aligned with that of HLA-DRA. Conserved positions are in bold. (D) The occupation of HLA-DRA and BTN2A2 promoters by RFX and CIITA was quantified by ChIP in WT (Raji), CIITA−/− (RJ2.2.5), and RFX5−/− (SJO) B cells, or in untreated and IFN-γ–induced Me67.8 cells. Occupancy is expressed relative to WT or induced cells. (E, left) BTN2A2 and HLA-DRA mRNAs were quantified by qRT-PCR in Raji (R), RJ2.2.5 (CIITA−/−), RJ2.2.5 complemented with expression vectors encoding CIITA isoforms I, III, or IV, and RFX-deficient B cell lines BLS-1 (B), Da (D), Ro, Abd (A), and 6.1.6 (6). (Right) BTN2A2 and HLA-DRA mRNAs were quantified by qRT-PCR in untreated and IFN-γ–induced human umbilical vein endothelial cells (WT) and CIITA−/− fibroblasts (BLS3). Results were normalized using TBP mRNA and expressed relative to Raji (left) or uninduced WT cells (right). (F) Btn2a2 and H2-Aa mRNAs were quantified by qRT-PCR in splenic B cells, BMDCs, or untreated and IFN-γ–treated MEFs from WT, CIITA−/−, and RFX5−/− mice. Results were normalized using TBP mRNA or 18S ribosomal RNA and expressed relative to WT. (G) BTN2A2 expression by untreated and LPS-activated splenic CD19+ B cells from WT, Btn2a2−/−, Rfx5−/−, and CIIta−/− mice was analyzed by flow cytometry. (H) Luciferase reporter assays were performed in WT (Raji), CIITA−/− (RJ2.2.5), and RFX−/− (SJO) cells using constructs driven by HLA-DRA (left) or BTN2A2 (middle) promoters, or by a hybrid promoter in which the SXY module of HLA-DRA was replaced with that of BTN2A2 (right). Activity is expressed relative to WT. (I) Luciferase activity was measured in WT (Raji) and CIITA−/− (RJ2.2.5) cells for BTN2A2-DRA constructs containing mutations in the S, X, X2, and Y elements. Results are expressed relative to HLA-DRA in WT. (D–F, H, and I) Results show means and standard deviations derived from three experiments. (F and G) At least three mice per group were analyzed in each experiment.
Figure 2.
Figure 2.
Modulation of T cell responses by BTN2A2. (A) The SXY module and first two exons of Btn2a2 were flanked with loxP sites. Flp recombinase was used to excise the frt-flanked neomycine resistance gene used for targeting. Deletion was achieved by crossing with deleter cre mice. (B) OVA-specific IFN-γ– and IL-5–producing splenocytes were quantified by ELISPOT, and IL-5, IFN-γ, TGF-β, and IL-6 production was quantified by ELISA in supernatants of OVA-restimulated splenocytes after primary and secondary immunization of WT and Btn2a2−/− mice under Th1 and Th2 conditions. (C) OVA-specific IFN-γ+ splenocytes were quantified by ELISPOT, and frequencies of splenic IFN-γ+ or Foxp3+CD4+ T cells were quantified by flow cytometry for KO→WT and WT→KO chimeras immunized with OVA and alum + CpG. (B and C) Results were pooled from two experiments, each with eight or nine mice per group. (D) CFSE-labeled OTII T cells were transferred into WT and Btn2a2−/− (KO) mice immunized with OVAII peptide plus CpG. OTII T cell proliferation in dLNs was assessed by CFSE dilution. Frequencies of IFN-γ+ and Foxp3+ OTII T cells were measured by flow cytometry. Results were pooled from three experiments (total of 11–14 mice per group) and expressed relative to WT. (E) CFSE-labeled OTII T cells were transferred into Btn2a2−/− (KO) or WT mice (seven mice per group) immunized with OVAII peptide plus CpG or CpG alone. Frequencies of IFN-γ+ and Foxp3+ OTII T cells in draining (dLN) or nondraining (ndLN) LNs were measured by flow cytometry. Results were confirmed in three independent experiments. (F) Proliferating Ki67+ OTI T cells were quantified by flow cytometry in dLNs of WT and Btn2a2−/− (KO) mice immunized with OVAI peptide plus CpG. Results were pooled from two experiments, each with three to five mice per group. (G and H) CD4+ T cells from Btn2a2−/− (KO) and WT mice were activated with anti-CD3 or anti-CD3/anti-CD28 in the absence or presence of a BTN2A2-Fc fusion protein or control c-Myc Ab. Proliferation (Ki67 expression), activation (CD25 expression), and Treg differentiation (Foxp3 expression) were assessed by flow cytometry (G). IFN-γ production by was quantified by ELISA (H). (I) CD8+ T cells from Btn2a2−/− (KO) and WT mice were activated with anti-CD3 in the presence or absence of a BTN2A2-Fc fusion protein or control c-Myc Ab. Activation (CD25 and CD69 expression) was assessed by flow cytometry. (G–I) Results are representative of three experiments, each with three mice per group. (B–I) *, P < 0.05; **, P < 0.01; ***, P < 0.001; ****, P < 0.0001. Error bars are SD of the mean.
Figure 3.
Figure 3.
Autoimmunity in Btn2a2−/− mice. (A) EAE was induced by immunization with MOG35–55 + CFA in Btn2a2−/− (KO) and WT mice or in KO→WT and WT→KO chimeras. (Top left) Mean clinical scores, disease incidence, and maximum scores are shown as shading highlighting time points analyzed in B and C. (B) Maximum disease scores and SC-infiltrating cells (total cells, CD4+ T cells, and MOG-specific IFN-γ+, IL-17+, or Foxp3+ CD4+ T cells) were quantified by flow cytometry in WT and Btn2a2−/− mice at disease onset and peak disease. (C) Ratios between SC-infiltrating Th1 or Th17 cells and Treg cells were determined at peak disease in WT and Btn2a2−/− mice. (A–C) Results are pooled from two experiments, each with five mice per group. (D) IFN-γ+, IL-17+, and Ki67+Foxp3+ CD4+ T cells were quantified by flow cytometry in LN cells harvested at pre-onset, onset, and peak disease. Results are derived from three experiments, each with six mice per group. (E) Serum anti-DNA Ab titers were measured by ELISA in age-matched 1-yr-old Btn2a2−/− and WT mice. A representative of two experiments is shown, each with eight mice per group. *, P < 0.05; **, P < 0.01; ***, P < 0.001; ns, not significant. Error bars are standard deviation of the mean.
Figure 4.
Figure 4.
Impaired tumor growth in Btn2a2−/− mice. (A) B16-OVA tumor growth was assessed in OVA-immunized WT and Btn2a2−/− mice. (B) Tumor-infiltrating conventional DCs and CD4+IFN-γ+, CD8+IFN-γ+, CD4+IFN-γ+IL-17+, CD4+IL-17+, and CD4+Foxp3+ T cells were quantified by flow cytometry. Results are pooled from two experiments, each with six mice per group, and expressed relative to WT. *, P < 0.05; **, P < 0.01; ***, P < 0.001; ****, P < 0.0001; ns, not significant. Error bars are standard deviation of the mean.

References

    1. Afrache H., Gouret P., Ainouche S., Pontarotti P., and Olive D.. 2012. The butyrophilin (BTN) gene family: from milk fat to the regulation of the immune response. Immunogenetics. 64:781–794. 10.1007/s00251-012-0619-z - DOI - PubMed
    1. Ammann J.U., Cooke A., and Trowsdale J.. 2013. Butyrophilin Btn2a2 inhibits TCR activation and phosphatidylinositol 3-kinase/Akt pathway signaling and induces Foxp3 expression in T lymphocytes. J. Immunol. 190:5030–5036. 10.4049/jimmunol.1203325 - DOI - PMC - PubMed
    1. Arnett H.A., and Viney J.L.. 2014. Immune modulation by butyrophilins. Nat. Rev. Immunol. 14:559–569. 10.1038/nri3715 - DOI - PubMed
    1. Arnett H.A., Escobar S.S., Gonzalez-Suarez E., Budelsky A.L., Steffen L.A., Boiani N., Zhang M., Siu G., Brewer A.W., and Viney J.L.. 2007. BTNL2, a butyrophilin/B7-like molecule, is a negative costimulatory molecule modulated in intestinal inflammation. J. Immunol. 178:1523–1533. 10.4049/jimmunol.178.3.1523 - DOI - PubMed
    1. Azijli K., Stelloo E., Peters G.J., and VAN DEN Eertwegh A.J.. 2014. New developments in the treatment of metastatic melanoma: immune checkpoint inhibitors and targeted therapies. Anticancer Res. 34:1493–1505. - PubMed

Publication types

MeSH terms