

17α-Estradiol Alleviates Age-related Metabolic and Inflammatory Dysfunction in Male Mice Without Inducing Feminization
- PMID: 26809497
- PMCID: PMC5155656
- DOI: 10.1093/gerona/glv309
17α-Estradiol Alleviates Age-related Metabolic and Inflammatory Dysfunction in Male Mice Without Inducing Feminization
Abstract
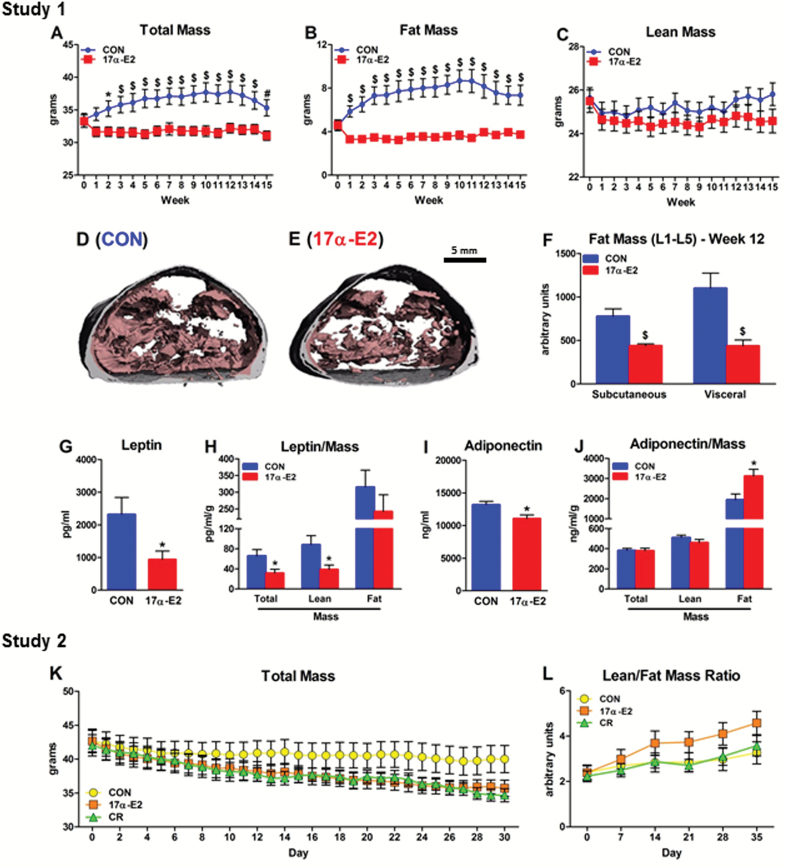
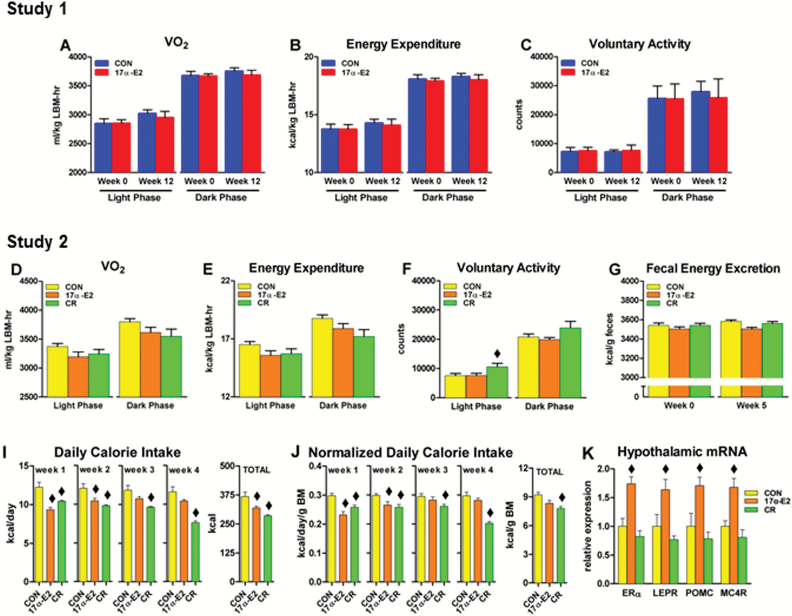
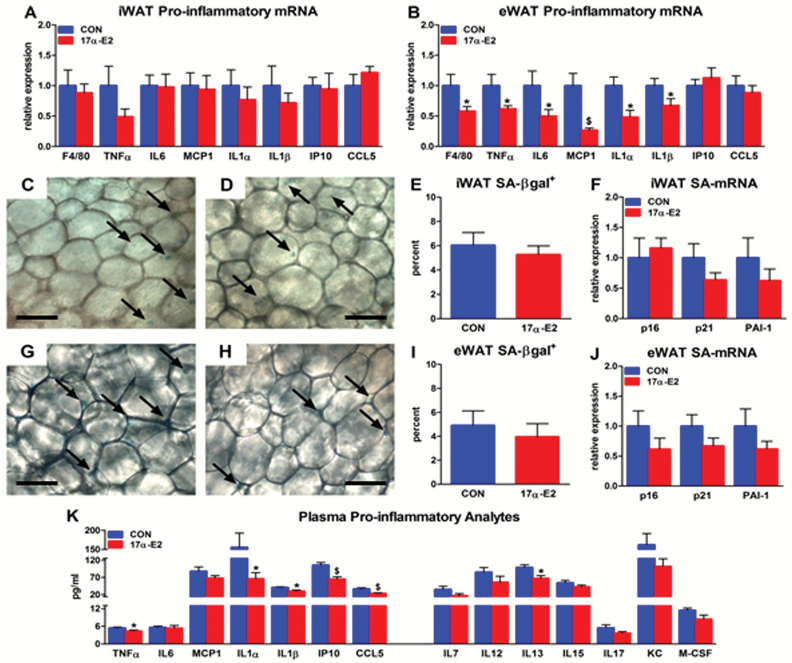
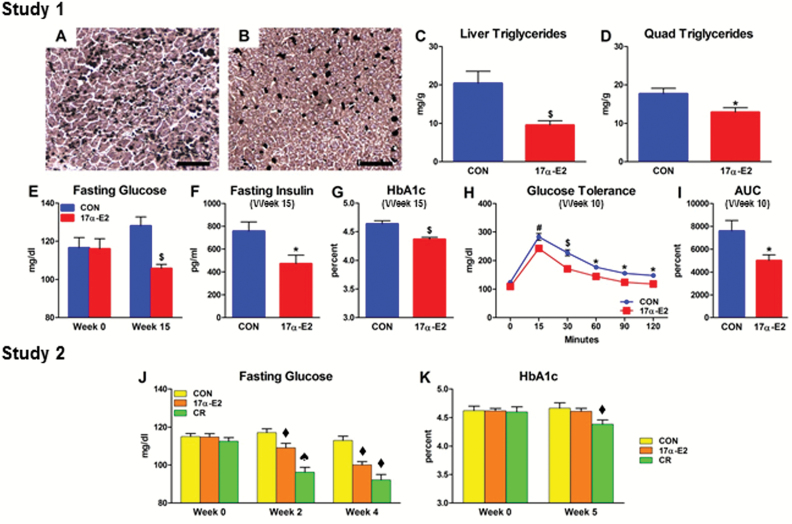
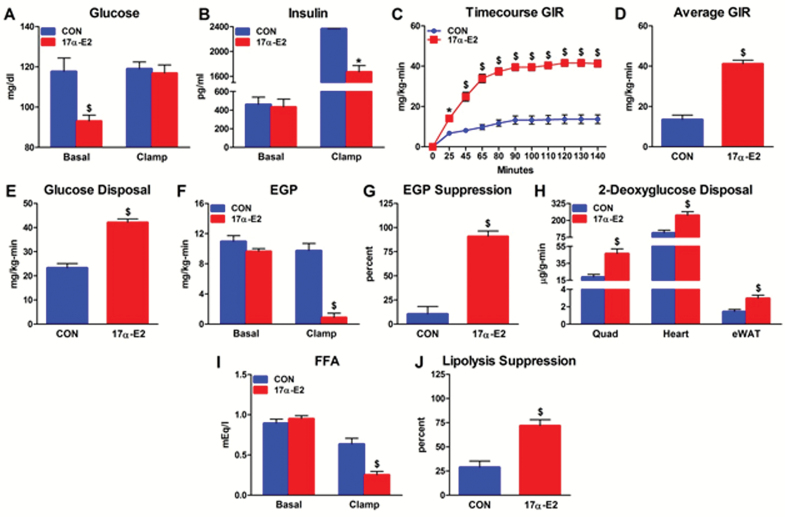
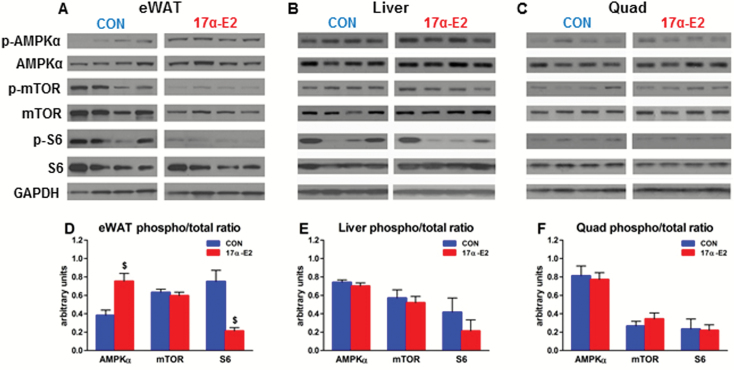
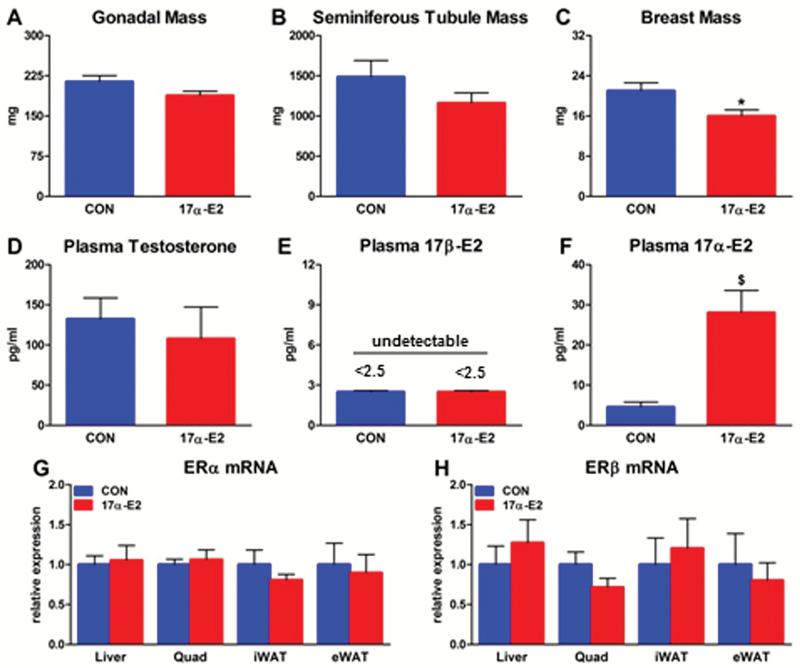
Aging is associated with visceral adiposity, metabolic disorders, and chronic low-grade inflammation. 17α-estradiol (17α-E2), a naturally occurring enantiomer of 17β-estradiol (17β-E2), extends life span in male mice through unresolved mechanisms. We tested whether 17α-E2 could alleviate age-related metabolic dysfunction and inflammation. 17α-E2 reduced body mass, visceral adiposity, and ectopic lipid deposition without decreasing lean mass. These declines were associated with reductions in energy intake due to the activation of hypothalamic anorexigenic pathways and direct effects of 17α-E2 on nutrient-sensing pathways in visceral adipose tissue. 17α-E2 did not alter energy expenditure or excretion. Fasting glucose, insulin, and glycosylated hemoglobin were also reduced by 17α-E2, and hyperinsulinemic-euglycemic clamps revealed improvements in peripheral glucose disposal and hepatic glucose production. Inflammatory mediators in visceral adipose tissue and the circulation were reduced by 17α-E2. 17α-E2 increased AMPKα and reduced mTOR complex 1 activity in visceral adipose tissue but not in liver or quadriceps muscle, which is in contrast to the generalized systemic effects of caloric restriction. These beneficial phenotypic changes occurred in the absence of feminization or cardiac dysfunction, two commonly observed deleterious effects of exogenous estrogen administration. Thus, 17α-E2 holds potential as a novel therapeutic for alleviating age-related metabolic dysfunction through tissue-specific effects.
Keywords: 17α-Estradiol; Adipose tissue; Hypothalamus; Inflammation; Metabolism.
© The Author 2016. Published by Oxford University Press on behalf of The Gerontological Society of America.
Figures
Comment in
-
17α-Estradiol: A Novel Therapeutic Intervention to Target Age-related Chronic Inflammation.J Gerontol A Biol Sci Med Sci. 2017 Jan;72(1):1-2. doi: 10.1093/gerona/glw041. Epub 2016 Mar 31. J Gerontol A Biol Sci Med Sci. 2017. PMID: 27034507 No abstract available.
Similar articles
-
17α-Estradiol alleviates high-fat diet-induced inflammatory and metabolic dysfunction in skeletal muscle of male and female mice.Am J Physiol Endocrinol Metab. 2024 Mar 1;326(3):E226-E244. doi: 10.1152/ajpendo.00215.2023. Epub 2024 Jan 10. Am J Physiol Endocrinol Metab. 2024. PMID: 38197793 Free PMC article.
-
17α-Estradiol Modulates IGF1 and Hepatic Gene Expression in a Sex-Specific Manner.J Gerontol A Biol Sci Med Sci. 2021 Apr 30;76(5):778-785. doi: 10.1093/gerona/glaa215. J Gerontol A Biol Sci Med Sci. 2021. PMID: 32857104 Free PMC article.
-
Estrogen treatment after ovariectomy protects against fatty liver and may improve pathway-selective insulin resistance.Diabetes. 2013 Feb;62(2):424-34. doi: 10.2337/db11-1718. Epub 2012 Sep 10. Diabetes. 2013. PMID: 22966069 Free PMC article.
-
Assessing tolerability and physiological responses to 17α-estradiol administration in male rhesus macaques.Geroscience. 2023 Aug;45(4):2337-2349. doi: 10.1007/s11357-023-00767-9. Epub 2023 Mar 10. Geroscience. 2023. PMID: 36897526 Free PMC article.
-
Visceral adiposity and inflammatory bowel disease.Int J Colorectal Dis. 2021 Nov;36(11):2305-2319. doi: 10.1007/s00384-021-03968-w. Epub 2021 Jun 9. Int J Colorectal Dis. 2021. PMID: 34104989 Review.
Cited by
-
Cellular Senescence: A Translational Perspective.EBioMedicine. 2017 Jul;21:21-28. doi: 10.1016/j.ebiom.2017.04.013. Epub 2017 Apr 12. EBioMedicine. 2017. PMID: 28416161 Free PMC article. Review.
-
Ablation of skeletal muscle estrogen receptor alpha impairs contractility in male mice.J Appl Physiol (1985). 2024 Apr 1;136(4):764-773. doi: 10.1152/japplphysiol.00714.2023. Epub 2024 Feb 8. J Appl Physiol (1985). 2024. PMID: 38328824 Free PMC article.
-
Chronic β3 adrenergic agonist treatment improves neurovascular coupling responses, attenuates blood-brain barrier leakage and neuroinflammation, and enhances cognition in aged mice.Aging (Albany NY). 2025 Feb 19;17(2):448-463. doi: 10.18632/aging.206203. Epub 2025 Feb 19. Aging (Albany NY). 2025. PMID: 39976587 Free PMC article.
-
Frailty and HIV: Moving from Characterization to Intervention.Curr HIV/AIDS Rep. 2021 Jun;18(3):157-175. doi: 10.1007/s11904-021-00554-1. Epub 2021 Apr 5. Curr HIV/AIDS Rep. 2021. PMID: 33817767 Free PMC article. Review.
-
Negative effects of lifespan extending intervention on resilience in mice.PLoS One. 2024 Nov 21;19(11):e0312440. doi: 10.1371/journal.pone.0312440. eCollection 2024. PLoS One. 2024. PMID: 39570905 Free PMC article.
References
-
- Salminen A, Kaarniranta K. AMP-activated protein kinase (AMPK) controls the aging process via an integrated signaling network. Ageing Res Rev. 2012;11:230–241. doi:10.1016/j.arr.2011.12.005 - PubMed
Publication types
MeSH terms
Substances
Grants and funding
LinkOut - more resources
Full Text Sources
Other Literature Sources
Medical
Molecular Biology Databases
Miscellaneous
