Emergence and evolution of yeast prion and prion-like proteins
- PMID: 26809710
- PMCID: PMC4727409
- DOI: 10.1186/s12862-016-0594-3
Emergence and evolution of yeast prion and prion-like proteins
Abstract
Background: Prions are transmissible, propagating alternative states of proteins, and are usually made from the fibrillar, beta-sheet-rich assemblies termed amyloid. Prions in the budding yeast Saccharomyces cerevisiae propagate heritable phenotypes, uncover hidden genetic variation, function in large-scale gene regulation, and can act like diseases. Almost all these amyloid prions have asparagine/glutamine-rich (N/Q-rich) domains. Other proteins, that we term here 'prionogenic amyloid formers' (PAFs), have been shown to form amyloid in vivo, and to have N/Q-rich domains that can propagate heritable states in yeast cells. Also, there are >200 other S.cerevisiae proteins with prion-like N/Q-rich sequence composition. Furthermore, human proteins with such N/Q-rich composition have been linked to the pathomechanisms of neurodegenerative amyloid diseases.
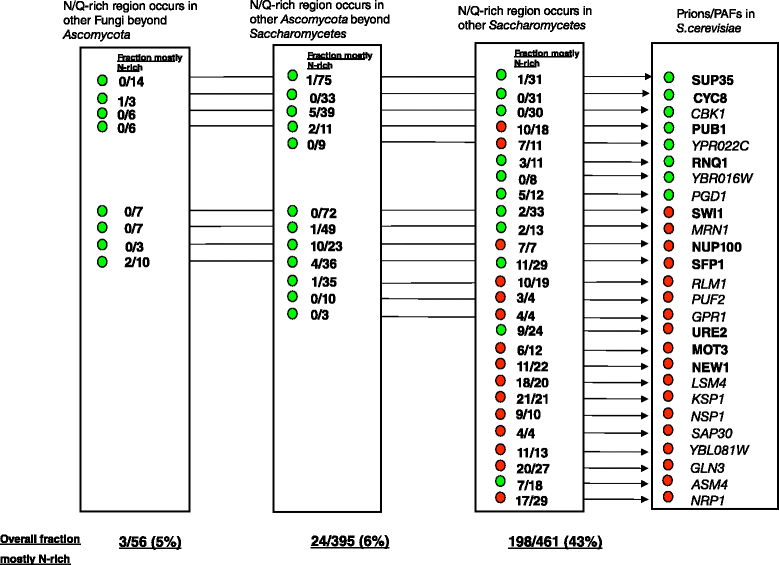
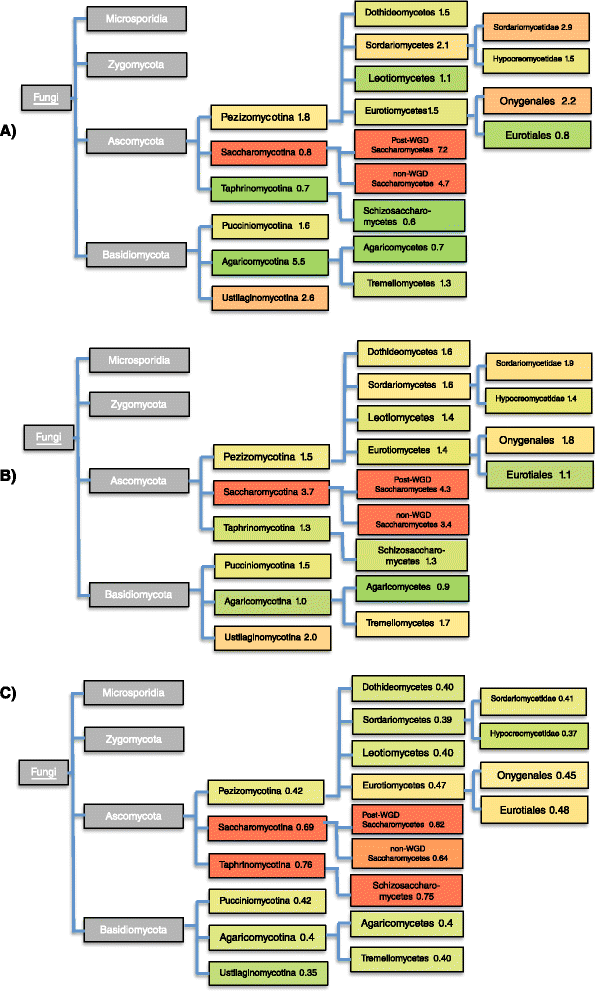
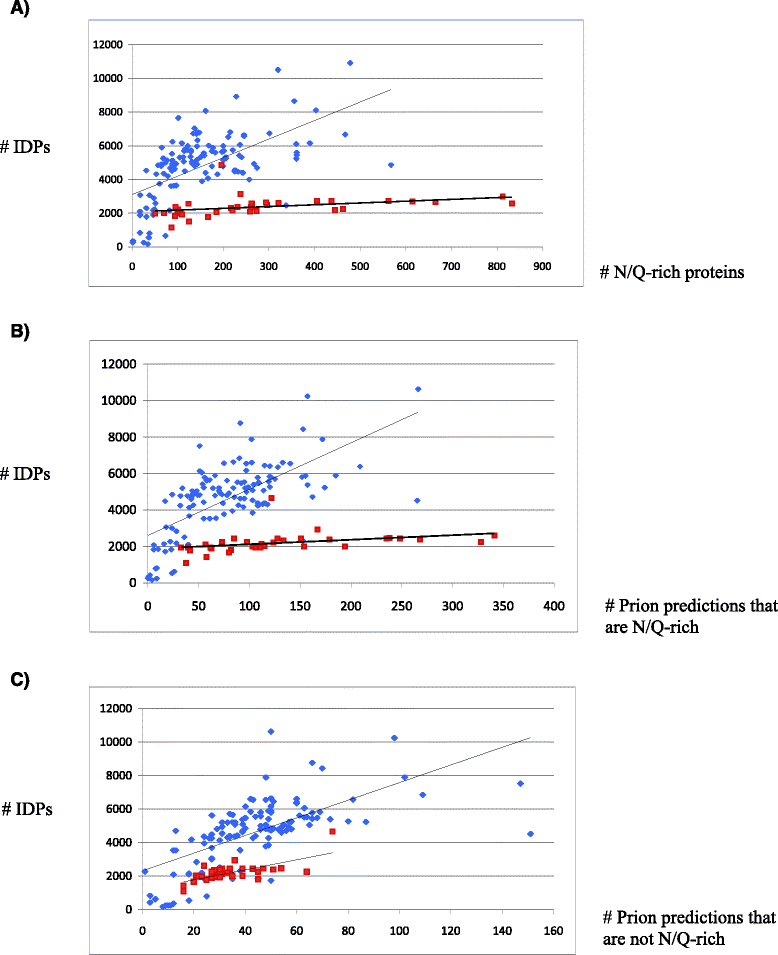
Results: Here, we exploit the increasing abundance of complete fungal genomes to examine the ancestry of prions/PAFs and other N/Q-rich proteins across the fungal kingdom. We find distinct evolutionary behavior for Q-rich and N-rich prions/PAFs; those of ancient ancestry (outside the budding yeasts, Saccharomycetes) are Q-rich, whereas N-rich cases arose early in Saccharomycetes evolution. This emergence of N-rich prion/PAFs is linked to a large-scale emergence of N-rich proteins during Saccharomycetes evolution, with Saccharomycetes showing a distinctive trend for population sizes of prion-like proteins that sets them apart from all the other fungi. Conversely, some clades, e.g. Eurotiales, have much fewer N/Q-rich proteins, and in some cases likely lose them en masse, perhaps due to greater amyloid intolerance, although they contain relatively more non-N/Q-rich predicted prions. We find that recent mutational tendencies arising during Saccharomycetes evolution (i.e., increased numbers of N residues and a tendency to form more poly-N tracts), contributed to the expansion/development of the prion phenomenon. Variation in these mutational tendencies in Saccharomycetes is correlated with the population sizes of prion-like proteins, thus implying that selection pressures on N/Q-rich protein sequences against amyloidogenesis are not generally maintained in budding yeasts.
Conclusions: These results help to delineate further the limits and origins of N/Q-rich prions, and provide insight as a case study of the evolution of compositionally-defined protein domains.
Figures


Similar articles
-
Interaction networks of prion, prionogenic and prion-like proteins in budding yeast, and their role in gene regulation.PLoS One. 2014 Jun 27;9(6):e100615. doi: 10.1371/journal.pone.0100615. eCollection 2014. PLoS One. 2014. PMID: 24972093 Free PMC article.
-
Could yeast prion domains originate from polyQ/N tracts?Prion. 2013 May-Jun;7(3):209-14. doi: 10.4161/pri.24628. Prion. 2013. PMID: 23764835 Free PMC article.
-
The evolutionary scope and neurological disease linkage of yeast-prion-like proteins in humans.Biol Direct. 2016 Jul 26;11:32. doi: 10.1186/s13062-016-0134-5. Biol Direct. 2016. PMID: 27457357 Free PMC article.
-
Yeast prions: structure, biology, and prion-handling systems.Microbiol Mol Biol Rev. 2015 Mar;79(1):1-17. doi: 10.1128/MMBR.00041-14. Microbiol Mol Biol Rev. 2015. PMID: 25631286 Free PMC article. Review.
-
Yeast prions assembly and propagation: contributions of the prion and non-prion moieties and the nature of assemblies.Prion. 2011 Oct-Dec;5(4):277-84. doi: 10.4161/pri.18070. Epub 2011 Oct 1. Prion. 2011. PMID: 22052349 Free PMC article. Review.
Cited by
-
Optimizing strategy for the discovery of compositionally-biased or low-complexity regions in proteins.Sci Rep. 2024 Jan 5;14(1):680. doi: 10.1038/s41598-023-50991-8. Sci Rep. 2024. PMID: 38182699 Free PMC article.
-
Evolutionary behaviour of bacterial prion-like proteins.PLoS One. 2019 Mar 5;14(3):e0213030. doi: 10.1371/journal.pone.0213030. eCollection 2019. PLoS One. 2019. PMID: 30835736 Free PMC article.
-
Regulation of sub-compartmental targeting and folding properties of the Prion-like protein Shadoo.Sci Rep. 2017 Jun 16;7(1):3731. doi: 10.1038/s41598-017-03969-2. Sci Rep. 2017. PMID: 28623368 Free PMC article.
-
Amyloidogenic Propensities of Ribosomal S1 Proteins: Bioinformatics Screening and Experimental Checking.Int J Mol Sci. 2020 Jul 22;21(15):5199. doi: 10.3390/ijms21155199. Int J Mol Sci. 2020. PMID: 32707977 Free PMC article.
-
Conservation of Prion-Like Composition and Sequence in Prion-Formers and Prion-Like Proteins of Saccharomyces cerevisiae.Front Mol Biosci. 2019 Jul 11;6:54. doi: 10.3389/fmolb.2019.00054. eCollection 2019. Front Mol Biosci. 2019. PMID: 31355208 Free PMC article.
References
-
- Cox B. [PSI], a cytoplasmic suppressor of super-suppression in yeast. Heredity. 1965;20:505–21. doi: 10.1038/hdy.1965.65. - DOI
Publication types
MeSH terms
Substances
LinkOut - more resources
Full Text Sources
Other Literature Sources
Molecular Biology Databases
Research Materials

