

Variability in the chemistry of private drinking water supplies and the impact of domestic treatment systems on water quality
- PMID: 26810082
- PMCID: PMC5095163
- DOI: 10.1007/s10653-016-9798-0
Variability in the chemistry of private drinking water supplies and the impact of domestic treatment systems on water quality
Abstract
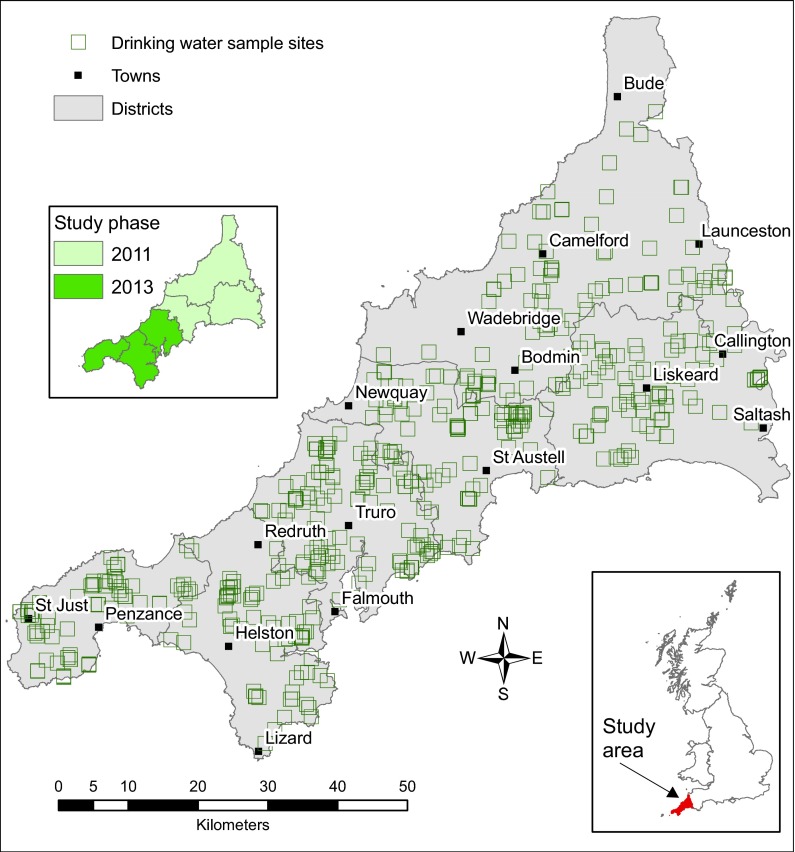
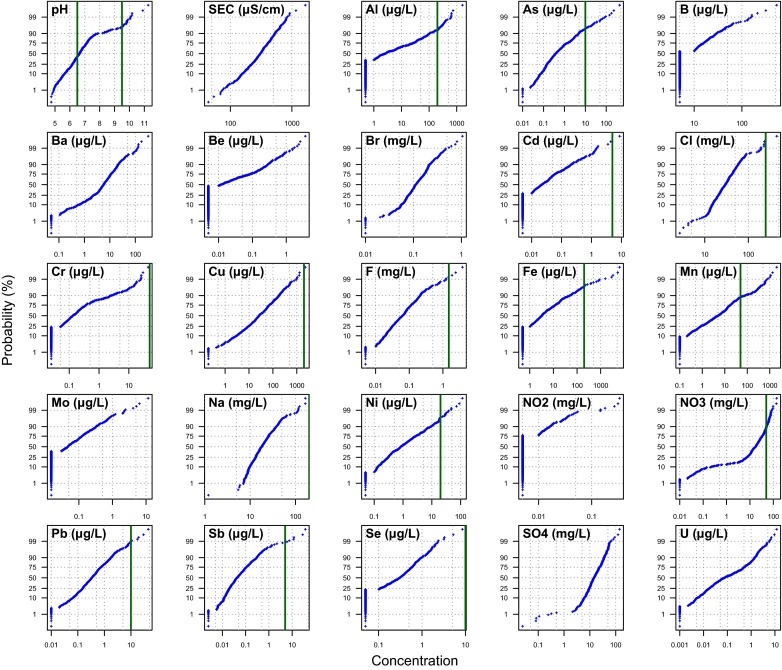
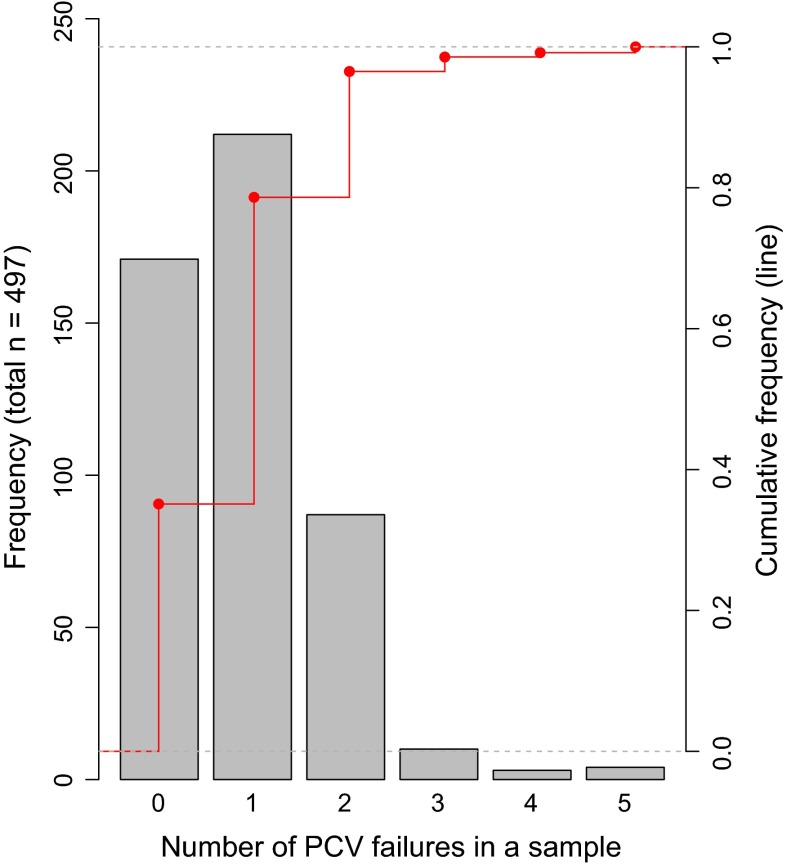
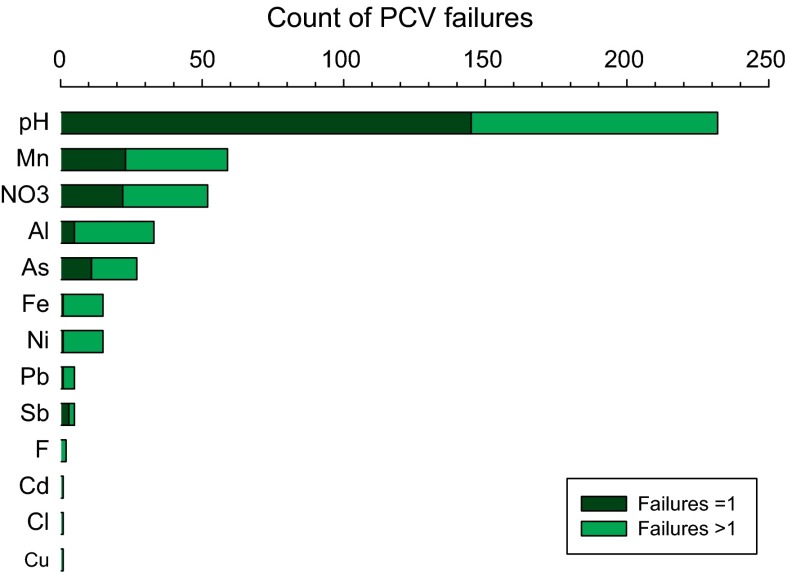
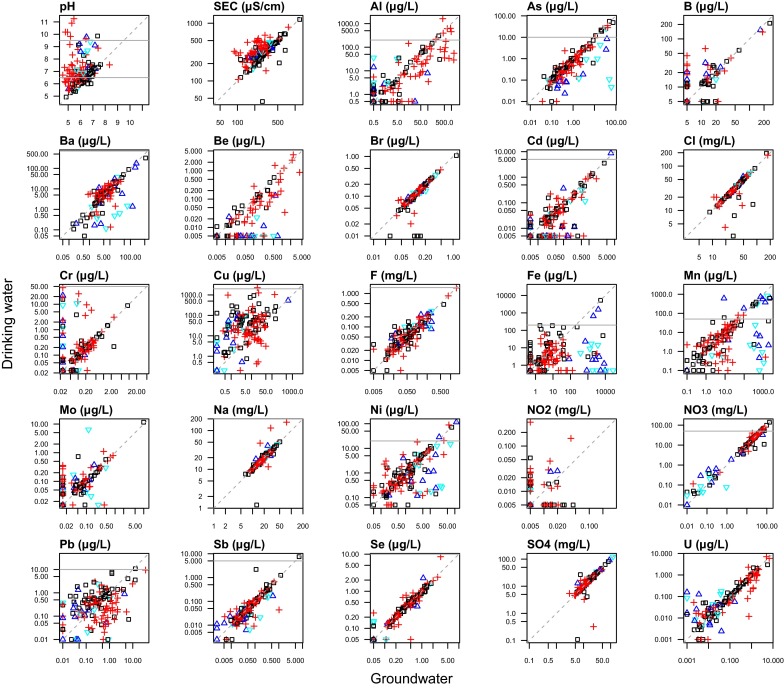
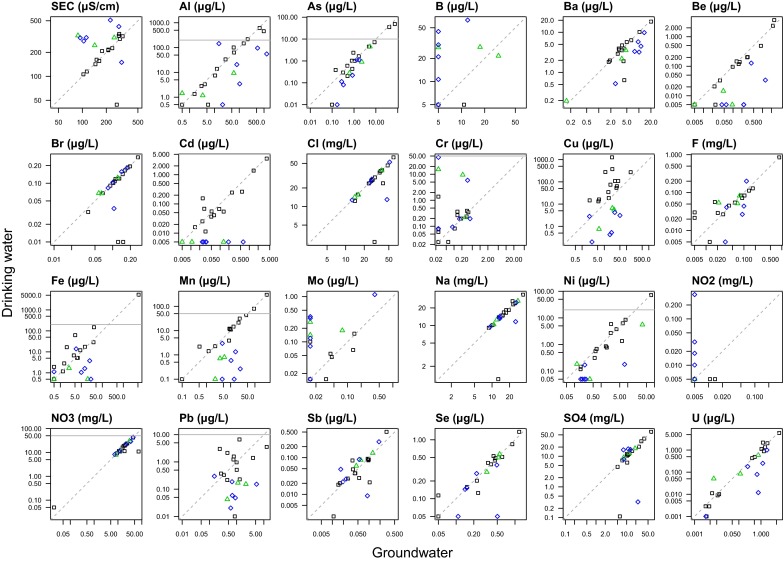
Tap water from 497 properties using private water supplies, in an area of metalliferous and arsenic mineralisation (Cornwall, UK), was measured to assess the extent of compliance with chemical drinking water quality standards, and how this is influenced by householder water treatment decisions. The proportion of analyses exceeding water quality standards were high, with 65 % of tap water samples exceeding one or more chemical standards. The highest exceedances for health-based standards were nitrate (11 %) and arsenic (5 %). Arsenic had a maximum observed concentration of 440 µg/L. Exceedances were also high for pH (47 %), manganese (12 %) and aluminium (7 %), for which standards are set primarily on aesthetic grounds. However, the highest observed concentrations of manganese and aluminium also exceeded relevant health-based guidelines. Significant reductions in concentrations of aluminium, cadmium, copper, lead and/or nickel were found in tap waters where households were successfully treating low-pH groundwaters, and similar adventitious results were found for arsenic and nickel where treatment was installed for iron and/or manganese removal, and successful treatment specifically to decrease tap water arsenic concentrations was observed at two properties where it was installed. However, 31 % of samples where pH treatment was reported had pH < 6.5 (the minimum value in the drinking water regulations), suggesting widespread problems with system maintenance. Other examples of ineffectual treatment are seen in failed responses post-treatment, including for nitrate. This demonstrates that even where the tap waters are considered to be treated, they may still fail one or more drinking water quality standards. We find that the degree of drinking water standard exceedances warrant further work to understand environmental controls and the location of high concentrations. We also found that residents were more willing to accept drinking water with high metal (iron and manganese) concentrations than international guidelines assume. These findings point to the need for regulators to reinforce the guidance on drinking water quality standards to private water supply users, and the benefits to long-term health of complying with these, even in areas where treated mains water is widely available.
Keywords: Arsenic; Manganese; Point-of-entry treatment; Public health; Water quality standards.
Figures
Similar articles
-
Naturally occurring metals in unregulated domestic wells in Nevada, USA.Sci Total Environ. 2022 Dec 10;851(Pt 2):158277. doi: 10.1016/j.scitotenv.2022.158277. Epub 2022 Aug 24. Sci Total Environ. 2022. PMID: 36029812 Free PMC article.
-
Water Quality Index for measuring drinking water quality in rural Bangladesh: a cross-sectional study.J Health Popul Nutr. 2016 Feb 9;35:4. doi: 10.1186/s41043-016-0041-5. J Health Popul Nutr. 2016. PMID: 26860541 Free PMC article.
-
Arsenic speciation and uranium concentrations in drinking water supply wells in Northern Greece: correlations with redox indicative parameters and implications for groundwater treatment.Sci Total Environ. 2007 Sep 20;383(1-3):128-40. doi: 10.1016/j.scitotenv.2007.04.035. Epub 2007 Jun 13. Sci Total Environ. 2007. PMID: 17570466
-
The Arsenic Contamination of Drinking and Groundwaters in Bangladesh: Featuring Biogeochemical Aspects and Implications on Public Health.Arch Environ Contam Toxicol. 2018 Jul;75(1):1-7. doi: 10.1007/s00244-018-0511-4. Epub 2018 Mar 8. Arch Environ Contam Toxicol. 2018. PMID: 29520432 Free PMC article. Review.
-
Arsenic in private drinking water wells: an assessment of jurisdictional regulations and guidelines for risk remediation in North America.J Water Health. 2014 Sep;12(3):372-92. doi: 10.2166/wh.2014.054. J Water Health. 2014. PMID: 25252340 Review.
Cited by
-
Urinary arsenic profiles reveal exposures to inorganic arsenic from private drinking water supplies in Cornwall, UK.Sci Rep. 2016 May 9;6:25656. doi: 10.1038/srep25656. Sci Rep. 2016. PMID: 27156998 Free PMC article.
-
Community Engaged Cumulative Risk Assessment of Exposure to Inorganic Well Water Contaminants, Crow Reservation, Montana.Int J Environ Res Public Health. 2018 Jan 5;15(1):76. doi: 10.3390/ijerph15010076. Int J Environ Res Public Health. 2018. PMID: 29304032 Free PMC article.
-
Spatial clustering of metal and metalloid mixtures in unregulated water sources on the Navajo Nation - Arizona, New Mexico, and Utah, USA.Sci Total Environ. 2018 Aug 15;633:1667-1678. doi: 10.1016/j.scitotenv.2018.02.288. Epub 2018 Apr 15. Sci Total Environ. 2018. PMID: 29669690 Free PMC article.
-
Hazard Ranking Method for Populations Exposed to Arsenic in Private Water Supplies: Relation to Bedrock Geology.Int J Environ Res Public Health. 2017 Dec 1;14(12):1490. doi: 10.3390/ijerph14121490. Int J Environ Res Public Health. 2017. PMID: 29194429 Free PMC article.
-
Estimation of the proximity of private domestic wells to underground storage tanks: Oklahoma pilot study.Sci Total Environ. 2017 Dec 31;609:1589-1599. doi: 10.1016/j.scitotenv.2017.06.124. Epub 2017 Aug 8. Sci Total Environ. 2017. PMID: 28810511 Free PMC article.
References
-
- Abrahams PW, Thornton I. The contamination of agricultural land in the metalliferous province of southwest England: Implications to livestock. Agriculture, Ecosystems and Environment. 1994;48(2):125–137. doi: 10.1016/0167-8809(94)90083-3. - DOI
-
- Aston SR, Thornton I, Webb JS, Milford BL, Purves JB. Arsenic in stream sediments and waters of south west England. Science of the Total Environment. 1975;4(4):347–358. doi: 10.1016/0048-9697(75)90026-1. - DOI
-
- Ayotte JD, Belaval M, Olson SA, Burow KR, Flanagan SM, Hinkle SR, Lindsey BD. Factors affecting temporal variability of arsenic in groundwater used for drinking water supply in the United States. Science of the Total Environment. 2015;505:1370–1379. doi: 10.1016/j.scitotenv.2014.02.057. - DOI - PubMed
MeSH terms
Substances
LinkOut - more resources
Full Text Sources
Other Literature Sources
Medical
Miscellaneous
