

Interplay between Target Sequences and Repair Pathways Determines Distinct Outcomes of AID-Initiated Lesions
- PMID: 26810227
- PMCID: PMC4760233
- DOI: 10.4049/jimmunol.1502184
Interplay between Target Sequences and Repair Pathways Determines Distinct Outcomes of AID-Initiated Lesions
Abstract
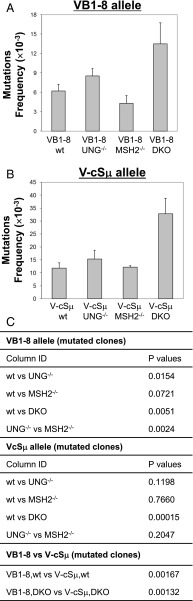
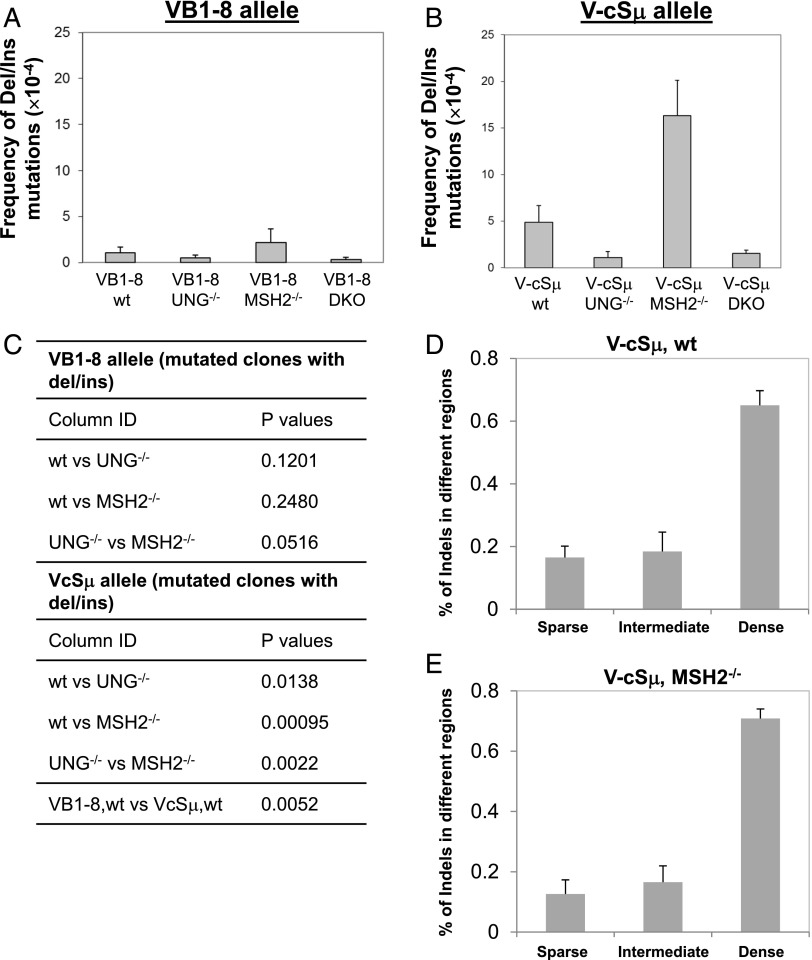
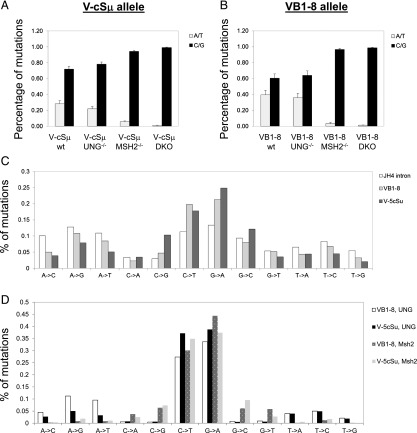
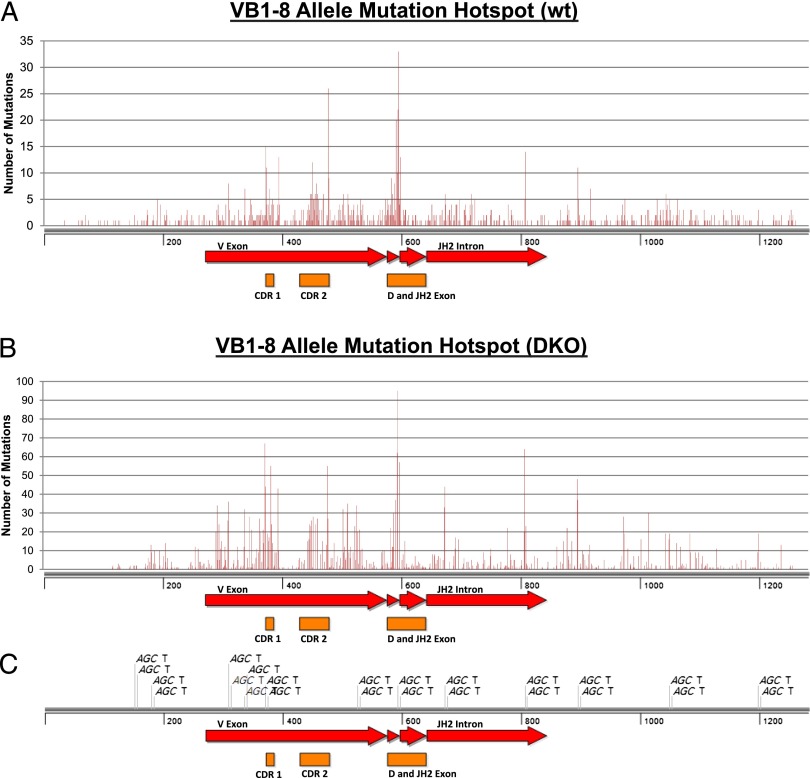
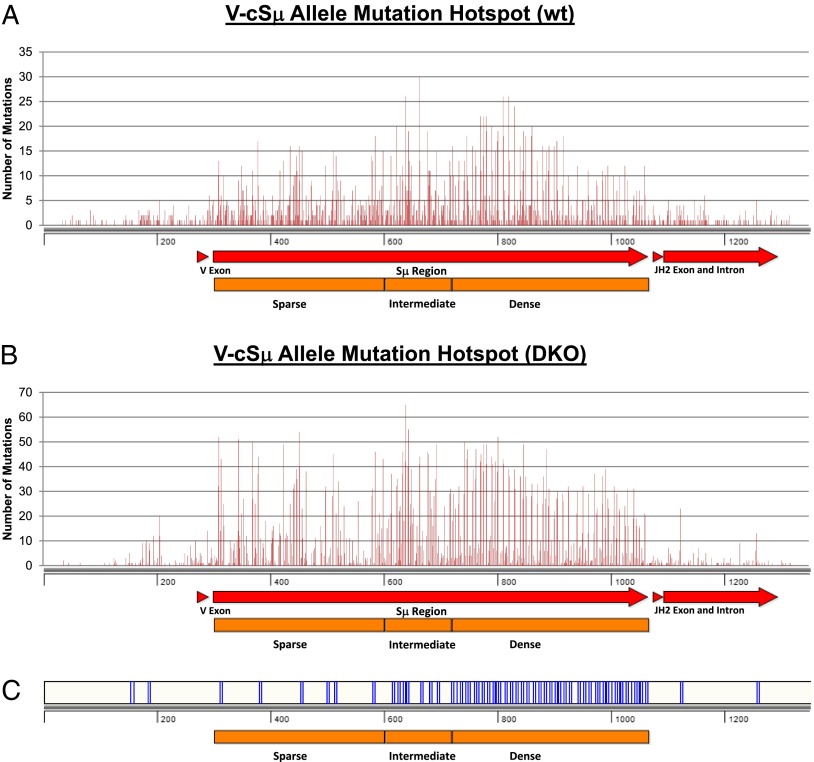
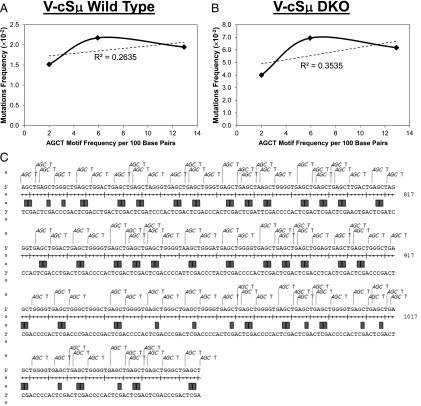
Activation-induced deaminase (AID) functions by deaminating cytosines and causing U:G mismatches, a rate-limiting step of Ab gene diversification. However, precise mechanisms regulating AID deamination frequency remain incompletely understood. Moreover, it is not known whether different sequence contexts influence the preferential access of mismatch repair or uracil glycosylase (UNG) to AID-initiated U:G mismatches. In this study, we employed two knock-in models to directly compare the mutability of core Sμ and VDJ exon sequences and their ability to regulate AID deamination and subsequent repair process. We find that the switch (S) region is a much more efficient AID deamination target than the V region. Igh locus AID-initiated lesions are processed by error-free and error-prone repair. S region U:G mismatches are preferentially accessed by UNG, leading to more UNG-dependent deletions, enhanced by mismatch repair deficiency. V region mutation hotspots are largely determined by AID deamination. Recurrent and conserved S region motifs potentially function as spacers between AID deamination hotspots. We conclude that the pattern of mutation hotspots and DNA break generation is influenced by sequence-intrinsic properties, which regulate AID deamination and affect the preferential access of downstream repair. Our studies reveal an evolutionarily conserved role for substrate sequences in regulating Ab gene diversity and AID targeting specificity.
Copyright © 2016 by The American Association of Immunologists, Inc.
Figures

Similar articles
-
The in vivo pattern of AID targeting to immunoglobulin switch regions deduced from mutation spectra in msh2-/- ung-/- mice.J Exp Med. 2006 Sep 4;203(9):2085-94. doi: 10.1084/jem.20061067. Epub 2006 Aug 7. J Exp Med. 2006. PMID: 16894013 Free PMC article.
-
AID-associated DNA repair pathways regulate malignant transformation in a murine model of BCL6-driven diffuse large B-cell lymphoma.Blood. 2016 Jan 7;127(1):102-12. doi: 10.1182/blood-2015-02-628164. Epub 2015 Sep 18. Blood. 2016. PMID: 26385350 Free PMC article.
-
Analysis of Ig gene hypermutation in Ung(-/-)Polh(-/-) mice suggests that UNG and A:T mutagenesis pathway target different U:G lesions.Mol Immunol. 2013 Mar;53(3):214-7. doi: 10.1016/j.molimm.2012.08.009. Epub 2012 Sep 4. Mol Immunol. 2013. PMID: 22960197
-
Mismatch-mediated error prone repair at the immunoglobulin genes.Biomed Pharmacother. 2011 Dec;65(8):529-36. doi: 10.1016/j.biopha.2011.09.001. Epub 2011 Oct 24. Biomed Pharmacother. 2011. PMID: 22100214 Free PMC article. Review.
-
Error-free versus mutagenic processing of genomic uracil--relevance to cancer.DNA Repair (Amst). 2014 Jul;19:38-47. doi: 10.1016/j.dnarep.2014.03.028. Epub 2014 Apr 18. DNA Repair (Amst). 2014. PMID: 24746924 Review.
Cited by
-
The Number of Overlapping AID Hotspots in Germline IGHV Genes Is Inversely Correlated with Mutation Frequency in Chronic Lymphocytic Leukemia.PLoS One. 2017 Jan 26;12(1):e0167602. doi: 10.1371/journal.pone.0167602. eCollection 2017. PLoS One. 2017. PMID: 28125682 Free PMC article.
-
Proximity to AGCT sequences dictates MMR-independent versus MMR-dependent mechanisms for AID-induced mutation via UNG2.Nucleic Acids Res. 2017 Apr 7;45(6):3146-3157. doi: 10.1093/nar/gkw1300. Nucleic Acids Res. 2017. PMID: 28039326 Free PMC article.
-
Signaling control of antibody isotype switching.Adv Immunol. 2019;141:105-164. doi: 10.1016/bs.ai.2019.01.001. Epub 2019 Feb 11. Adv Immunol. 2019. PMID: 30904131 Free PMC article. Review.
-
SAMHD1 enhances immunoglobulin hypermutation by promoting transversion mutation.Proc Natl Acad Sci U S A. 2018 May 8;115(19):4921-4926. doi: 10.1073/pnas.1719771115. Epub 2018 Apr 18. Proc Natl Acad Sci U S A. 2018. PMID: 29669924 Free PMC article.
References
-
- Kato L., Stanlie A., Begum N. A., Kobayashi M., Aida M., Honjo T. 2012. An evolutionary view of the mechanism for immune and genome diversity. J. Immunol. 188: 3559–3566. - PubMed
-
- Jacobs H., Bross L. 2001. Towards an understanding of somatic hypermutation. Curr. Opin. Immunol. 13: 208–218. - PubMed
-
- Di Noia J. M., Neuberger M. S. 2007. Molecular mechanisms of antibody somatic hypermutation. Annu. Rev. Biochem. 76: 1–22. - PubMed
-
- Hackney J. A., Misaghi S., Senger K., Garris C., Sun Y., Lorenzo M. N., Zarrin A. A. 2009. DNA targets of AID evolutionary link between antibody somatic hypermutation and class switch recombination. Adv. Immunol. 101: 163–189. - PubMed
-
- Chaudhuri J., Alt F. W. 2004. Class-switch recombination: interplay of transcription, DNA deamination and DNA repair. Nat. Rev. Immunol. 4: 541–552. - PubMed
Publication types
MeSH terms
Substances
Grants and funding
LinkOut - more resources
Full Text Sources
Other Literature Sources
