. 2016 Jan 25;5(1):e002746.
doi: 10.1161/JAHA.115.002746.

Novel Bloodless Potassium Determination Using a Signal-Processed Single-Lead ECG

Affiliations

Novel Bloodless Potassium Determination Using a Signal-Processed Single-Lead ECG

Zachi I Attia et al. J Am Heart Assoc. .

Abstract

Background: Hyper- and hypokalemia are clinically silent, common in patients with renal or cardiac disease, and are life threatening. A noninvasive, unobtrusive, blood-free method for tracking potassium would be an important clinical advance.

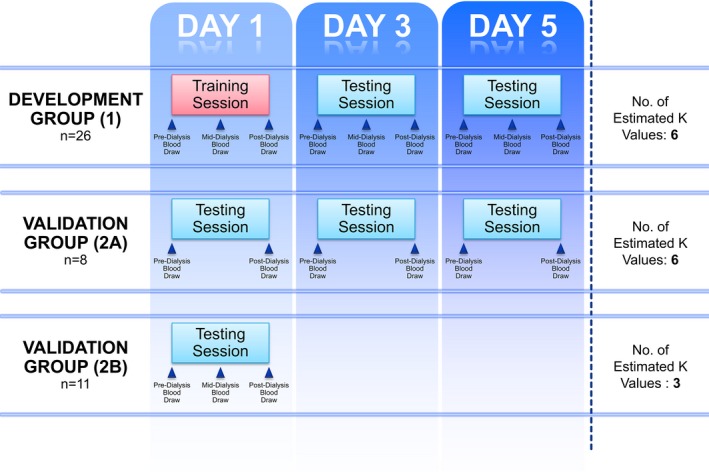
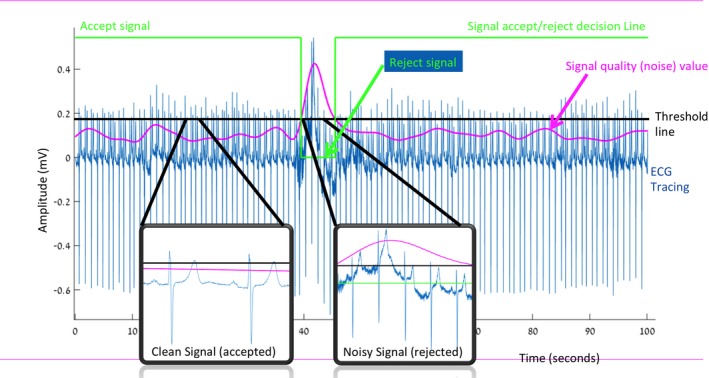
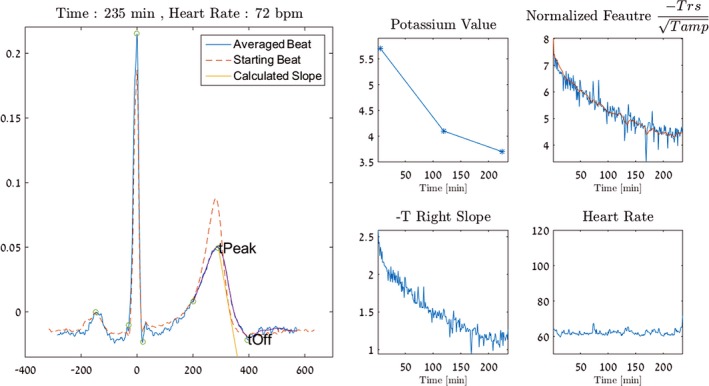
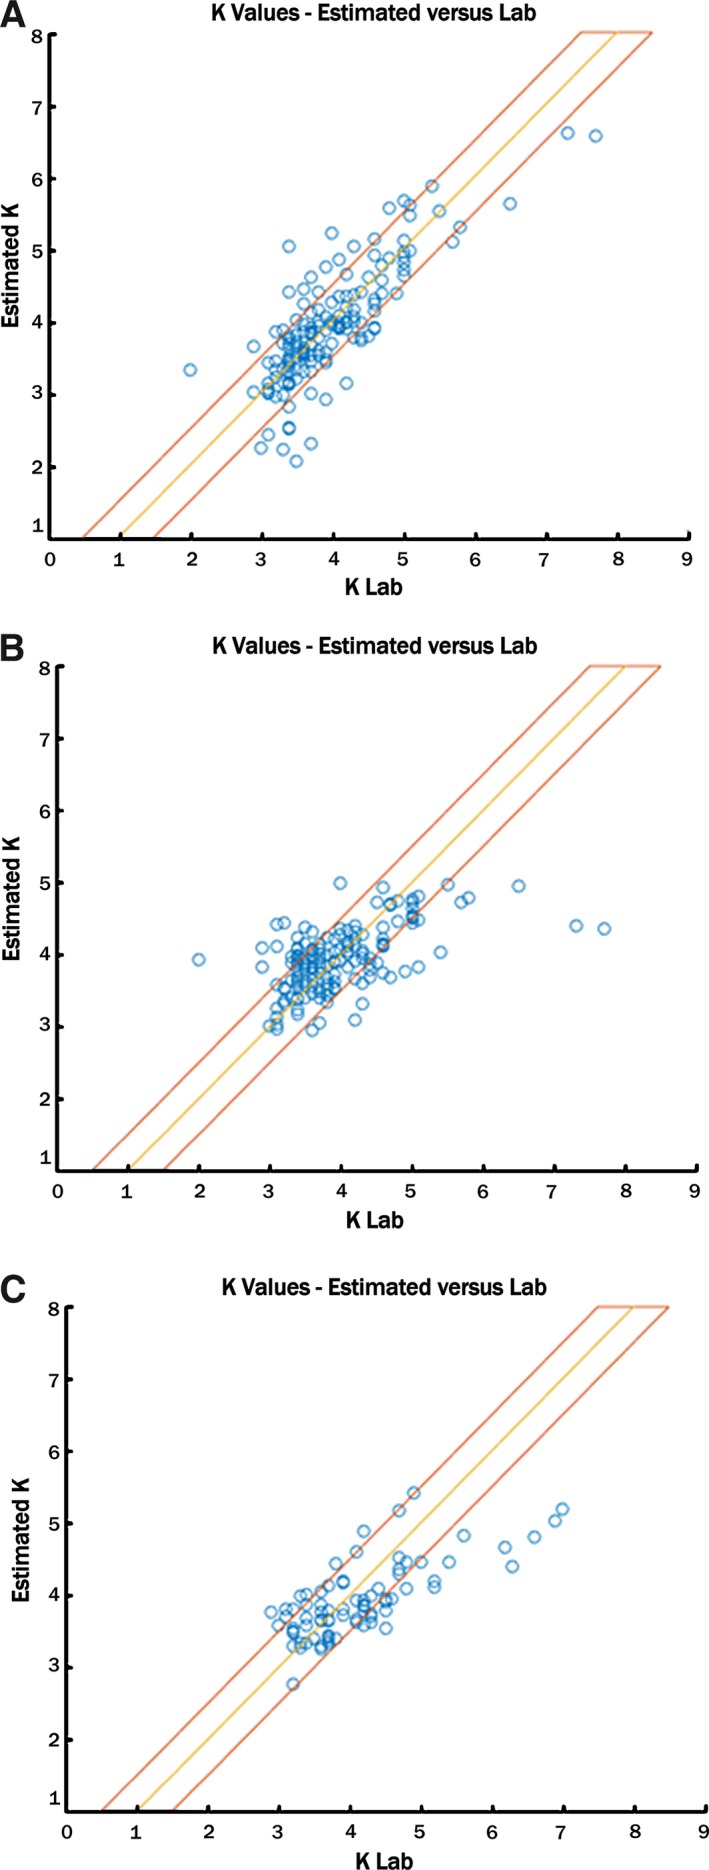
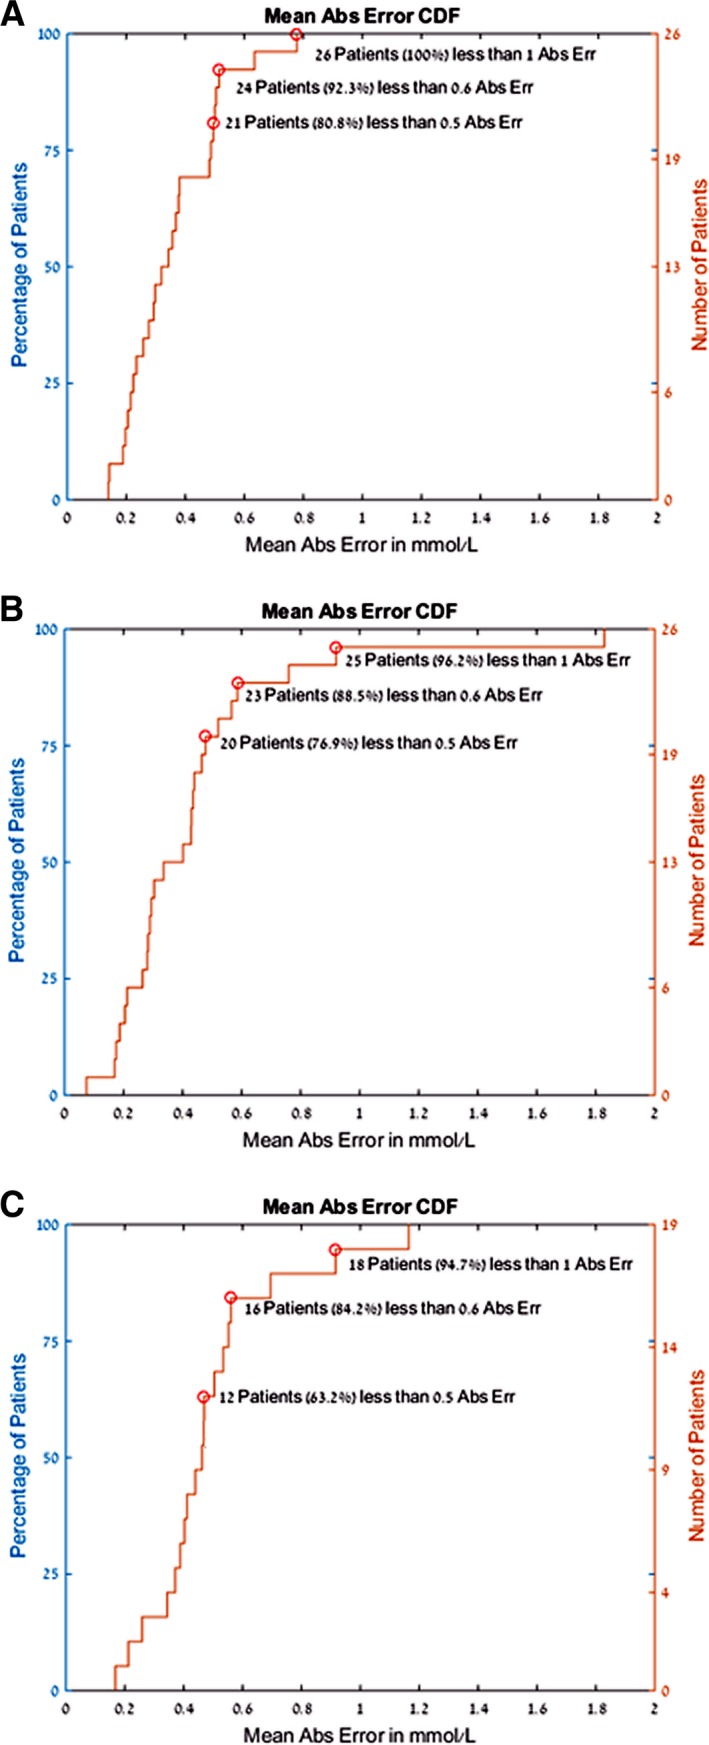
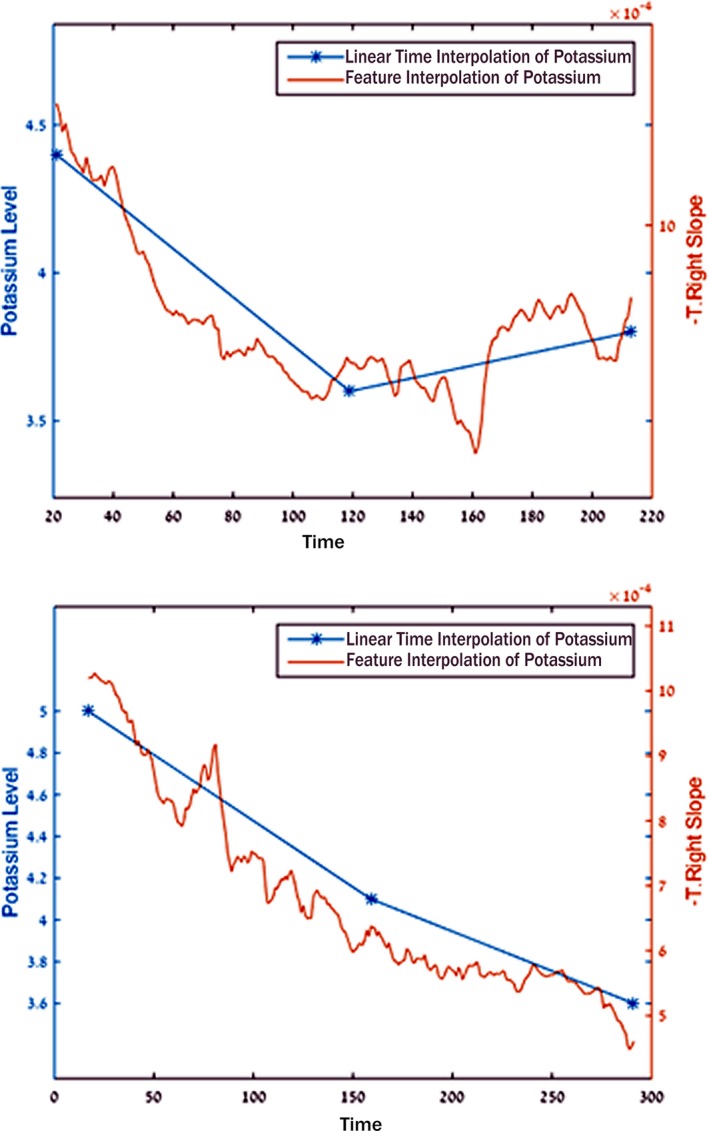
Methods and results: Two groups of hemodialysis patients (development group, n=26; validation group, n=19) underwent high-resolution digital ECG recordings and had 2 to 3 blood tests during dialysis. Using advanced signal processing, we developed a personalized regression model for each patient to noninvasively calculate potassium values during the second and third dialysis sessions using only the processed single-channel ECG. In addition, by analyzing the entire development group's first-visit data, we created a global model for all patients that was validated against subsequent sessions in the development group and in a separate validation group. This global model sought to predict potassium, based on the T wave characteristics, with no blood tests required. For the personalized model, we successfully calculated potassium values with an absolute error of 0.36±0.34 mmol/L (or 10% of the measured blood potassium). For the global model, potassium prediction was also accurate, with an absolute error of 0.44±0.47 mmol/L for the training group (or 11% of the measured blood potassium) and 0.5±0.42 for the validation set (or 12% of the measured blood potassium).

Conclusions: The signal-processed ECG derived from a single lead can be used to calculate potassium values with clinically meaningful resolution using a strategy that requires no blood tests. This enables a cost-effective, noninvasive, unobtrusive strategy for potassium assessment that can be used during remote monitoring.

Keywords: electrophysiology; potassium; waves.


Figures

Figure 1
Figure 1
Patient flow. This diagram depicts patient enrollment and analysis. The development group consisted of 26 patients who underwent 3 dialysis sessions, the first of which was the training session used to create a personalized template. The personalized template was tested on days 3 and 5. During each dialysis session, blood was drawn before, during, and after dialysis. Another 8 patients composed validation group 2A, which underwent 3 dialysis sessions with 2 blood tests. Last, validation group 2B was composed of 11 patients who had undergone previous study but whose data were not used for creation of the algorithm. Further details are described in the text.
Figure 2
Figure 2
Artifact rejection algorithm. In this time‐compressed ECG tracing, the voltage amplitude is shown on the y‐axis, and time is shown on the x‐axis. The green line indicates the decision to accept or reject the signal as clean or noisy; when the line is positive, the signal is accepted, and when it becomes zero, the signal is rejected for noise. In the center section, the green line becomes zero, and the signal is rejected. The 2 blow‐up boxes demonstrate a magnified sample of ECG from a segment in which the signal was accepted by the algorithm (left box) and a segment during which it was rejected by the algorithm (right inset box). The purple line depicts the algorithmically calculated real‐time score assessing signal quality (larger value indicates more noise, poorer signal). When the purple signal‐quality line exceeds the horizontal black line (a threshold line), the signal is excessively noisy and is rejected (as indicated by the green line becoming zero). Due to data redundancy, noisy data are rejected and sufficiently clean signals are retained to permit analysis.
Figure 3
Figure 3
Temporal change of potassium using the temporal progression tool. This image is a still frame taken from Video S1. The left panel shows a representative ECG complex that has been processed, filtered, and displayed. The dashed ECG complex is an initial processed ECG acquired before dialysis commenced. The overlapping blue ECG tracing demonstrates the processed ECG acquired at the end of dialysis, at which point potassium had dropped from 5.0 to 3.4 mmol/L. The peak and the end of the T wave are continuously calculated by the algorithm and updated during the course of dialysis by the temporal progression tool, as shown in Video S1. The peak (tPeak) and the end (tOff) of the T wave are labeled. The brown straight line between tPeak and tOff shows the automatically calculated slope for that time interval, the T‐right slope. The 4 inset boxes to the right depict additional processing and data. The potassium value indicates the 3 blood potassium test results for this patient during the dialysis run demonstrated. The straight line between these points is assumed and does not reflect any actual data. The top‐right box demonstrates the feature used to calculate potassium in blue. The brown line in the center depicts the application of the Kalman filter used to remove transient, artifactual deviations to calculate the final potassium value. The bottom‐left box demonstrates the nonnormalized T‐right slope over time, and the bottom‐right box demonstrates the heart rate plot during the dialysis run.
Figure 4
Figure 4
Algorithmically calculated and laboratory potassium values. A, The algorithmically estimated potassium value using the personalized prediction system is on the ordinate, and the laboratory‐derived value is on the abscissa. Panels (B) and (C) reflect the same, using the global methodology. B, The first dialysis run was used to create global parameters, and those parameters were then tested in the same patients in dialysis runs 2 and 3. C, A separate validation set of patients was used to test the parameters developed using patient group 1. The yellow line represents a perfect match between calculated and laboratory potassium values, and the red boundaries represent the area for which each predicted value is within the 0.5 mmol/L absolute error range.
Figure 5
Figure 5
Cumulative mean absolute error in calculated potassium. In all panels, the abscissa shows the mean absolute error in calculated potassium, and the ordinate indicates the percentage of patients with that error. Panel (A) demonstrates the error when using the personalized predictor model. In panel (B), we see the same presentation of the data but using the global predictor applied to group 1 patients. In other words, the group of patients used to create the global model then had that model tested in subsequent dialysis sessions. In panel (C), the global predictor was applied to an independent cohort of patients (group 2A and 2B) to assess the parameters developed for one set of patients with regard to the other. As can be seen, when using the personalized predictor (A), 92% of patients had a mean absolute error <0.6 mmol/L. Abs indicates absolute.
Figure 6
Figure 6
Comparison of trends in potassium during dialysis using processed ECG and blood potassium. The left and right panels each show a dialysis run in 2 separate patients. Blue points indicate the potassium blood test results, and the brown line indicates the calculated real‐time potassium level. Note that the blue lines interpolated between the blood test results are not based on actual data. Also note the strong similarity in trends and potassium changes between the ECG‐derived and blood potassium values. This suggests that trending could be used to identify rising or falling potassium values, even in the absence of an absolute numerical value for potassium.

Similar articles

Cited by

References

    1. Einhorn LM, Zhan M, Hsu VD, Walker LD, Moen MF, Seliger SL, Weir MR, Fink JC. The frequency of hyperkalemia and its significance in chronic kidney disease. Arch Intern Med. 2009;169:1156–1162. - PMC - PubMed
    1. Goyal A, Spertus JA, Gosch K, Venkitachalam L, Jones PG, Van den Berghe G, Kosiborod M. Serum potassium levels and mortality in acute myocardial infarction. JAMA. 2012;307:157–164. - PubMed
    1. Gennari FJ. Hypokalemia. N Engl J Med. 1998;339:451–458. - PubMed
    1. Kovesdy CP. Management of hyperkalaemia in chronic kidney disease. Nat Rev Nephrol. 2014;10:653–662. - PubMed
    1. Weiner ID, Wingo CS. Hyperkalemia: a potential silent killer. J Am Soc Nephrol. 1998;9:1535–1543. - PubMed

Publication types

MeSH terms